



Ambev stock is locked in equilibrium. ABEV closed at $3.10 on July 29, sitting at the midpoint of its recent range. No meaningful directional conviction exists across any timeframe. The daily chart tells a story of compression rather than trend. For now, Ambev stock is simply waiting.
Summary
Key takeaways
- ABEV closed at $3.10 on July 29, precisely at the midpoint of its $3.00–$3.15 daily Bollinger Band range.
- Daily RSI at 50.25 and a near-zero MACD confirm maximum neutrality across the technical picture.
- The EMA200 at $2.90 provides a constructive long-term backdrop despite the absence of short-term momentum.
- A breakout above $3.15 or breakdown below $3.00 is required to establish any directional bias.
- Volatility is compressed across all timeframes, suggesting a forceful move will eventually follow.
Daily Structure: Neutral Regime With No Clear Catalyst
The daily chart presents a firmly neutral picture for Ambev stock with no tradable catalyst in either direction.
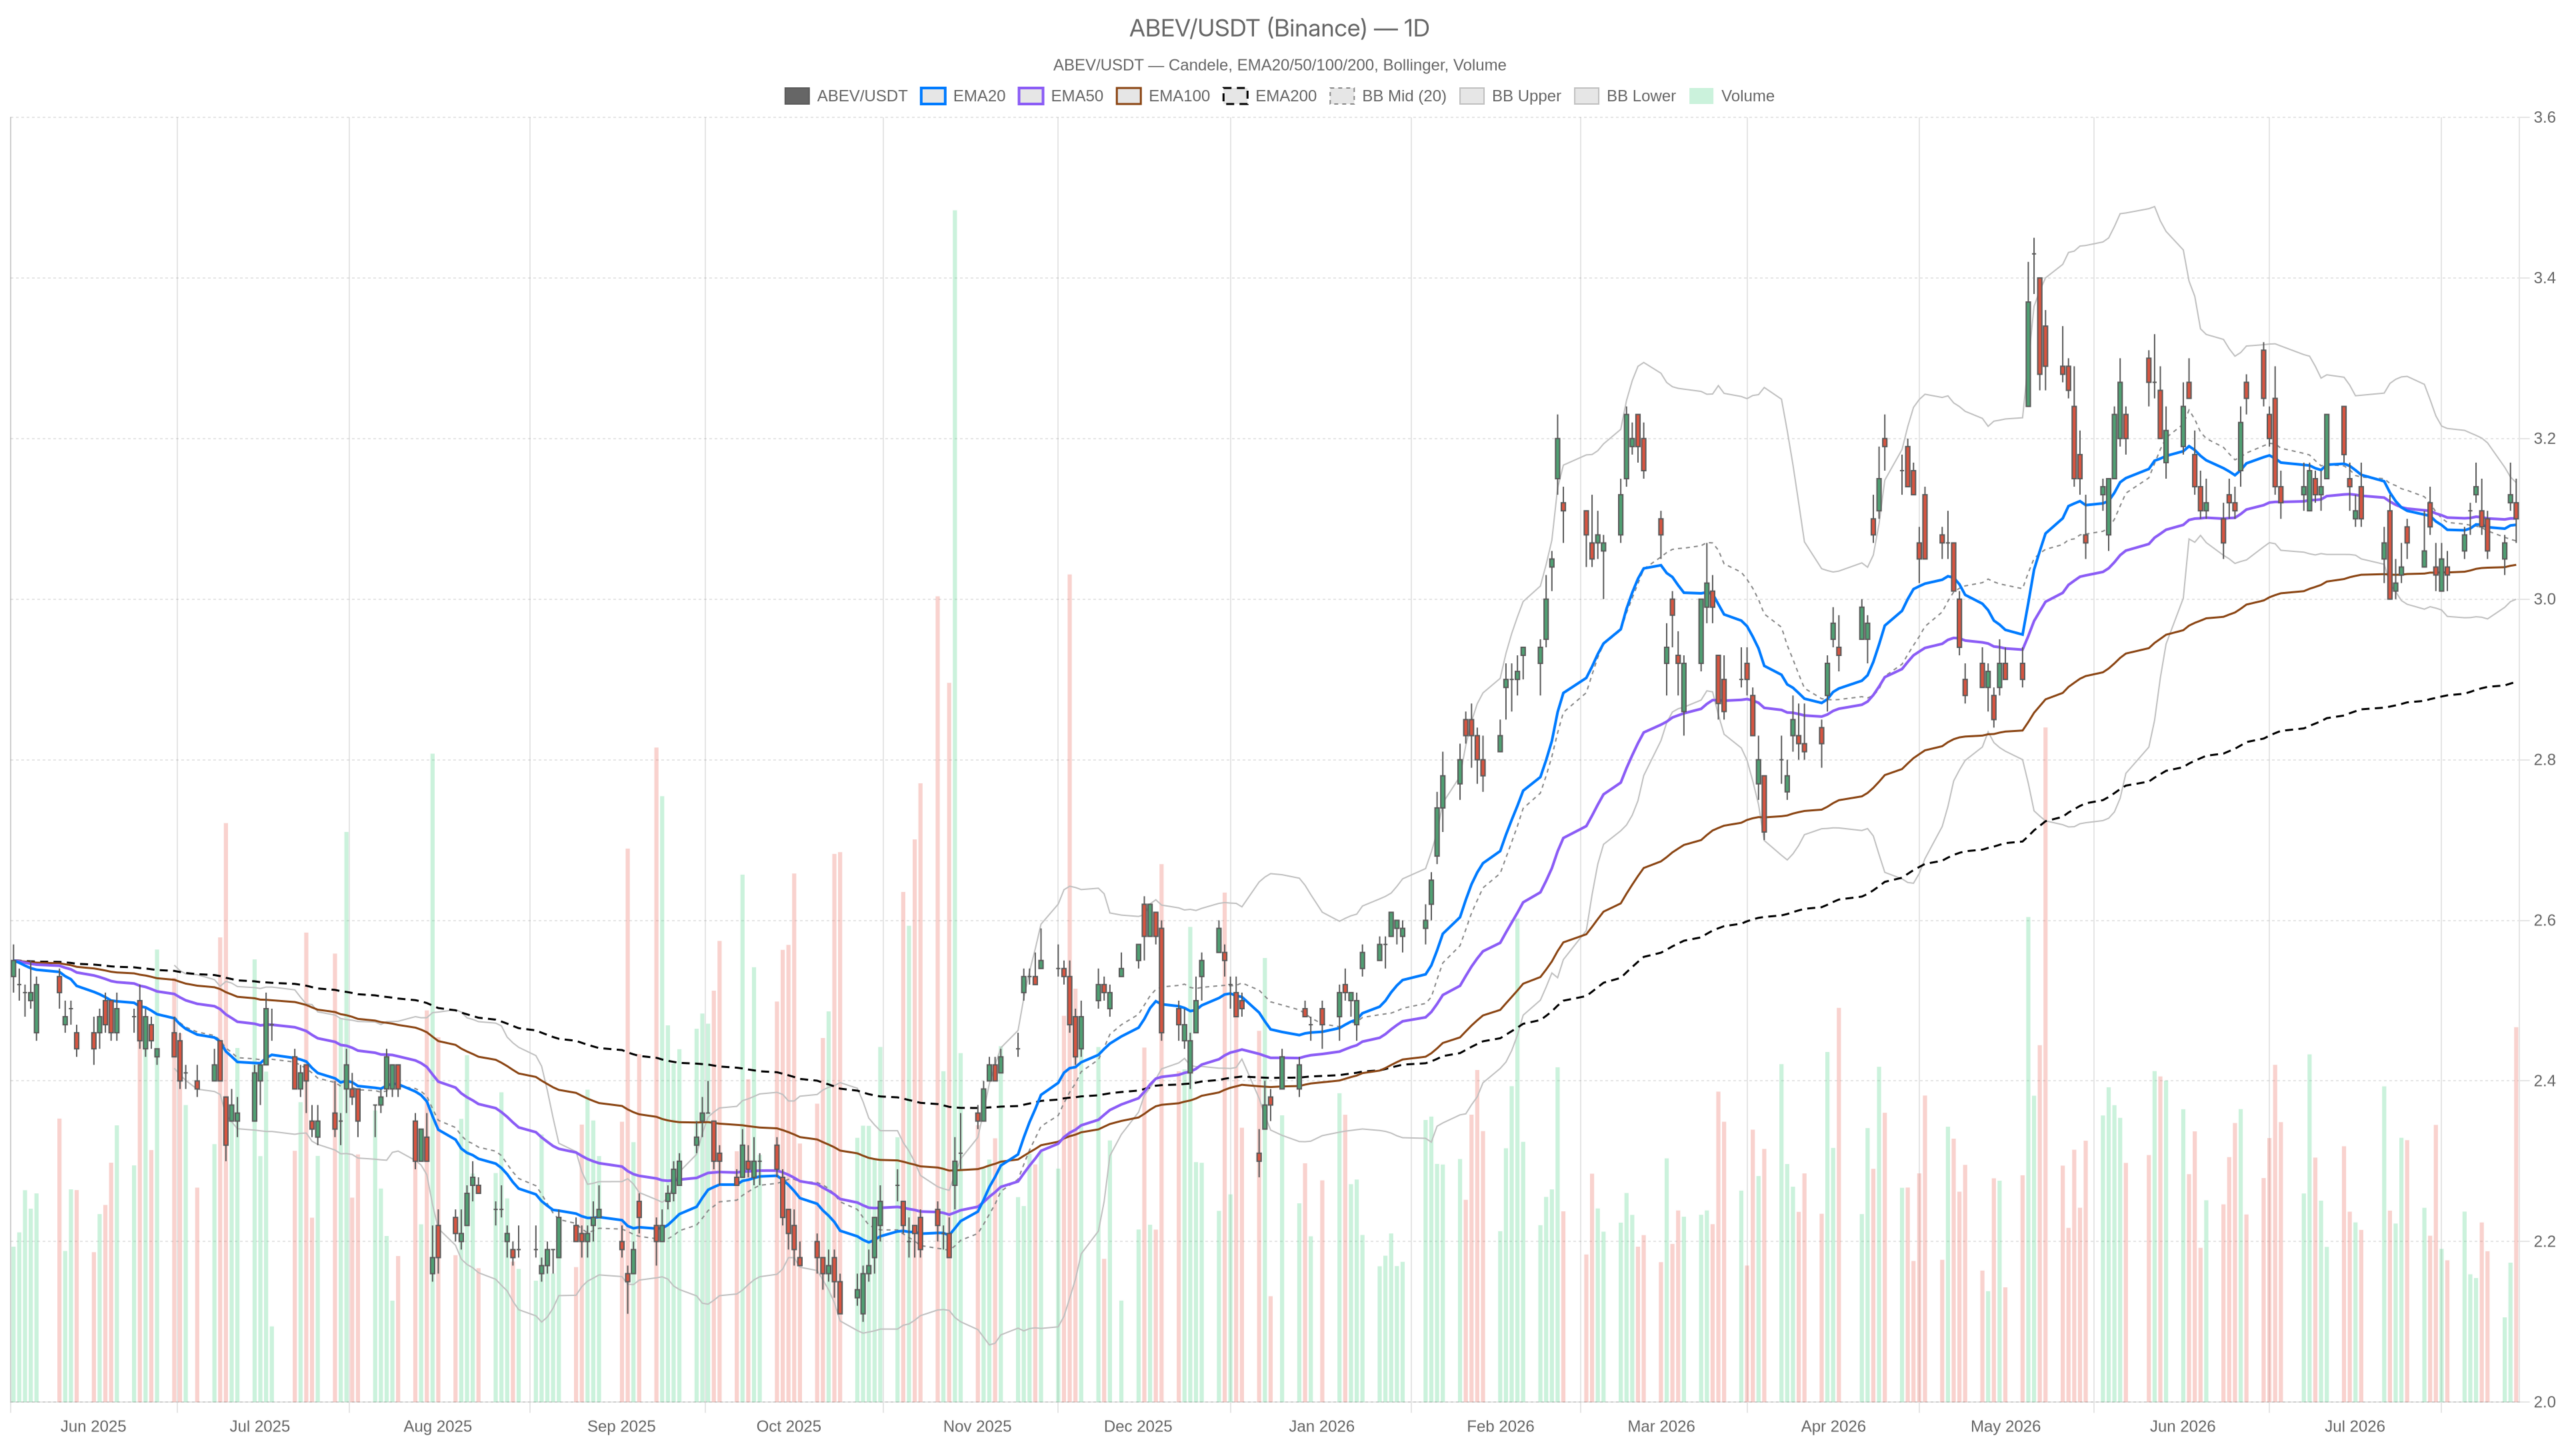
During the session, ABEV printed a high of $3.15 before retreating to close at $3.10. Price kissed the upper Bollinger Band, then pulled back to the midrange. The band structure places the mid at $3.07, the upper at $3.15, and the lower at $3.00. That $0.15 range neatly captures all recent price action.
The EMA picture reinforces this indecision. The EMA20 sits at $3.09 and the EMA50 at $3.10. Both averages are essentially flat and intertwined, offering no trend signal. However, the EMA200 at $2.90 does provide meaningful context. Price remains well above its long-term average. This means the broader structural backdrop stays constructive even as short-term momentum is absent.
The daily RSI at 50.25 is about as neutral as it gets. There is no overbought pressure and no oversold bounce in play. Meanwhile, the MACD line at -0.01 against a signal of -0.02 produces a histogram reading of +0.01. That micro-positive reading hints at a tiny bullish crossover. But the magnitude is too small to carry analytical weight on its own.
Overall, daily ATR of $0.07 confirms compressed volatility. The daily pivot sits at $3.11, with R1 at $3.14 and S1 at $3.06. ABEV closed just below its pivot — a subtle lean toward support.
Hourly and 15-Minute Views: Compression Confirmed
The lower timeframes fully confirm the daily neutrality in Ambev stock. Both the 1-hour and 15-minute charts mirror the same compression dynamic with no divergence.
1-Hour Chart Confirms the Neutral Stance
The 1-hour chart does not challenge the daily narrative. The last hourly candle closed at $3.10. The EMA20 at $3.10 and EMA50 at $3.09 remain essentially locked together. Notably, the hourly EMA200 sits at $3.11. This places price fractionally below that longer intraday average — a minor near-term headwind.
The hourly RSI at 50.2 echoes the daily reading with precision. At the same time, the MACD on this timeframe is flatlined at zero across line, signal, and histogram. That is not a signal. It is the absence of one. The hourly Bollinger Bands widen slightly to $3.03–$3.17. Price sits squarely at the mid. Hourly ATR of $0.03 confirms intraday volatility has all but disappeared.
15-Minute View Reflects Maximum Coiling
On the 15-minute chart, the picture is identical. All three EMAs — the 20, 50, and 200 — converge at $3.10. RSI prints 49.72. MACD is effectively flat. The 15-minute Bollinger Bands compress to $3.07–$3.13. This is as tight as it gets. The timeframe offers no edge for short-term timing. It simply signals that a move is coiling, not that one has arrived.
Bullish Scenario: What Would Drive Ambev Stock Higher
Ambev stock needs a clean break and hold above the $3.14–$3.15 zone to build a credible bullish case. That zone represents both daily R1 and the upper Bollinger Band. A daily close above $3.15 would signal a genuine breakout from this compression.
In that scenario, the micro-positive MACD histogram could accelerate. The EMA20 crossing above EMA50 would add technical confirmation. The fact that ABEV trades comfortably above its EMA200 at $2.90 matters here. Any bullish push would build on a foundation that already reflects a meaningful recovery. That gives a degree of credibility to any breakout attempt.
Bearish Scenario: Risks That Could Undermine Ambev Stock
The bearish risk centers on a break below the $3.00–$3.06 support zone. A move under daily S1 at $3.06 would shift the short-term structure negative. The $3.00 level carries both psychological weight and technical significance as the lower band anchor.
In that scenario, the MACD would likely extend its bearish lean. The RSI at 50 offers no protective floor. It could drop toward the low-40s quickly if sellers gain control. Therefore, the $3.00–$3.06 zone is the real line in the sand for bulls.
Positioning and Volatility Outlook for Ambev Stock
Ambev stock presents a market at maximum indecision with no high-conviction directional thesis. Every meaningful indicator tells the same story across all timeframes: equilibrium. RSI, MACD, EMA alignment, and Bollinger Band positioning all point to the same conclusion.
The compression in ATR readings across daily and intraday frames suggests volatility will eventually resolve. The resolution is likely to carry force. However, the direction remains genuinely unclear. For anyone watching Ambev stock closely, the message is patience. The $3.00–$3.15 range defines the current battleground. Until price breaks convincingly in either direction, this is a market for observation rather than aggression.
FAQ
What is the current technical outlook for Ambev stock?
The technical outlook for Ambev stock is firmly neutral. ABEV closed at $3.10 on July 29, sitting at the midpoint of its $3.00–$3.15 daily range. The daily RSI at 50.25 and a near-zero MACD confirm the absence of directional momentum across all timeframes.
What price levels should traders watch on ABEV?
The key levels to watch are $3.15 on the upside and $3.00–$3.06 on the downside. A daily close above $3.15 would signal a bullish breakout from the current compression. A break below $3.00 would shift the short-term structure negative. The EMA200 at $2.90 provides longer-term structural support.
Is Ambev stock more bullish or bearish right now?
Neither. Every meaningful indicator — RSI, MACD, EMA alignment, and Bollinger Band positioning — points to equilibrium across all timeframes. The market is coiling rather than trending. A clean break in either direction is required to establish a tradable bias.
Disclaimer: This article is for informational purposes only and does not constitute financial advice, an investment recommendation, or a solicitation to buy or sell any financial instrument or cryptocurrency. The analysis provided is not indicative of future results. Investing in crypto assets and financial markets carries a high risk of capital loss. Always do your own research (DYOR) and consult a qualified financial advisor before making any decision.
Article produced with the assistance of artificial intelligence and reviewed by the editorial team.
