




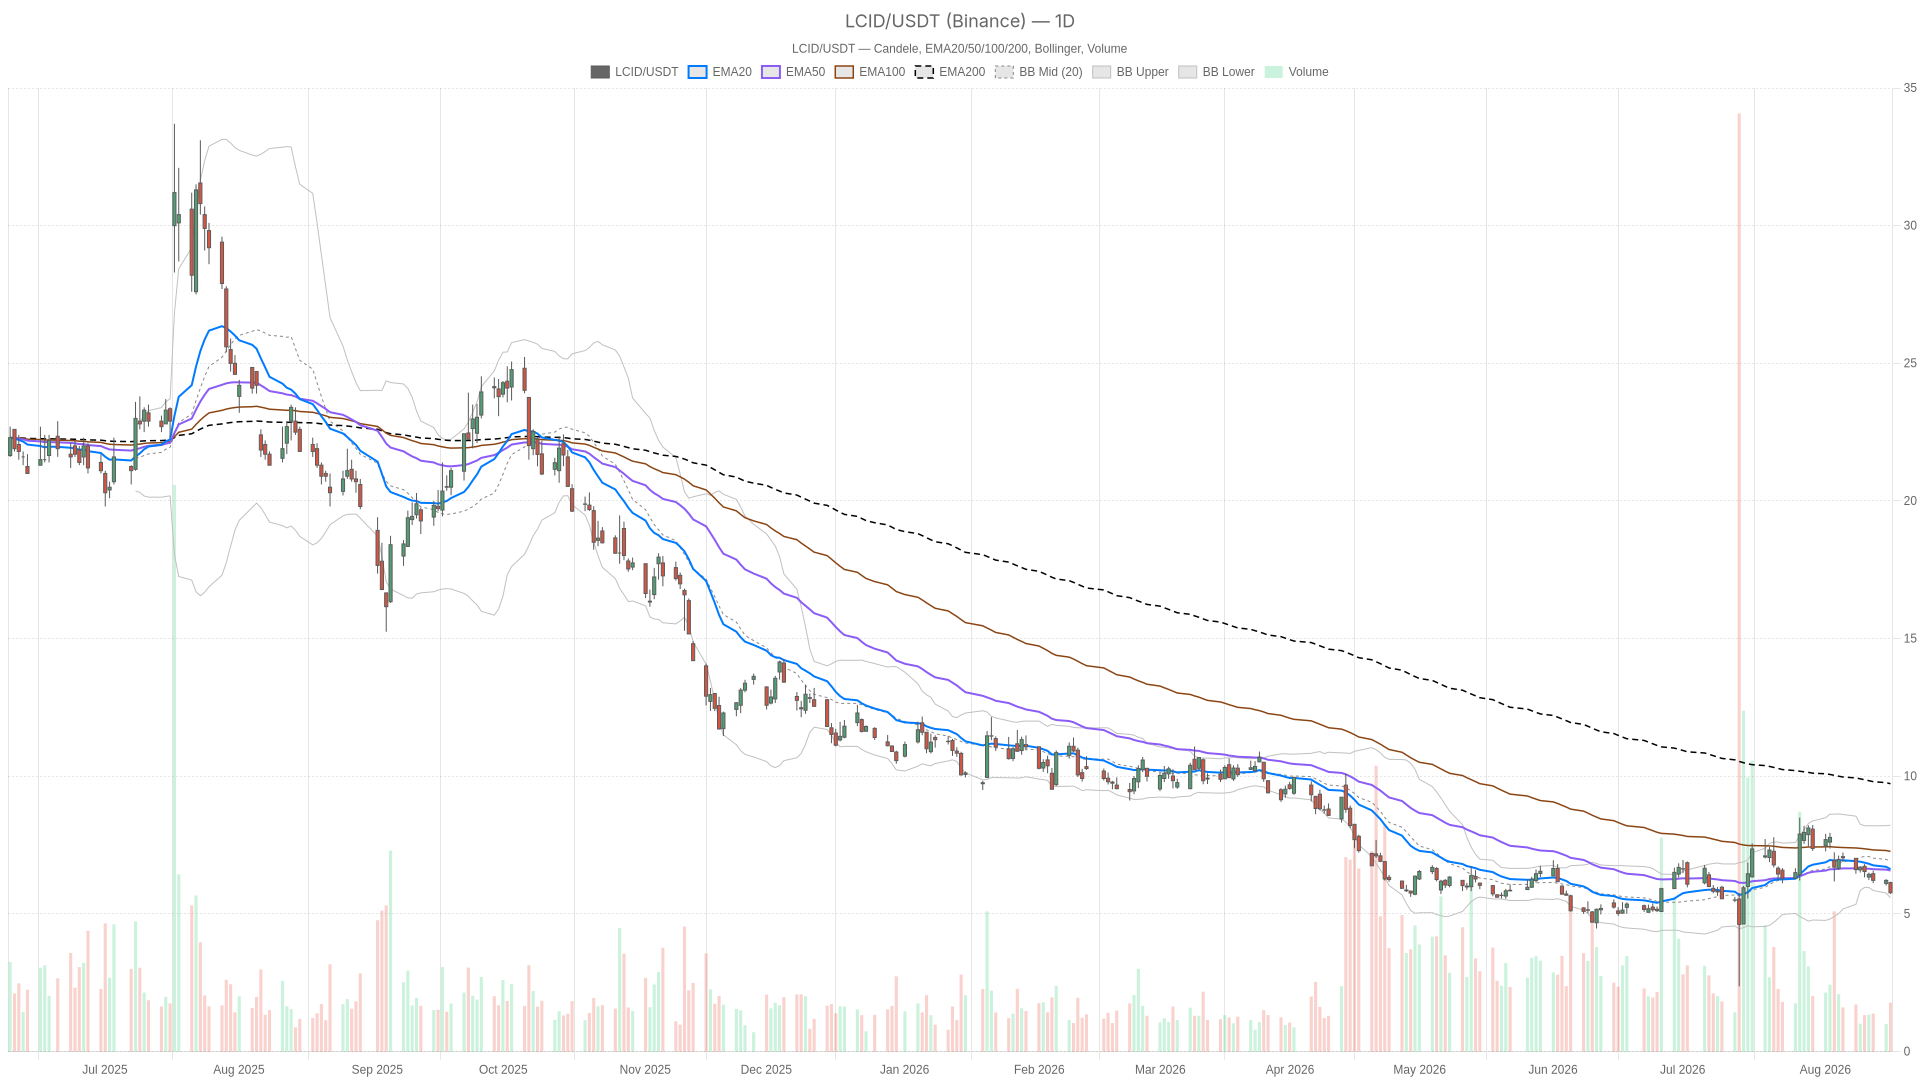
Lucid Stock closed at $5.77 on August 18, hovering just above key support at $5.61. Price remains well below all major daily EMAs, confirming the broader downtrend. Yet shorter-term momentum signals exhaustion, placing LCID at a critical technical crossroads.
Summary
Key takeaways
- LCID dropped 36.7% over the past six months but bounced nearly 40% from its June lows on catalysts including a new CEO and a robotaxi partnership
- Daily RSI14 at 40.08 signals neutral-to-soft momentum with sellers still controlling the tape
- Price sits just above daily pivot support at $5.61 and the lower Bollinger Band at $5.58
- Hourly RSI14 has reached 26.74, flagging oversold conditions that raise the odds of a short-term relief bounce
- The 200-day EMA at $9.73 underscores the magnitude of the long-term downtrend still in place
Notably, Lucid Stock shares dropped 36.7% over the past six months. However, the stock has also bounced nearly 40% off its June lows on a wave of catalysts. These include a new CEO and a major robotaxi partnership. This push-and-pull between deteriorating fundamentals and speculative optimism is reflected in the technical picture. The stock is caught between a heavy downtrend and pockets of short-term relief buying.
Daily Timeframe: Lucid Stock’s Dominant Bearish Bias
Lucid Stock’s daily chart confirms sellers remain firmly in control. Price trades well below all major exponential moving averages. RSI14 sits at 40.08, a neutral-to-soft reading that shows sellers still control the tape without the market being technically oversold. The MACD line at -0.07 sits below the signal line at 0.12. This produces a histogram of -0.19, confirming downside momentum is still building.
Meanwhile, the Bollinger Band structure adds further context. With the mid-band at 6.90 and the lower band at 5.58, Lucid Stock is trading in the lower third of its recent volatility range. Price testing the lower band typically signals either an oversold bounce setup or the early stage of a volatility expansion to the downside. ATR14 at 0.58 is meaningful relative to a sub-$6 share price, meaning daily swings remain large and unpredictable.
Notably, pivot levels reinforce the fragility of the current position. The daily pivot point sits at 5.89, with resistance at 6.05 and support at 5.61. Friday’s close beneath the pivot keeps sellers in short-term control. A decisive break of 5.61 would open the door toward the lower Bollinger Band near 5.58 and potentially lower.
1H Timeframe: Oversold But Still Bearish on LCID
The hourly chart reveals a bearish trend structure punctuated by oversold momentum. This creates conflicting signals for Lucid Stock traders. The regime is explicitly bearish, with price trading below the 20, 50, and 200-period EMAs at 6.07, 6.35, and 6.53 respectively. However, RSI14 has dropped to 26.74. This level typically flags oversold conditions and raises the odds of a short-term relief bounce.
Meanwhile, MACD on the 1H chart shows the line at -0.17 against a signal of -0.15. The histogram reads just -0.03. That narrow gap suggests bearish momentum is losing steam at the hourly level, even though the broader trend remains down. This is a classic conflict: the trend structure says sell, but momentum exhaustion says a bounce is due. Traders should treat this as a warning. Any short-term rally may simply be a pause within a larger downtrend rather than a reversal signal.
15-Minute Chart: Execution Context for LCID
Zooming into the 15-minute chart, Lucid Stock has stalled in an extremely tight range. Price is essentially glued to its pivot point at 5.78. Resistance sits at 5.80 and support at 5.76. RSI14 at 32.69 is approaching oversold territory. The MACD histogram has flattened to zero, with the line and signal both sitting at -0.08.
In practical terms, the immediate trend has stalled. Short-term traders watching Lucid Stock price action should note that any move above 5.80 would test the 15m EMA20 at 5.85. Conversely, a break below 5.76 could quickly pressure the hourly support zone near 5.75.
Bullish Scenario: What Lucid Stock Needs to Reverse
On the bullish side, Lucid Stock would need to reclaim the daily pivot at 5.89 and push through resistance at 6.05. A sustained move back above the hourly EMA20 at 6.07 would be an important signal. It would indicate that buyers are regaining short-term control. Given the oversold hourly RSI, a bounce toward the daily EMA50 at 6.58 is technically plausible if broader sentiment improves.
On the fundamental side, catalysts already in play provide narrative support for such a bounce. The robotaxi partnership and new CEO are notable drivers. Additionally, the recent unveiling of the Lucid Gravity GT-S signals continued product execution. This could help sentiment even amid liquidity concerns.
Bearish Scenario: What Would Invalidate a Lucid Stock Bounce
Conversely, a breakdown below daily support at 5.61 would confirm sellers remain in control of Lucid Stock. A subsequent close under the lower Bollinger Band at 5.58 would reinforce this pressure. It would also validate the daily MACD’s negative histogram as a sign of continuing downside pressure rather than a temporary dip.
Notably, the delay of the Cosmos SUV launch adds a fundamental risk layer to this bearish case. Reporting ties the delay to dwindling liquidity. If concerns about the cash position intensify, technical bounces are likely to be sold into rather than sustained. This would keep the long-term downtrend against the 200-day EMA at 9.73 firmly in place.
Closing Thoughts on Lucid Stock
Overall, the picture across timeframes is mixed rather than aligned. The daily chart confirms a dominant bearish structure. The hourly chart shows a bearish trend with oversold momentum. The 15-minute chart reflects a stalled, indecisive market. Therefore, this is not a moment for high-conviction directional assumptions.
Given elevated ATR readings and proximity to key support near 5.61 and 5.58, volatility is likely to remain a defining feature of Lucid Stock in the near term. Positioning should account for the possibility of sharp moves in either direction. Traders should watch closely how price behaves around the daily pivot and lower Bollinger Band before drawing firm conclusions about the next directional leg.
FAQ
Is Lucid Stock oversold right now?
On the hourly timeframe, Lucid Stock shows an RSI14 of 26.74, which is below the traditional oversold threshold of 30. This suggests a short-term relief bounce is possible. However, the daily RSI14 at 40.08 remains in neutral territory. The broader trend has not yet reached oversold extremes.
What are the key support levels to watch for Lucid Stock?
The most critical support levels are the daily pivot support at $5.61 and the lower Bollinger Band at $5.58. A break below these levels would likely accelerate selling pressure. On the hourly chart, the $5.75 zone provides nearer-term support.
What would it take for Lucid Stock to turn bullish?
Lucid Stock would need to reclaim the daily pivot at $5.89 and break through resistance at $6.05. A sustained move above the hourly EMA20 at 6.07 would signal buyers are regaining short-term control. Beyond that, a push toward the daily EMA50 at 6.58 would strengthen the bullish case.
Why did Lucid Stock drop 36.7% over six months despite positive catalysts?
While catalysts such as a new CEO, a robotaxi partnership, and the Lucid Gravity GT-S unveiling have generated optimism, fundamental concerns persist. These include dwindling liquidity and the delay of the Cosmos SUV launch. The technical picture reflects this tension between speculative buying and structural selling pressure.
Disclaimer: This article is for informational purposes only and does not constitute financial advice, an investment recommendation, or a solicitation to buy or sell any financial instrument or cryptocurrency. The analysis provided is not indicative of future results. Investing in crypto assets and financial markets carries a high risk of capital loss. Always do your own research (DYOR) and consult a qualified financial advisor before making any decision.
Article produced with the assistance of artificial intelligence and reviewed by the editorial team.
