




Lucid Stock surged 21.5% on July 28 after Saudi Prince Alwaleed bin Talal Al Saud disclosed a $129.5 million, 5% stake. The session pushed price above the daily Bollinger upper band, signaling momentum expansion. Yet the path to $10 remains far from clear.
Summary
Key takeaways
- Lucid Stock surged 21.5% on July 28 after Prince Alwaleed disclosed a $129.5 million, 5% stake in the EV maker.
- Price closed at $7.90, decisively above the daily Bollinger upper band of $7.84, signaling genuine volatility expansion on 39.6 million shares traded.
- The daily RSI at 63.65 still has room, but the hourly RSI at 76.18 is squarely overbought — raising near-term pullback risk.
- The EMA200 at $10.51 remains a distant ceiling, underscoring the structural damage from Lucid’s prolonged downtrend.
- Fundamental risks persist: bankruptcy rumors, an analyst-estimated earnings decline, an active fraud lawsuit, and missed delivery targets.
Lucid Stock Breaks Out on a $129.5 Million Catalyst
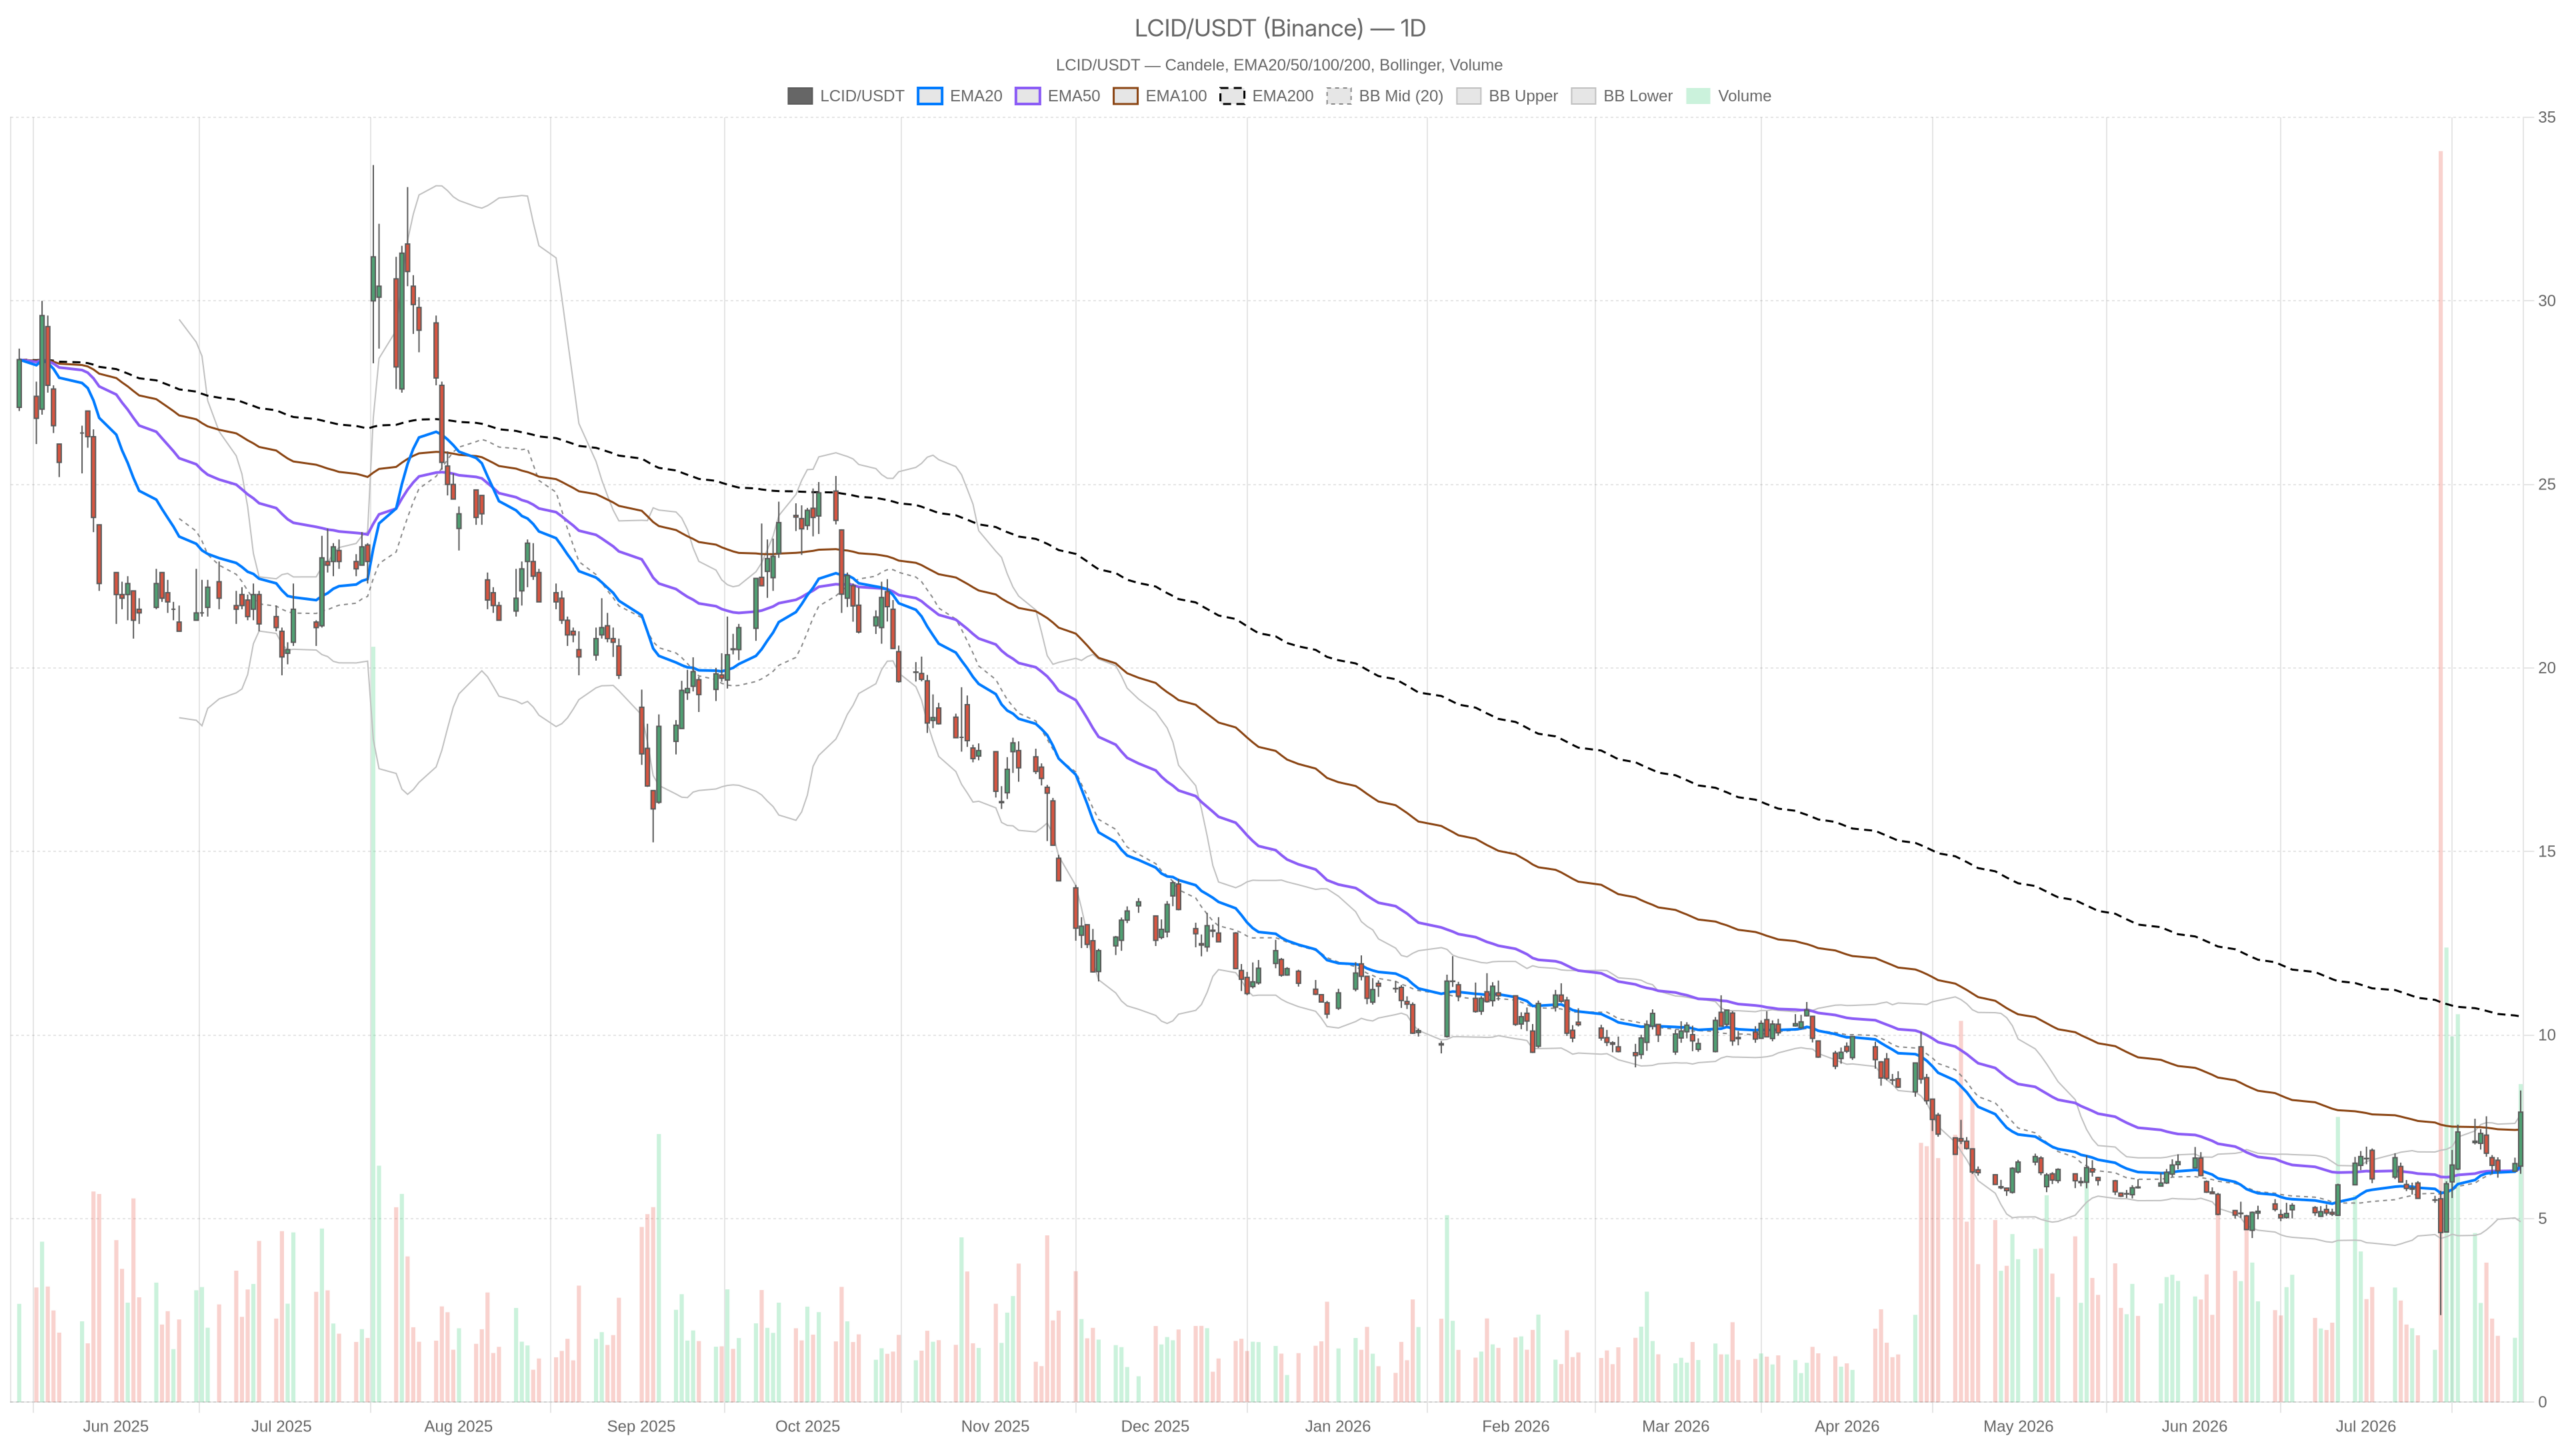
Prince Alwaleed’s $129.5 million stake disclosure triggered Lucid Stock’s most dramatic single-session move in recent memory, sending shares 21.5% higher. The session opened at $6.43 and pierced as high as $8.49 intraday before closing at $7.90. This close pushed price decisively above the daily Bollinger upper band of $7.84. That is a technically significant breach. It signals a momentum expansion that demands attention, even as the fundamental picture remains deeply complicated.
The daily timeframe defines the primary bias, and right now that bias is cautiously constructive. However, calling this a clean bullish setup would be premature. The price structure, the news catalyst, and the overhanging fundamental risks all pull in different directions simultaneously.
Daily Timeframe — Momentum Is Expanding, But Resistance Looms Above
The daily chart confirms a meaningful shift in near-term momentum, with price clearing both short-term EMAs. Still, the EMA200 at $10.51 underscores how far Lucid Stock must climb to repair its structural damage. The EMA20 sits at $6.43 and the EMA50 at $6.37 — both well below the $7.90 close. Price has cleared both moving averages with force.
Meanwhile, the EMA200 at $10.51 remains a distant ceiling. This is not a stock recovering from a mild correction. It is a stock attempting to claw back from a prolonged downtrend. The gap to the EMA200 reflects precisely that.
The daily RSI at 63.65 is approaching overbought territory but has not yet crossed 70. There is still room for continuation. However, the reading is firm enough to justify caution on aggressive long entries at current levels. The MACD is constructive: the line at 0.32 stands above the signal at 0.21, with a positive histogram of 0.11. Bullish momentum is building on the daily — not deteriorating.
The Bollinger Band breach is the most telling signal on this timeframe. Price closing above the upper band at $7.84 on high volume — 39.6 million shares — suggests genuine volatility expansion rather than a false spike. The ATR14 at $1.03 confirms elevated daily swings. Any trader engaging this name should size accordingly.
The daily pivot framework places resistance at R1 of $8.85 and support at S1 of $6.58. The pivot point itself sits at $7.54, now below the close. That flip is meaningful — prior resistance becomes a reference for any near-term pullback.
Hourly Timeframe — Bullish Regime Confirmed, But Overbought Conditions Are Real
The hourly chart reinforces the bullish narrative with stacked EMAs and a positive MACD. However, the hourly RSI at 76.18 is squarely overbought. This materially raises the probability of a short-term consolidation or mean-reversion dip.
All three EMAs are stacked bullishly on the hourly: EMA20 at $6.90, EMA50 at $6.70, EMA200 at $6.23. Price at $7.92 trades well above all of them. The hourly MACD histogram of 0.18 is strongly positive. The regime classification is explicitly bullish. In contrast to the daily regime — which remains labeled neutral — the hourly provides the directional confirmation the daily lacks.
The hourly Bollinger upper band sat at $7.73. Price has broken above it, creating a double Bollinger breakout across both timeframes. That is a notable structural signal. The hourly ATR of $0.36 implies tight intraday swings relative to the scale of the daily move. This suggests the surge was concentrated and decisive rather than choppy.
Hourly pivot resistance sits at R1 of $8.02, with support at $7.78. This narrow band defines the immediate battleground. A hold above $7.78 on any near-term retrace would be constructive for bulls.
15-Minute Context — Execution Zone Tightens Near $7.86–$8.00
The 15-minute chart shows the market digesting the day’s explosive move. Price is pinned between pivot support at $7.86 and resistance at $7.99. A clean break above $8.00 would open the path toward $8.85. The regime is bullish, with RSI at 71.69 and a positive MACD histogram of 0.06.
Notably, the histogram is narrowing slightly. This hints at near-term momentum deceleration at the intraday level. Conversely, a slip below $7.86 on rising volume would warrant caution about a short-term reversal developing.
The Fundamental Backdrop — A Vote of Confidence Against a Wall of Risk
Prince Alwaleed’s $129.5 million stake purchase provides a high-profile vote of confidence in Lucid Stock. Yet the fundamental backdrop is far from clean, with multiple unresolved risks still overhanging the company. Lucid had recently been fending off bankruptcy rumors. Analysts estimate a decline in earnings in the upcoming report. A fraud lawsuit is active. The company has burned through billions in cash and missed delivery targets.
Furthermore, Lucid is up 33% over the past month — easily outpacing Tesla and Rivian. This raises the question of whether the rally is driven by genuine re-rating or by a short squeeze amplified by a high-profile investor headline. The Motley Fool noted the 21.5% single-day gain was entirely catalyst-driven. That distinction matters. Sentiment-fueled moves can reverse as quickly as they appear.
Bullish Scenario — If Momentum Sustains, $8.85 Is the Next Target
The bull case hinges on consolidation above the $7.54 daily pivot and $7.78 hourly support. Under those conditions, the next technical objective is $8.85 — the daily R1. A sustained close above $8.85 would shift the daily regime from neutral to bullish. This would invite more momentum-driven buyers.
The Saudi stake also provides a credibility signal that could attract institutional interest ahead of the earnings print. The broader EV sector narrative and Lucid’s brand positioning around the Lucid Air could provide incremental support. However, this scenario requires the fundamental risks to remain contained, not escalate.
Bearish Scenario — Overbought Readings Could Trigger a Sharp Reversal
The bear case is equally grounded: hourly RSI at 76.18 signals overbought conditions. Meanwhile, the upcoming earnings report could shift sentiment rapidly if it confirms the analyst consensus of a decline. The fraud lawsuit and lingering bankruptcy narrative have not been resolved. They have merely been interrupted by a high-profile stake purchase.
A failure to hold above $7.54 — the daily pivot — would signal the rally is fading. A breakdown below $6.58, the daily S1, would invalidate the bullish case entirely. It would re-open the path toward prior lows. At that point, the EMA20 and EMA50 near $6.37–$6.43 would be the last structural defense before a deeper retracement.
Positioning, Volatility, and the Uncertainty Ahead
Lucid Stock stands at a genuine inflection point. The technical structure has improved materially, but it has done so on a sentiment catalyst — not a fundamental turnaround. The daily ATR of $1.03 demands respect. This is a name capable of $1-plus daily swings in either direction.
Overall, the risk-reward profile rewards patience over urgency. Waiting for consolidation above key pivot levels is the more disciplined approach than chasing price already extended above two Bollinger upper bands. The earnings report, the fraud litigation, and the bankruptcy discourse remain live variables. Until those clouds clear, any bullish conviction in LCID must be held with an equally firm awareness of the downside.
FAQ
What caused Lucid Stock’s 21.5% surge on July 28?
Saudi Prince Alwaleed bin Talal Al Saud disclosed a $129.5 million, 5% stake in the EV maker, triggering the dramatic single-session rally that pushed shares from a $6.43 open to an $8.49 intraday high.
What are the key resistance levels for Lucid Stock after the surge?
The daily R1 at $8.85 is the immediate technical objective. The EMA200 at $10.51 represents the major structural resistance overhead and reflects the scale of the downtrend Lucid must overcome.
Is Lucid Stock overbought right now?
The hourly RSI at 76.18 is squarely overbought, suggesting elevated near-term pullback risk. The daily RSI at 63.65 still has room for continuation, creating a mixed signal across timeframes.
What fundamental risks should Lucid Stock investors watch?
Key risks include an analyst-estimated earnings decline in the upcoming report, an active fraud lawsuit, persistent bankruptcy rumors, and a history of missed delivery targets that have eroded market confidence.
Disclaimer: This article is for informational purposes only and does not constitute financial advice, an investment recommendation, or a solicitation to buy or sell any financial instrument or cryptocurrency. The analysis provided is not indicative of future results. Investing in crypto assets and financial markets carries a high risk of capital loss. Always do your own research (DYOR) and consult a qualified financial advisor before making any decision.
Article produced with the assistance of artificial intelligence and reviewed by the editorial team.
