




Visa Inc. stock is pressing against resistance after a strong Q3 2026 earnings beat. Revenue hit $11.6 billion, EPS reached $3.32, and payments volume surpassed $4 trillion. The daily trend remains firmly bullish, but short-term fatigue signals are now emerging.
Summary
Key takeaways
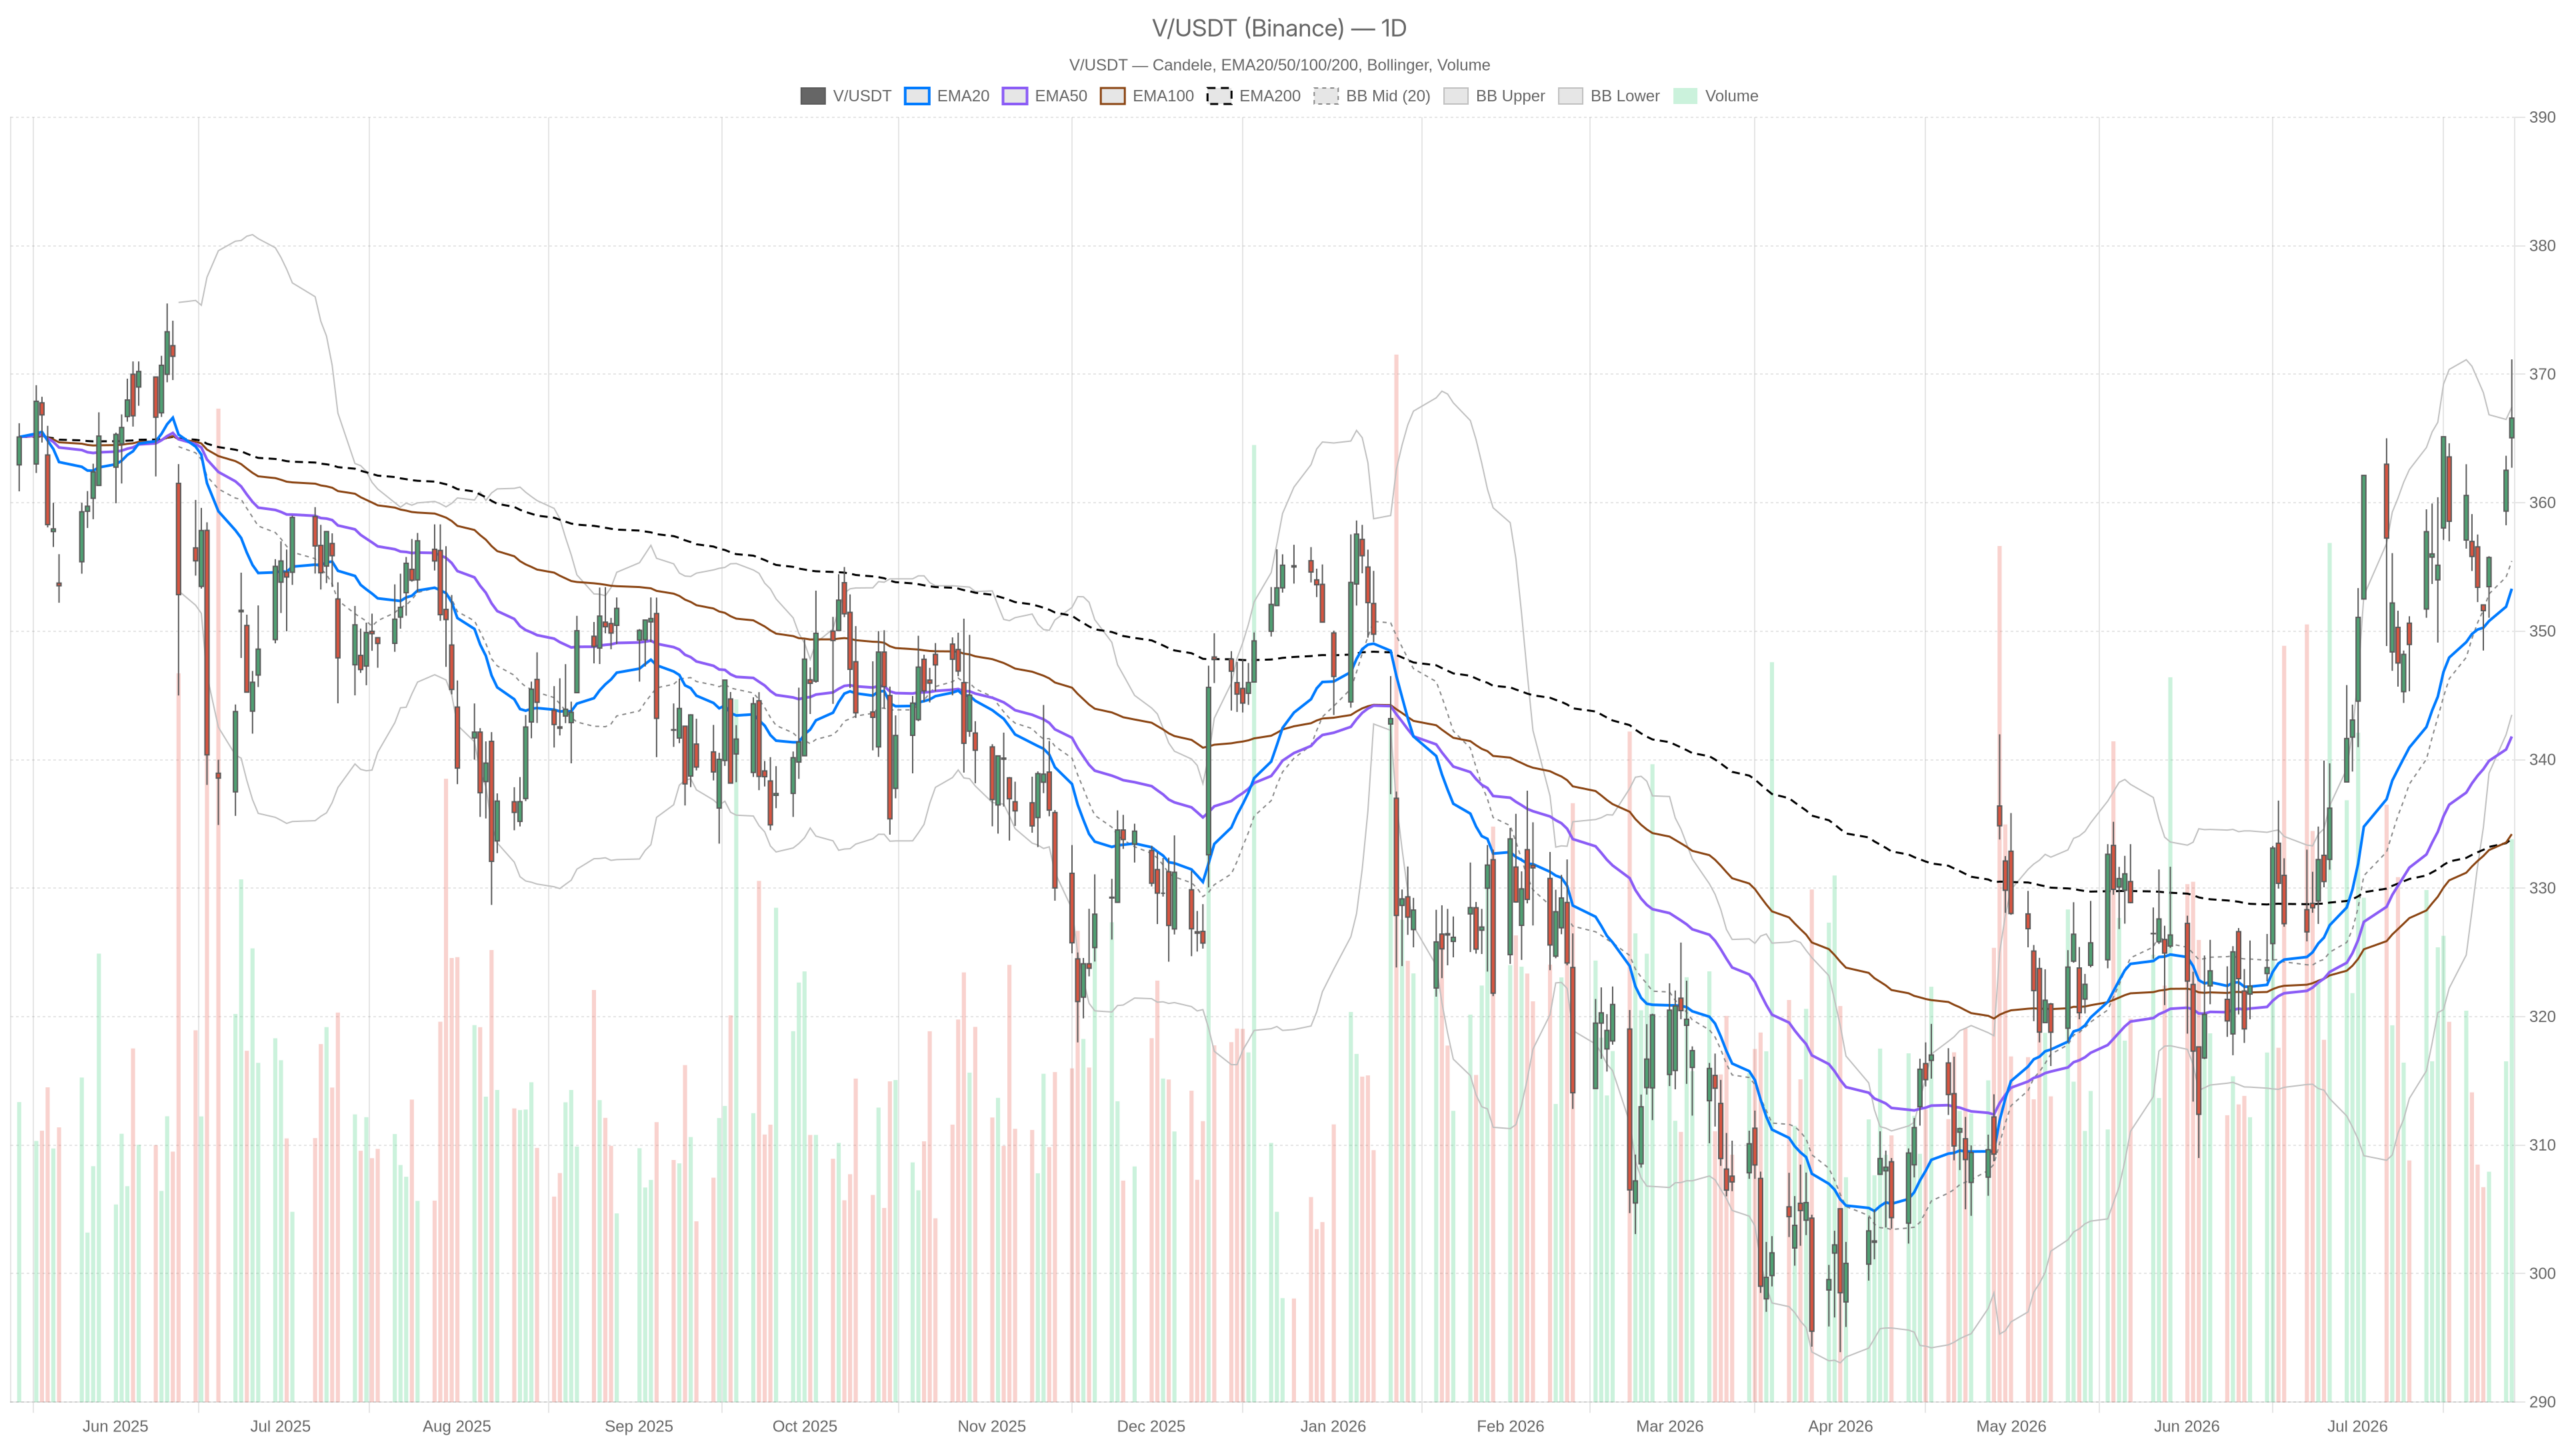
- Visa closed at $366.59 on July 28, near the daily upper Bollinger Band at $367.44.
- Fiscal Q3 net revenue rose 14% YoY to $11.6 billion; EPS climbed 11% to $3.32.
- The daily MACD shows a subtle negative histogram of -0.19, hinting at momentum plateauing.
- The 15-minute chart reflects short-term fatigue, with price slipping below the EMA20.
- A break above $371 would open the path to $373; failure at S1 of $362.49 risks a deeper pullback.
Daily Structure: Visa Inc. Stock Holds a Clean Bullish Trend
The daily chart confirms Visa Inc. stock is in a clean bullish trend. Price sits well above all three key exponential moving averages — the EMA20 at $353.31, EMA50 at $341.81, and EMA200 at $333.84. Each average fans out in a bullish alignment, reflecting sustained buying pressure across multiple timeframes.
The daily RSI sits at 65.16 — elevated but not yet overbought. This signals intact momentum without the overheating that often precedes sharp reversals.
However, the daily MACD deserves attention. The MACD line stands at 6.71 against a signal of 6.90, producing a histogram of -0.19. This subtle negative cross suggests momentum may be plateauing even as price remains elevated.
Meanwhile, the Bollinger Bands frame the situation clearly. The upper band sits at $367.44, and V’s close of $366.59 is pressing right against it. Closes near the upper band confirm trend strength. Still, they raise the probability of mean reversion toward the midline at $355.47.
Daily pivot analysis adds further context. The pivot point sits at $366.83 — essentially at current price. Resistance at R1 is $370.92, while support at S1 is $362.49. V is consolidating around the pivot, calling for directional resolution rather than assumption.
Hourly Confirmation: Momentum Remains Supportive
The 1H timeframe broadly confirms the bullish daily bias. Price at $366.89 sits above all three hourly EMAs: EMA20 at $363.23, EMA50 at $359.60, and EMA200 at $349.78. The trend structure on this timeframe remains fully intact.
Notably, the hourly MACD is in a more constructive position than the daily. The MACD line reads 3.45 against a signal of 2.84, delivering a positive histogram of 0.61. This positive cross suggests momentum is still building on an intraday basis.
Similarly, the hourly RSI at 64.69 mirrors the daily reading — healthy, trending, not overextended. Bollinger Bands on this frame show the upper band at $373.11. This gives price room to push higher before hitting structural resistance. Hourly ATR at $2.47 reflects contained intraday volatility.
On the hourly pivot grid, R1 at $369.08 is the immediate hurdle. A clean break there would target the $371–$373 zone. This area converges with daily resistance and the daily upper Bollinger Band ceiling.
15-Minute Frame: Short-Term Fatigue After the Earnings Spike
In contrast, the 15-minute chart shows signs of near-term fatigue. The regime registers as neutral. Price at $366.89 has slipped below the 15m EMA20 at $368.28 and sits just above the EMA50 at $365.21. This does not signal a reversal, but it flags that the immediate impulse has stalled.
The 15m MACD confirms the stall. The line at 1.21 has crossed below the signal at 1.61, with a histogram of -0.41. Short-term sellers are testing the intraday trend. RSI at 46.73 on this frame has retreated to near-neutral. This marks a significant drop from the elevated daily and hourly readings.
At the same time, price sits at the bottom of the 15m Bollinger Band range. The lower band at $366.18 acts as immediate support. The 15m ATR of $1.20 suggests tight range conditions. This is an execution-level signal — it hints at a potential short-term pullback before any continuation attempt.
Bullish Scenario: Can Earnings Strength Drive a Break Above $371?
The bullish case for Visa Inc. stock rests on fundamental momentum from Q3 earnings aligning with the dominant daily trend. If V reclaims the $369–$370 zone and clears R1 at $370.92 on a closing basis, the path opens toward $373 and beyond. Cross-border travel growth and payments volume exceeding $4 trillion are meaningful tailwinds. These metrics suggest Visa’s revenue engine is accelerating, not decelerating.
For this scenario to materialize, the 15m structure needs to stabilize above $365.23. This is the S1 support level shared across both 15m and hourly pivots. A consolidation above that level, followed by a renewed push through hourly R1, would be the execution signal. That would confirm continuation for long positions.
Bearish Scenario: MACD Softness and Resistance Pressure Risk a Pullback
On the other hand, the bearish case centers on the daily MACD’s negative histogram and the risk that the earnings pop marked a short-term top. The MACD’s negative reading, however modest, warns that the trend may be losing its engine. V’s close below the daily Bollinger upper band at $367.44 raises a key question. Was the earnings beat a sell-the-news event? The after-hours slip noted in post-earnings reporting adds weight to that concern.
Additionally, the headline about $563 million in job cut-related costs introduces an overhead narrative. This could weigh on sentiment. Rising expenses alongside the revenue beat were flagged explicitly in earnings commentary. If the market starts pricing that in more aggressively, a pullback toward daily S1 at $362.49 becomes plausible.
A failure below that level would shift attention toward the $355 midline of the daily Bollinger Band. In that case, the bullish daily structure would be weakened. However, it would not be broken unless price falls meaningfully below the EMA20 at $353.31.
Positioning in a High-Conviction, High-Volatility Moment
Overall, the prudent approach to Visa Inc. stock is conditional bullishness. The daily trend is bullish, the earnings story is strong, and hourly momentum supports further upside. Yet the stock is pressing against multiple resistance levels simultaneously. These include the daily upper Bollinger Band, pivot points, and an earnings-driven spike already fading on shorter timeframes.
Therefore, the prudent read is one of respecting the trend without chasing. The trend deserves deference. However, the cluster of resistance near $370–$371 and the softening daily MACD warrant caution. This is not a moment for uncritical directional bets.
Volatility, as measured by an ATR of $7.15 on the daily frame, is meaningful. A full daily range can erase short-term gains quickly. Traders should remain alert to how price behaves at current pivot levels before committing to the next directional leg.
FAQ
What was Visa’s Q3 2026 earnings performance?
Visa reported fiscal Q3 net revenue of $11.6 billion, up 14% year-over-year. Earnings per share rose 11% to $3.32, and payments volume surpassed $4 trillion for the quarter. Both revenue and EPS exceeded the company’s own expectations.
Is Visa Inc. stock still in a bullish trend?
Yes. On the daily timeframe, Visa Inc. stock trades well above the EMA20 ($353.31), EMA50 ($341.81), and EMA200 ($333.84). All three averages fan out in bullish alignment. The daily RSI at 65.16 confirms momentum without being overbought.
What resistance levels should traders watch for Visa Inc. stock?
The immediate resistance sits at $370.92 (daily R1), with the $371–$373 zone representing a convergence of the daily upper Bollinger Band and the earnings-driven high. A clean break above $371 on a closing basis would open the path higher.
What are the key near-term risks for Visa Inc. stock?
The daily MACD shows a subtle negative histogram (-0.19), suggesting momentum may be plateauing. The 15-minute chart reflects short-term fatigue, and V is pressing against multiple resistance levels. A failure at S1 ($362.49) could trigger a pullback toward $355.
Disclaimer: This article is for informational purposes only and does not constitute financial advice, an investment recommendation, or a solicitation to buy or sell any financial instrument or cryptocurrency. The analysis provided is not indicative of future results. Investing in crypto assets and financial markets carries a high risk of capital loss. Always do your own research (DYOR) and consult a qualified financial advisor before making any decision.
Article produced with the assistance of artificial intelligence and reviewed by the editorial team.
