




Visa stock closed Tuesday’s session at $364.25, just below the day’s high of $365.90. The move followed a strong fiscal third quarter and keeps the bullish structure intact even as short-term momentum shows early hesitation.
Summary
Key takeaways
- Visa stock closed Tuesday at $364.25, up from an open of $359.62 and just below the day’s high of $365.90.
- Fiscal Q3 revenue climbed 14% to $11.6 billion, with adjusted profit of $6.3 billion and payment volume growth of 10%.
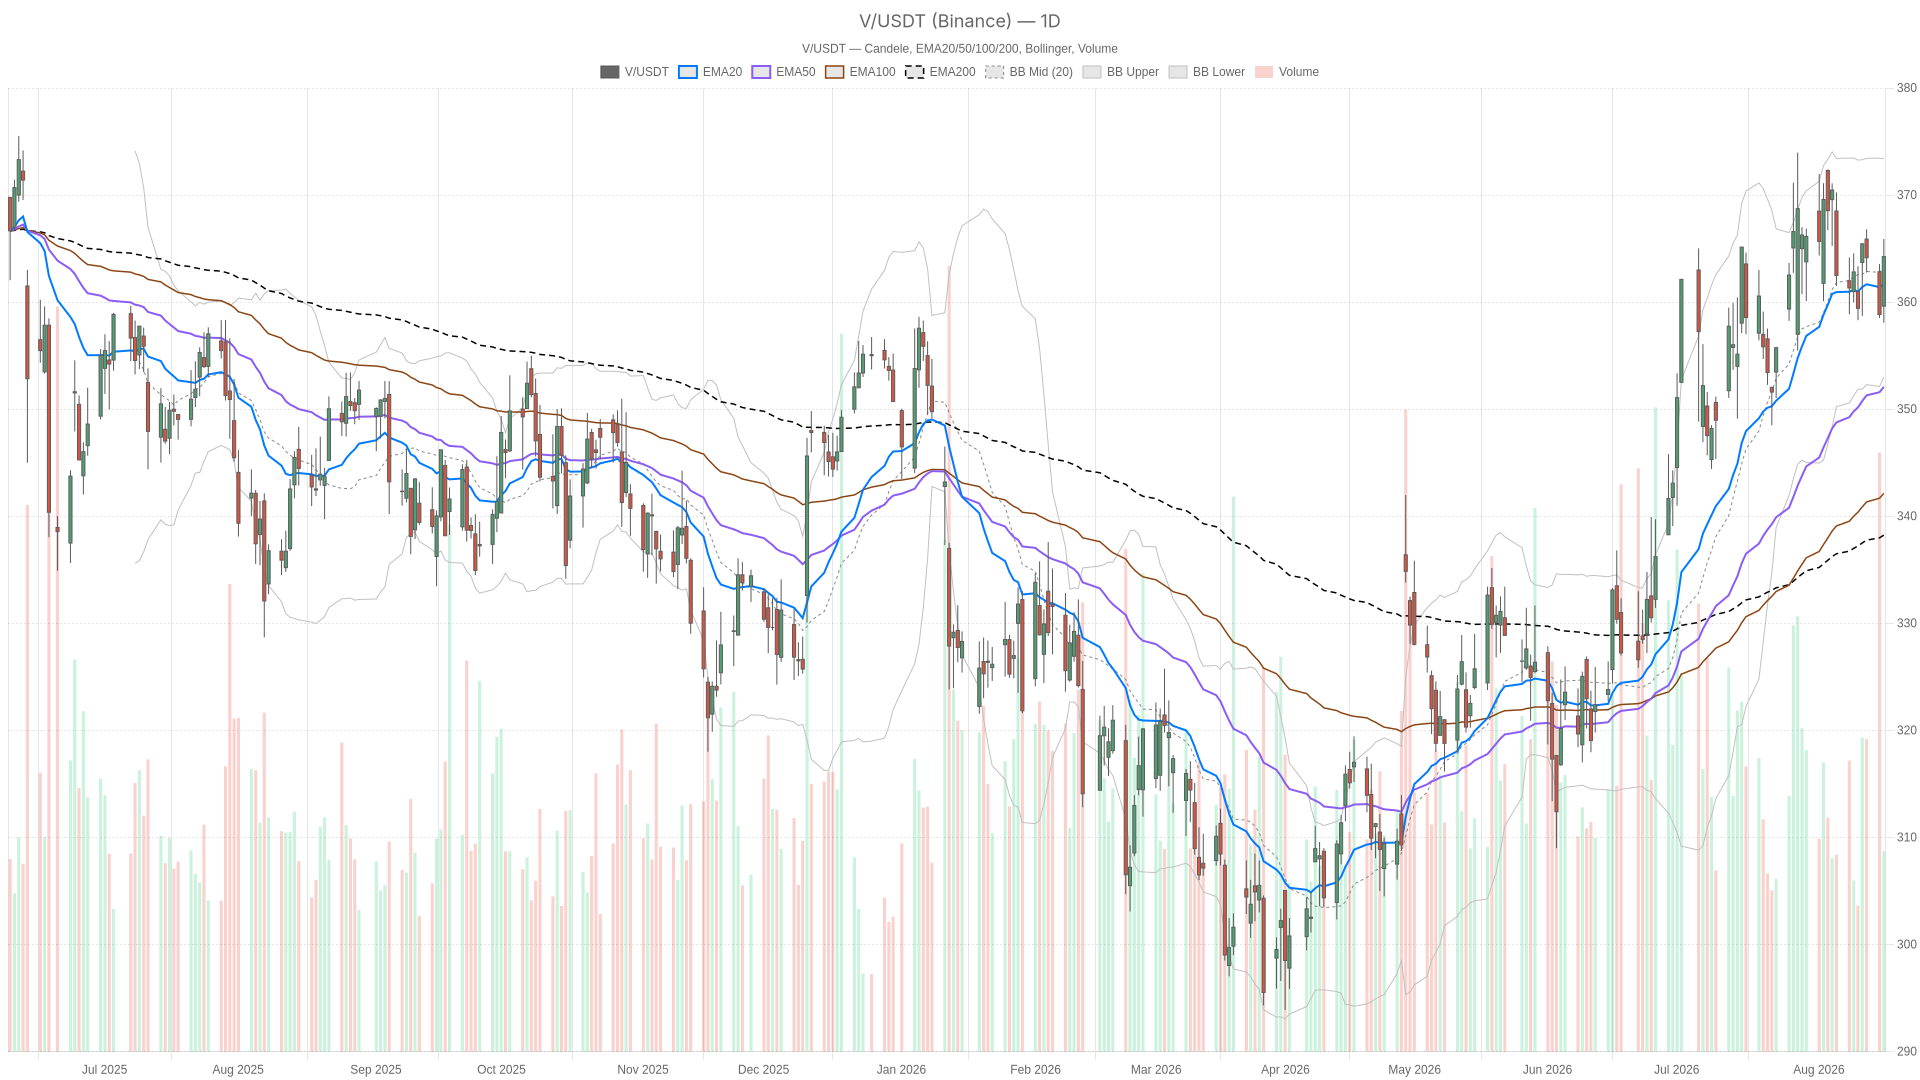
- The daily trend is bullish. Price holds above the 20-day EMA at 361.67, the 50-day EMA at 352.08, and the 200-day EMA at 338.24.
- Daily MACD momentum is cooling at a negative histogram of -1.37, while the 1-hour MACD histogram is positive at 0.37.
- A daily close below the 50-day EMA at 352.08 would be the key warning sign for the bullish thesis.
What the Daily Chart Says About Visa Stock’s Trend
The daily chart confirms a bullish structure for Visa stock. Price is trading above the 20-day EMA at 361.67. It also holds above the 50-day EMA at 352.08 and the 200-day EMA at 338.24. This stacked alignment is a textbook bullish structure, and the daily regime reading confirms it directly. RSI14 sits at 55, comfortably in neutral-to-bullish territory, with no overbought pressure yet.
Daily MACD Cools While Bollinger Bands Leave Room
However, the daily MACD tells a slightly different story. The MACD line at 3.16 remains below its signal line at 4.53. This produces a negative histogram of -1.37. In practice, momentum is cooling even as the broader trend stays intact. It is not a reversal signal on its own, but it is a caution flag worth watching.
Meanwhile, price is pressing against the middle Bollinger Band at 363.20. The upper band sits at 373.39, while the lower band is at 353.01. There is still room to the upside before volatility bands would flag an overbought extension. Daily ATR14 at 6.65 confirms that Visa stock continues to trade with a healthy, not excessive, daily range.
Hourly Momentum Confirms, But With a Twist
The 1-hour chart supports the bullish read, with a fresh momentum signal. Price at 364.35 sits above the EMA20 (363.32), EMA50 (363.08), and EMA200 (359.52). The regime is again classified as bullish. RSI14 at 54.85 mirrors the daily reading almost exactly. This reinforces the idea that momentum is balanced rather than stretched in either direction.
A Cross-Timeframe Momentum Conflict
Notably, the hourly MACD diverges from the daily picture. The MACD line at 0.67 is above its signal at 0.30. This creates a positive histogram of 0.37, a fresh bullish signal on the hourly chart. Meanwhile, the daily MACD histogram remains negative.
This is a genuine cross-timeframe conflict. The bigger trend is cooling slightly, while shorter-term hourly momentum is trying to reaccelerate. In practice, the pullback in daily momentum has not yet translated into weakness on a more granular basis. Buyers are still active intraday.
15-Minute Chart: Short-Term Pause Inside the Uptrend
The 15-minute chart shows a neutral pause, not a trend change. RSI14 has slipped to 48.66, just below the midpoint. The MACD histogram has turned negative at -0.18. The regime itself is now labeled neutral.
Price is sitting near the lower Bollinger Band at 364.39. The mid-band is at 365.18 and the upper band at 365.97. This tight range reflects the very low ATR14 of 0.65. Meanwhile, the short-term softness looks more like a pause than a trend change.
At the same time, the 15-minute EMA structure (364.82, 363.80, 363.22) is still loosely bullish. The pivot point at 364.69, with resistance at 365.35 and support at 363.69, defines a narrow trading band. For intraday participants, this is the zone to watch for the next directional trigger.
Bullish Scenario for Visa Stock
The bullish case rests on the daily EMA stack and the earnings backdrop. A sustained hold above the daily EMA20 at 361.67 would keep the trend aligned. Reclaiming momentum above the daily MACD signal line would strengthen the case for continuation.
A break above the daily R1 pivot at 367.41 could open the path toward the upper Bollinger Band at 373.39. On the hourly chart, confirmation would come from RSI staying above 50. Price would also need to hold above the EMA20/EMA50 cluster near 363.
The recent revenue growth and payment volume expansion give this scenario a fundamental tailwind. That is a factor pure technicals do not capture on their own.
Bearish Scenario and What Would Invalidate the Uptrend
The bearish case hinges on a deeper momentum failure, not an immediate trend break. A daily close below the 50-day EMA at 352.08 would be a meaningful warning sign. A break of the daily S1 pivot at 359.58 would suggest the bullish structure is losing control.
On the hourly chart, losing the EMA20 at 363.32 would be the first sign of weakness. Drifting below the EMA50 at 363.08 would flip short-term momentum negative. In turn, that would align with the already-fading 15-minute MACD histogram.
In that case, a move below the 15-minute S1 at 363.69 would likely mark the first leg of a more genuine pullback. A break below the lower Bollinger Band at 364.39 would reinforce that view.
Overall Bias: Bullish Structure With Near-Term Choppiness
Overall, Visa stock remains structurally bullish, with short-term choppiness as the main near-term risk. The daily trend is firmly bullish, and the hourly picture mostly confirms it. The 15-minute chart reflects a brief pause rather than a reversal.
Therefore, positioning here should account for the possibility of short-term choppiness even within a structurally intact uptrend. Volatility, as measured by ATR across all three timeframes, remains contained rather than extreme. This limits the risk of a violent dislocation in either direction.
Still, with daily momentum cooling and hourly momentum trying to reassert itself, some uncertainty around the next move is warranted. Traders should treat the pivot levels on each timeframe as the practical lines in the sand.
FAQ
What is the current trend for Visa stock?
The daily trend is bullish. Visa stock closed Tuesday at $364.25. It is trading above the 20-day EMA at 361.67, the 50-day EMA at 352.08, and the 200-day EMA at 338.24.
What did Visa report in its latest quarter?
Visa reported a fiscal third quarter with strong results. Revenue climbed 14% to $11.6 billion, with adjusted profit of $6.3 billion and payment volume growth of 10%.
What level would invalidate the bullish case for Visa stock?
A daily close below the 50-day EMA at 352.08 would be a meaningful warning sign. A break of the daily S1 pivot at 359.58 would also suggest the bullish structure is losing control.
Why is there a momentum conflict between timeframes?
The daily MACD histogram is negative at -1.37, showing cooling momentum. However, the 1-hour MACD histogram is positive at 0.37, which is a fresh bullish signal.
Disclaimer: This article is for informational purposes only and does not constitute financial advice, an investment recommendation, or a solicitation to buy or sell any financial instrument or cryptocurrency. The analysis provided is not indicative of future results. Investing in crypto assets and financial markets carries a high risk of capital loss. Always do your own research (DYOR) and consult a qualified financial advisor before making any decision.
Article produced with the assistance of artificial intelligence and reviewed by the editorial team.
