




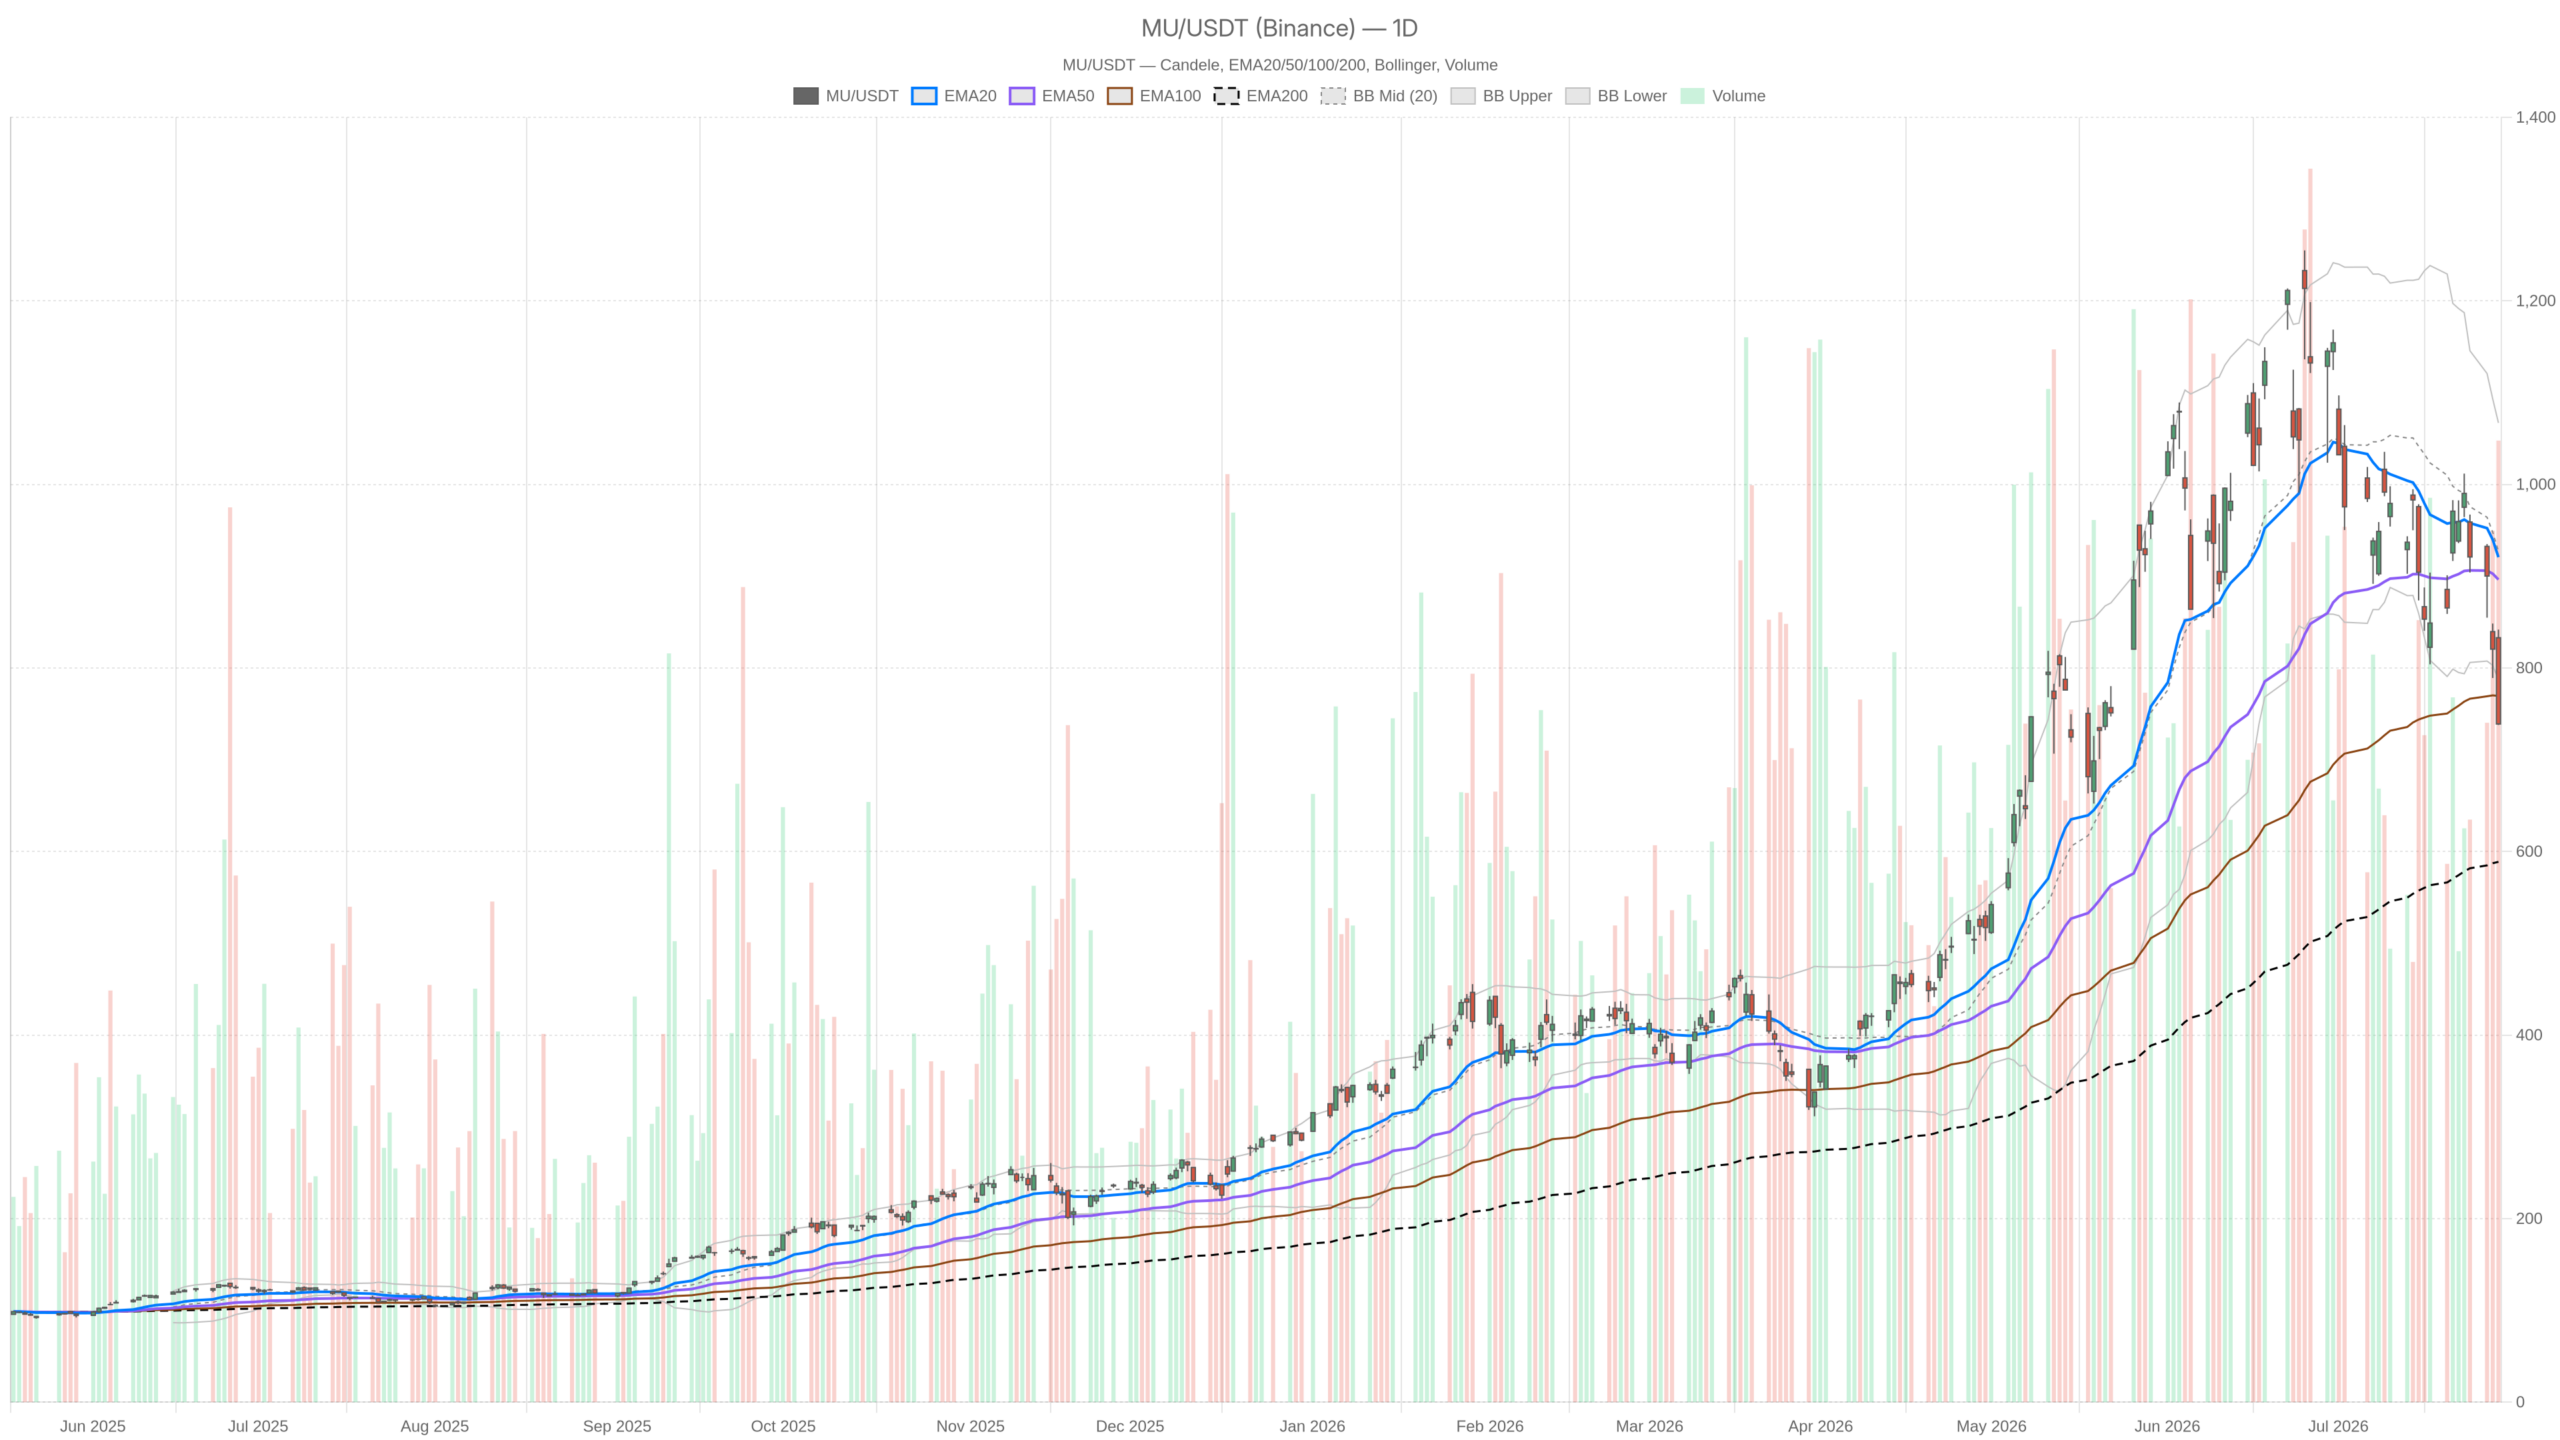
Micron Stock faces one of its sharpest near-term corrections, with MU collapsing toward critical support. After surging 637% in a year on AI-driven memory demand, the stock closed July 29 at $739. The daily trend has turned decisively against bulls.
Summary
Key takeaways
- MU closed at $739 on July 29 after an intraday range from $832.92 down to $737.88.
- Daily RSI at 35.69 and a widening MACD histogram confirm accelerating downside momentum.
- The CEO sold $37 million in shares as the stock declined from record highs.
- Key support sits at $703.99 (daily S1); resistance to reclaim starts at $772.89.
- The long-term EMA200 at $588.74 remains a distant structural floor.
Micron Stock Daily Chart: The Main Bias Is Bearish
The daily chart bias is decisively bearish. MU trades well below key moving averages, and momentum indicators confirm sustained selling — not a brief shakeout.
Moving Averages Turn Into Overhead Resistance
The daily structure has deteriorated significantly. MU is trading well below the EMA20 at $920.67. It also sits beneath the EMA50 at $896.30. Both moving averages once acted as support. Now they form overhead resistance. Only the EMA200 at $588.74 remains well below price, offering a distant long-term floor. The gap between current price and the 200-day average shows how far Micron Stock has fallen. It also highlights how much room remains before structural support comes into play.
Momentum Indicators Signal Accelerating Decline
Daily RSI sits at 35.69. It is not yet oversold by the classic threshold. However, it is clearly in bearish territory. The reading reflects sustained selling pressure rather than a brief shakeout. Meanwhile, the MACD reinforces that view. The MACD line at -35.88 runs well below the signal at -15.68. The histogram stands at -20.20. This divergence has been widening. It signals that downside momentum is accelerating rather than stabilizing.
Volatility and Pivot Levels Deepen the Bearish Case
Price closed at $739, breaching the lower Bollinger Band at $787.34 on an intraday basis. When price pushes through the lower band with expanding bands, it typically signals a trending decline. The daily ATR of $78.67 confirms extreme volatility. A single-day range of nearly $104 is not noise. It reflects institutional conviction on the sell side. The pivot point sits at $772.89, with S1 at $703.99. Price currently trades below the pivot, leaning toward S1 as the next meaningful reference. R1 at $807.91 would need to be reclaimed before any reversal narrative gains credibility. Overall, the daily regime remains under heavy pressure.
Hourly Chart Confirms Micron Stock Breakdown
The hourly chart intensifies the bearish case without reservation. RSI has collapsed to 23.22, and a clean bearish moving average stack confirms the intraday direction.
The 1-hour chart offers no relief. Price closed the last session at $737.88. It sits beneath the EMA20 at $816.56, the EMA50 at $869.54, and the EMA200 at $945.87. This clean bearish stack across all three short-term moving averages leaves no ambiguity about intraday direction.
Notably, the 1H RSI has collapsed to 23.22 — firmly into oversold territory. Tactical bounces and short-covering become plausible at these levels. However, oversold readings in a strong downtrend are notoriously unreliable as reversal signals. They often resolve through time-based consolidation rather than sharp recoveries.
On the momentum front, the hourly MACD line at -42.31 against a signal of -37.26 produces a histogram of -5.05. The histogram has narrowed slightly from its most extreme readings. This could hint at a marginal slowing in selling velocity. Still, the signal remains deeply negative.
On the Bollinger Bands, price presses against the lower band at $725.61. This suggests the stock is in an extended stretch. A brief mean reversion toward $820.92 is possible. However, such a move would remain a bounce within a downtrend — not a structural turn. The 1H regime is explicitly flagged bearish, confirming the daily bias.
15-Minute Execution Context for MU
The 15-minute chart offers no clean entry in either direction. All three EMAs are stacked bearishly above price, and the regime confirms the broader downtrend without hesitation.
For short-term traders, the 15-minute chart underscores the difficulty of finding a clean entry. The 15m RSI at 30.64 approaches oversold but has not fully confirmed it. All three EMAs — 20 at $774.09, 50 at $800.80, and 200 at $875.39 — are stacked bearishly above price. The MACD histogram at -1.32 shows marginally negative momentum.
Meanwhile, the 15m Bollinger Band lower boundary at $746.94 briefly contained price on the most recent candle. The ATR of $14.07 reflects tight intraday ranges. This is consistent with exhaustion, though not yet reversal. The regime is flagged bearish at this level too.
Micron Stock Bullish Scenario: AI Memory Cycle as Anchor
The bullish case for Micron Stock hinges on the AI memory supercycle remaining intact. For this scenario to materialize technically, MU must hold above $703.99 and reclaim the pivot at $772.89.
The fundamental narrative supporting bulls has not evaporated. Multiple analysts noted on July 29 that Micron’s earnings solidified an AI bottlenecks thesis. Memory was identified as the largest exposure category for physical AI infrastructure plays. One Seeking Alpha analysis highlighted a 4.77x EBITDA discount. It cited strong DRAM pricing and AI-driven demand as reasons for an upgrade. Some analysts frame this as an “AI panic” rather than a structural breakdown. They argue the memory supercycle remains intact.
For this scenario to materialize technically, MU would need to hold above the daily S1 at $703.99. It must also reclaim the pivot at $772.89. A subsequent push above $807.91 — the daily R1 — would begin to shift the short-term structure. The long-term EMA200 at $588.74 remains a reminder of how much structural cushion still exists beneath current levels.
Micron Stock Bearish Scenario: CEO Selling and Momentum Collapse
The bearish case carries significant near-term weight. The CEO’s $37 million share sale compounds the technical damage, and a break below $737.88 would open a path toward $703.99.
In contrast, the bearish scenario draws strength from both technical and fundamental signals. Micron’s CEO sold $37 million worth of shares as the stock sank from record highs. This headline compounds the technical damage with an unflattering insider signal. Whether the sale was pre-planned or discretionary, the optics are difficult to dismiss. The market was already unnerved by the severity of the drawdown.
Technically, if the stock fails to hold $737.88 — the July 29 low — the next meaningful reference becomes the daily S1 at $703.99. A break there opens a path toward the lower Bollinger Band, which has already been breached. The daily MACD histogram remains deeply negative with no sign of base-building. The lack of a bullish divergence on any timeframe is a concern for anyone looking to step in early.
Micron Stock Positioning and Final Assessment
Micron Stock is caught between a powerful AI growth narrative and an aggressive technical breakdown. The $770–$808 range should be treated as a potential distribution zone until daily structure repairs itself.
The daily timeframe defines the bias as bearish. The hourly chart confirms it without complication. The 15-minute chart reflects a market under exhaustion. However, exhaustion alone does not produce sustained recoveries in high-volatility downtrends.
With a daily ATR of $78.67, the risk on both sides of any trade is elevated. Traders and investors should treat any bounce toward the $770–$808 range as a potential distribution zone. This holds until the daily structure repairs itself. The longer-term bull case built on AI memory demand remains a credible thesis. But in the short run, the tape is not yet cooperating.
FAQ
What is the current trend for Micron Stock?
The current trend for Micron Stock is decisively bearish across daily, hourly, and 15-minute timeframes. MU closed at $739 on July 29, well below the EMA20 at $920.67 and EMA50 at $896.30. Daily RSI sits at 35.69, and the MACD histogram continues to widen, signaling accelerating downside momentum with no signs of stabilization.
What are the key support and resistance levels for MU?
Key support sits at $703.99 (daily S1), with the long-term EMA200 at $588.74 providing a distant structural floor. On the resistance side, MU must reclaim the pivot at $772.89 first, followed by R1 at $807.91, before any reversal narrative gains credibility.
Why is Micron Stock falling despite strong AI demand?
Micron Stock is falling due to aggressive technical selling compounded by an insider confidence shock. The CEO sold $37 million in shares as the stock declined from record highs. Meanwhile, daily momentum indicators show no sign of stabilizing, with the MACD histogram deeply negative and RSI firmly in bearish territory at 35.69.
Is the AI memory supercycle thesis still valid for Micron?
The AI memory supercycle thesis has not been invalidated by the current selloff. Analysts continue to cite strong DRAM pricing and a 4.77x EBITDA discount as fundamental support. However, the technical structure must repair itself — starting with a reclaim of $772.89 — before the thesis can regain market traction.
Disclaimer: This article is for informational purposes only and does not constitute financial advice, an investment recommendation, or a solicitation to buy or sell any financial instrument or cryptocurrency. The analysis provided is not indicative of future results. Investing in crypto assets and financial markets carries a high risk of capital loss. Always do your own research (DYOR) and consult a qualified financial advisor before making any decision.
Article produced with the assistance of artificial intelligence and reviewed by the editorial team.
