




Meta stock is under pressure after Q2 earnings missed expectations, triggering an 11% after-hours decline. Soft Q3 revenue guidance and rising AI infrastructure costs drove a sharp selloff. Yet the daily chart reflects a market caught between structural damage and oversold conditions.
Summary
Key takeaways
- Meta stock closed at $585.61 on July 29, below its EMA20, EMA50, and EMA200 simultaneously.
- Q3 revenue guidance midpoint of $62.5 billion fell short of the $63.24 billion analyst consensus.
- The daily MACD histogram reads -7.76, confirming well-established downside momentum.
- RSI at 41.44 has not yet entered oversold territory, leaving room for further selling.
- Despite the selloff, the analyst community remains broadly constructive, with Seeking Alpha assigning an $815 price target.
Daily Chart: Is Meta Stock Under Distribution or Just Consolidating?
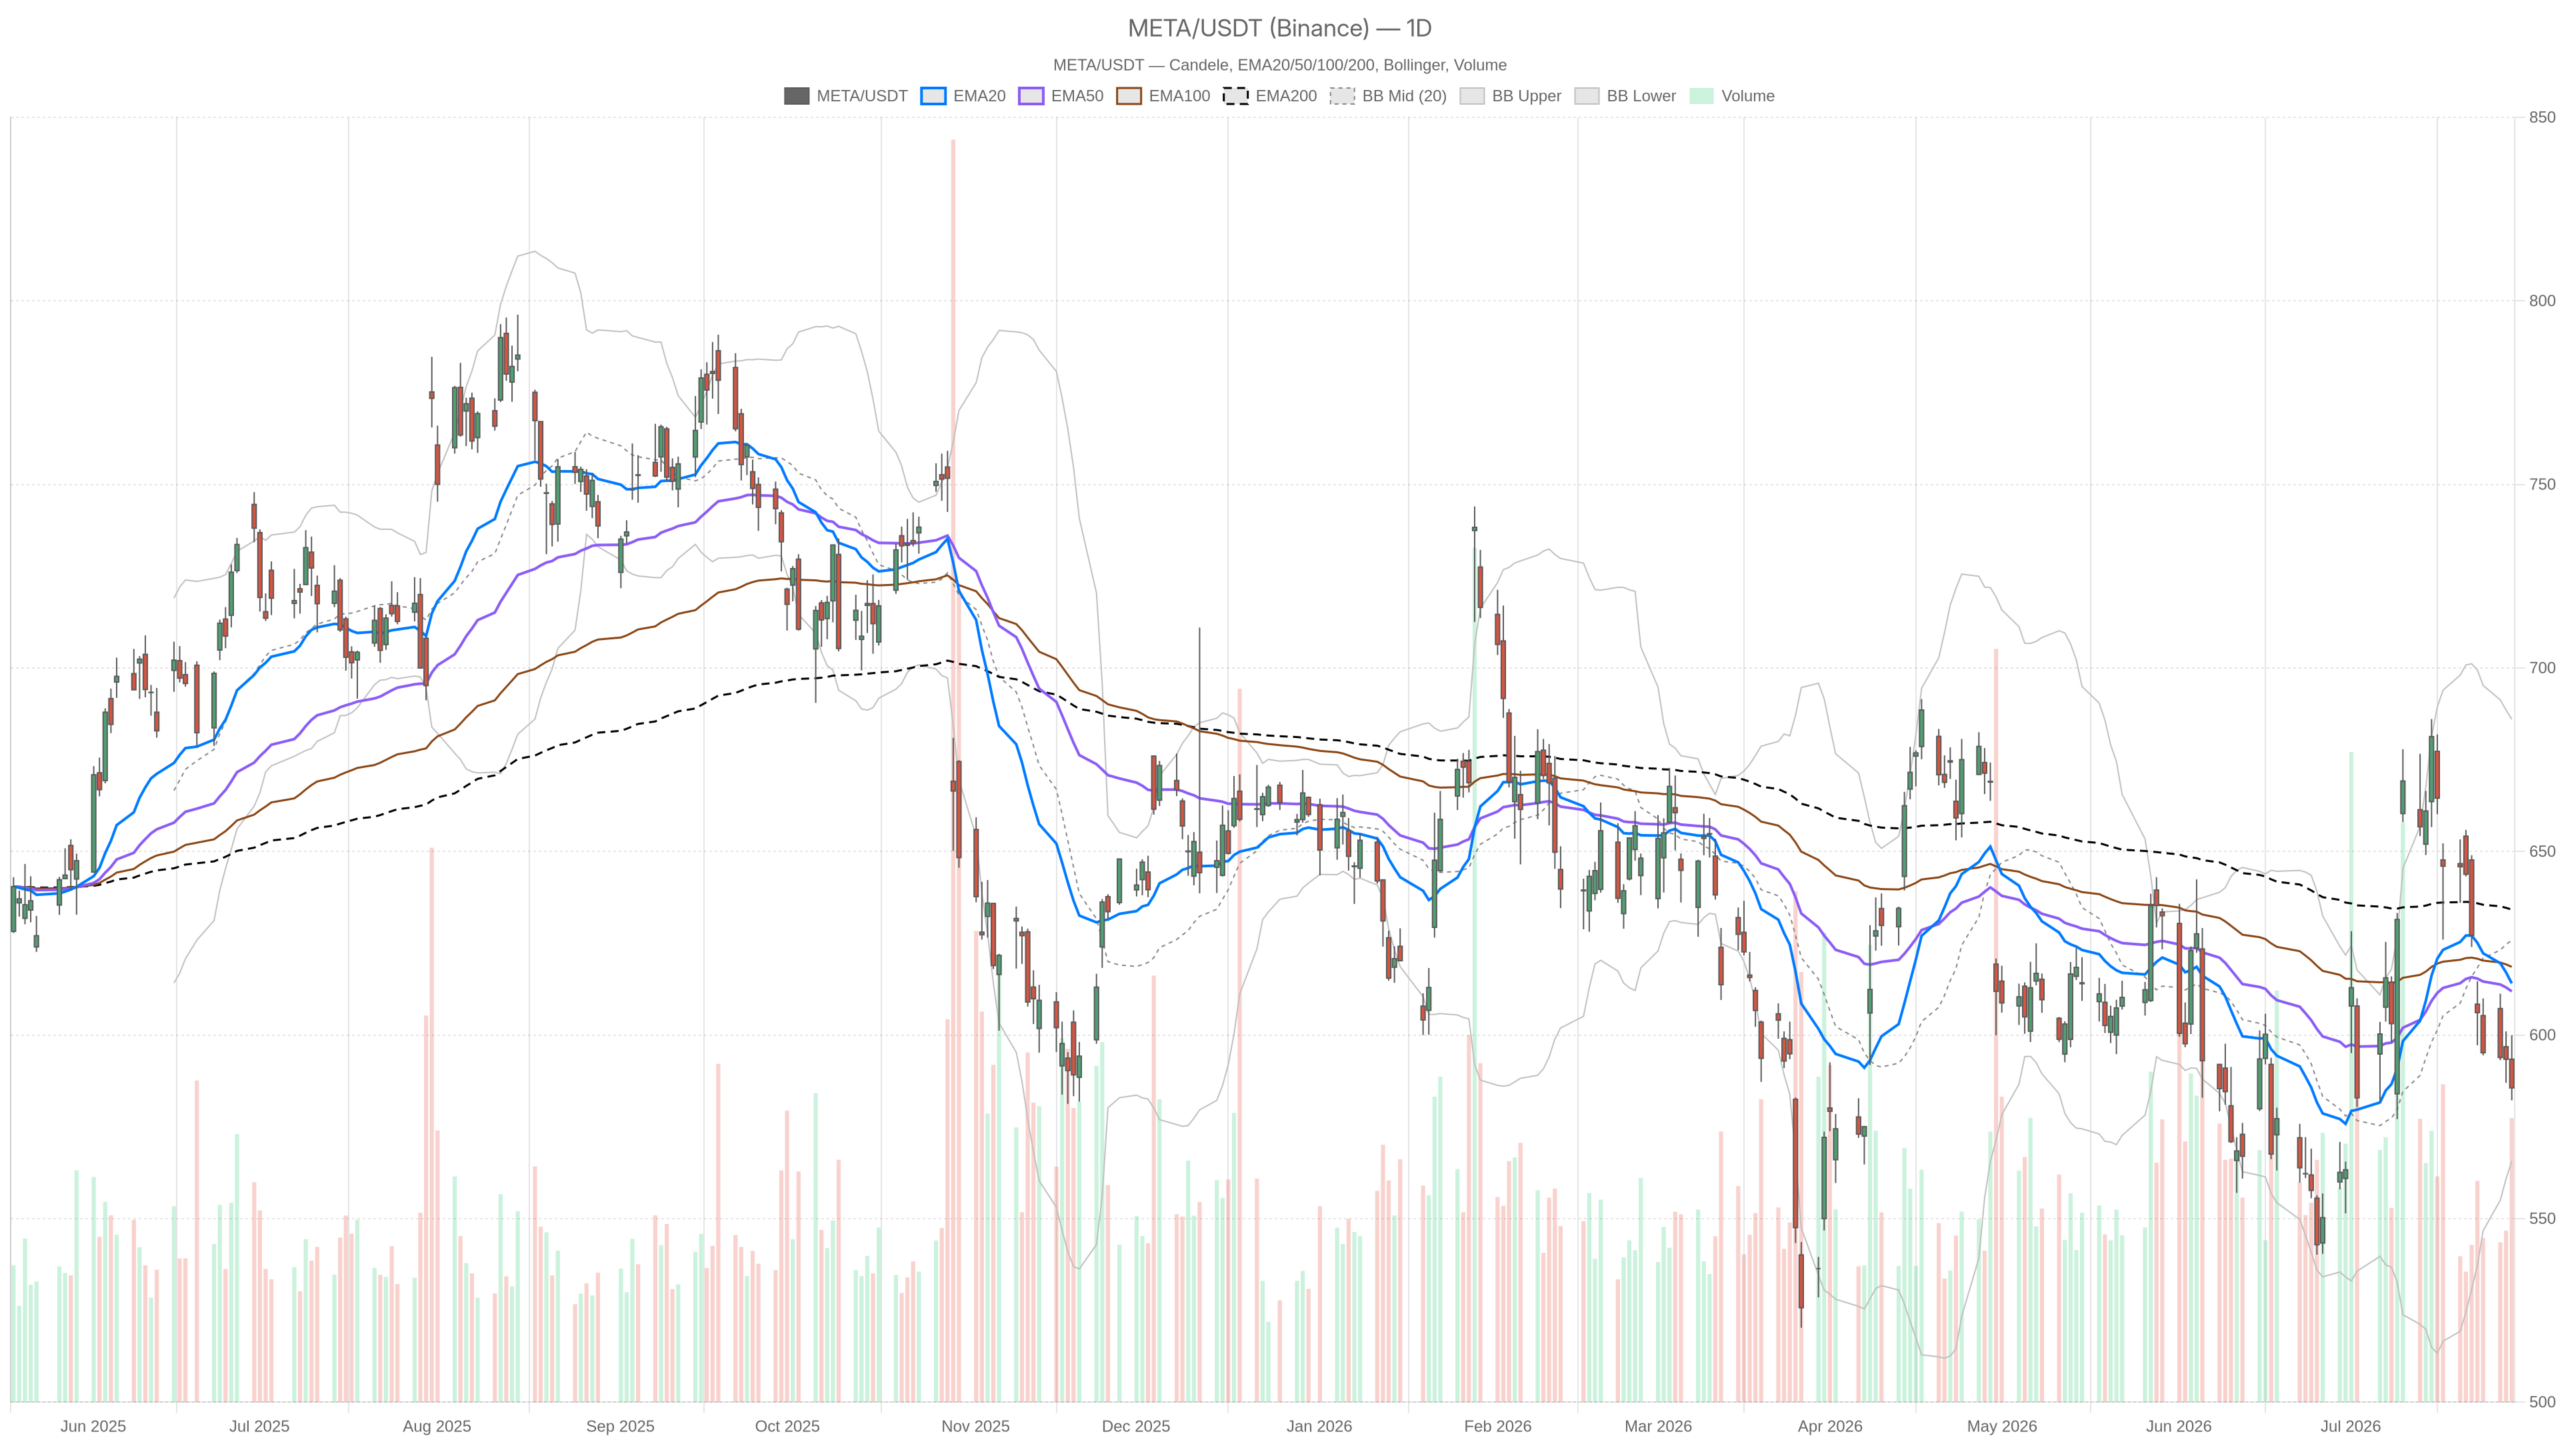
Meta stock is under clear distribution. Price closed below all three major daily moving averages — a configuration that signals persistent selling pressure rather than a routine pullback.
Moving Average Alignment Confirms Bearish Structure
Meta closed at $585.61 on July 29. This puts the stock well beneath its EMA20 at $614.08, EMA50 at $611.90, and EMA200 at $634.17. Trading below all three averages simultaneously is rare. It typically reflects institutional distribution rather than a brief consolidation phase.
MACD and RSI Signal More Room to Fall
The MACD reinforces bearish conviction. The MACD line sits at -0.67 against a signal line of 7.09. The result is a wide, negative histogram reading of -7.76. Downside momentum is well-established on the daily timeframe. Meanwhile, the RSI at 41.44 has not yet reached oversold territory. This leaves technical room for further selling before any meaningful floor develops.
Bollinger Bands Show Stretched But Not Extreme Pricing
The Bollinger Bands offer a more nuanced read. The lower band sits at $565.61 and the midline at $625.81. With price at $585.61, Meta stock is trading in the lower half of the band range. The upper band extends to $686. This positioning suggests the stock is stretched toward the downside — though not yet at an extreme compression point. The ATR of 23.31 confirms elevated volatility. Moves of $20 to $25 per session remain entirely plausible.
Daily pivot analysis places the pivot point at $589.27. Resistance sits at $596.31 and support at $578.56. Meta closed below the pivot, confirming that sellers retained control through the session.
Earnings Reality: What Triggered the Meta Stock Selloff?
A soft Q3 revenue outlook and surging AI infrastructure costs triggered the selloff. Despite beating Q2 revenue expectations, Meta’s profit declined as legal expenses and severance costs weighed on the bottom line.
Revenue Guidance Falls Short of Consensus
The company guided Q3 revenue between $61 billion and $64 billion. The midpoint of $62.5 billion fell short of the $63.24 billion analyst consensus. That shortfall — modest in percentage terms — was enough to send META down roughly 11% in after-hours trading. The market treated the guidance miss as a signal that growth may be decelerating faster than previously priced in.
AI Cost Debate Splits Market Sentiment
Soaring AI infrastructure costs are squeezing margins. This is happening even as management described AI as accelerating the core business. In response, the market is grappling with a genuine question: at what point does aggressive AI investment translate into proportionate earnings growth?
In contrast, several analysts are framing the selloff as an overreaction. CNBC commentary noted that nothing in the report changes the long-term thesis on Meta stock. Seeking Alpha assigned a Strong Buy with a price target of $815 — implying roughly 50% upside. The Motley Fool acknowledged the earnings miss but argued the dip creates a better buying opportunity. Overall, the analyst community sees value. The market, at least for now, sees risk.
Hourly Chart: Is Selling Momentum Starting to Fade?
Selling momentum is decelerating, but bears remain firmly in control. The hourly RSI is approaching oversold territory and the MACD histogram has turned slightly positive — yet price remains pinned below all key moving averages.
RSI Nears Oversold as Selling Decelerates
The hourly RSI has fallen to 32.86, approaching oversold territory. This alone does not trigger a reversal. However, it does indicate that the immediate selling wave is losing energy. The MACD on the 1H is bearish overall, with the line at -5.50 and signal at -6.20. Yet the histogram has shifted to +0.70 — a modest positive reading. This is not a bullish signal. It is a deceleration signal. The pace of decline is slowing on an intraday basis.
Stacked Moving Average Resistance Limits Recovery Potential
Price at $587 sits below the EMA20 at $594.87, EMA50 at $607.72, and EMA200 at $614.54. The structural damage on the hourly chart is extensive. Any recovery attempt faces stacked resistance through those three levels. Additionally, the hourly Bollinger lower band at $586.22 is essentially where price closed. A sustained break below $586 would confirm continued distribution. The 1H regime is formally classified as bearish.
15-Minute View: Where Are the Nearest Execution Levels for Meta Stock?
The nearest execution levels sit between $582 support and $589–$591 resistance. The 15-minute chart offers traders a granular view for managing entries and stop levels near the lows.
On the 15-minute chart, Meta touched a low of $582.22 before recovering to close at $587. The RSI at 40.71 remains subdued but is not deeply oversold. The MACD histogram at -0.64 remains slightly negative. The 15m regime is flagged as bearish. The $582–$583 zone represents an intraday support cluster, while resistance sits at $589–$591 on short-term pivots.
Bullish Scenario: What Would Reverse Meta Stock’s Downtrend?
Meta stock would need to reclaim the daily pivot at $589.27 with conviction, extend the hourly MACD’s positive histogram shift, and see broader sentiment around AI spending stabilize.
A recovery case rests on several conditions. First, price must reclaim the daily pivot at $589.27 and sustain trade above that level. Second, the hourly MACD histogram would need to extend its positive shift. That would suggest genuine momentum recovery rather than a brief pause in selling. Third, broader market sentiment around AI spending must stabilize — ideally through forward guidance reassurance or a pullback in cost-overrun narratives.
On the daily chart, a move back above the EMA20 at $614 would be the first meaningful sign that bulls are regaining structural control. The lower Bollinger Band at $565.61 represents the deeper technical floor if the selloff accelerates further.
Bearish Scenario: How Low Could Meta Stock Go?
If Meta stock fails to hold the $578–$582 support zone, the next meaningful floor sits at the daily Bollinger lower band of $565.61. Below that, price would enter uncharted near-term territory.
The bearish case is straightforward given current structure. Failure to hold $578–$582 would expose the Bollinger lower band at $565.61. Below that level, price action enters genuinely uncharted near-term territory. The MACD divergence on the daily remains wide. RSI has not yet hit oversold levels that historically attract dip buyers. Continued margin compression from AI costs — combined with any further downward revision to guidance — could extend selling pressure well into August.
Notably, the $586–$590 zone now acts as a gatekeeping cluster. It spans the hourly Bollinger lower band, the daily pivot, and the 1H resistance. Failure to break through this zone would leave META trapped in a distribution range with limited immediate upside catalyst.
Positioning Meta Stock During Elevated Volatility
Meta stock is technically damaged across all timeframes, with the daily chart defining the primary bearish bias. Position sizing must account for the ATR of 23.31, which makes this a high-volatility environment.
Overall, Meta stock remains in a technically damaged state across all three timeframes. The daily chart defines the primary bearish bias. The hourly chart offers only early, tentative signs of deceleration. The 15-minute chart confirms the stock is near short-term support but has yet to produce a credible reversal structure.
The analyst community is broadly constructive on the long-term case. However, near-term price action is governed by uncertainty around AI cost absorption and the degree to which the Q3 guidance miss represents a temporary reset or something more structural. Until price reclaims key moving averages and MACD momentum turns positive on the daily, the risk bias remains to the downside.
FAQ
Why did Meta stock drop after earnings?
Meta stock fell roughly 11% in after-hours trading because Q3 revenue guidance of $62.5 billion at the midpoint came in below the $63.24 billion analyst consensus. Additionally, rising AI infrastructure costs and legal expenses weighed on profitability.
Is Meta stock a buy after the dip?
Several analysts view the selloff as a buying opportunity. Seeking Alpha maintains a Strong Buy rating with an $815 price target. However, the daily chart shows persistent distribution, and RSI has not yet reached oversold levels. The technical picture suggests caution in the near term.
What are the key support levels for Meta stock?
The immediate support zone sits between $578 and $582. Below that, the daily Bollinger lower band at $565.61 represents the next meaningful technical floor. A break beneath that level would place Meta stock in uncharted near-term territory.
What needs to happen for META to recover?
Price must reclaim the daily pivot at $589.27 with conviction and then recover above the EMA20 at $614. The hourly MACD histogram must extend its positive shift, and broader sentiment around AI spending needs to stabilize.
Disclaimer: This article is for informational purposes only and does not constitute financial advice, an investment recommendation, or a solicitation to buy or sell any financial instrument or cryptocurrency. The analysis provided is not indicative of future results. Investing in crypto assets and financial markets carries a high risk of capital loss. Always do your own research (DYOR) and consult a qualified financial advisor before making any decision.
Article produced with the assistance of artificial intelligence and reviewed by the editorial team.
