




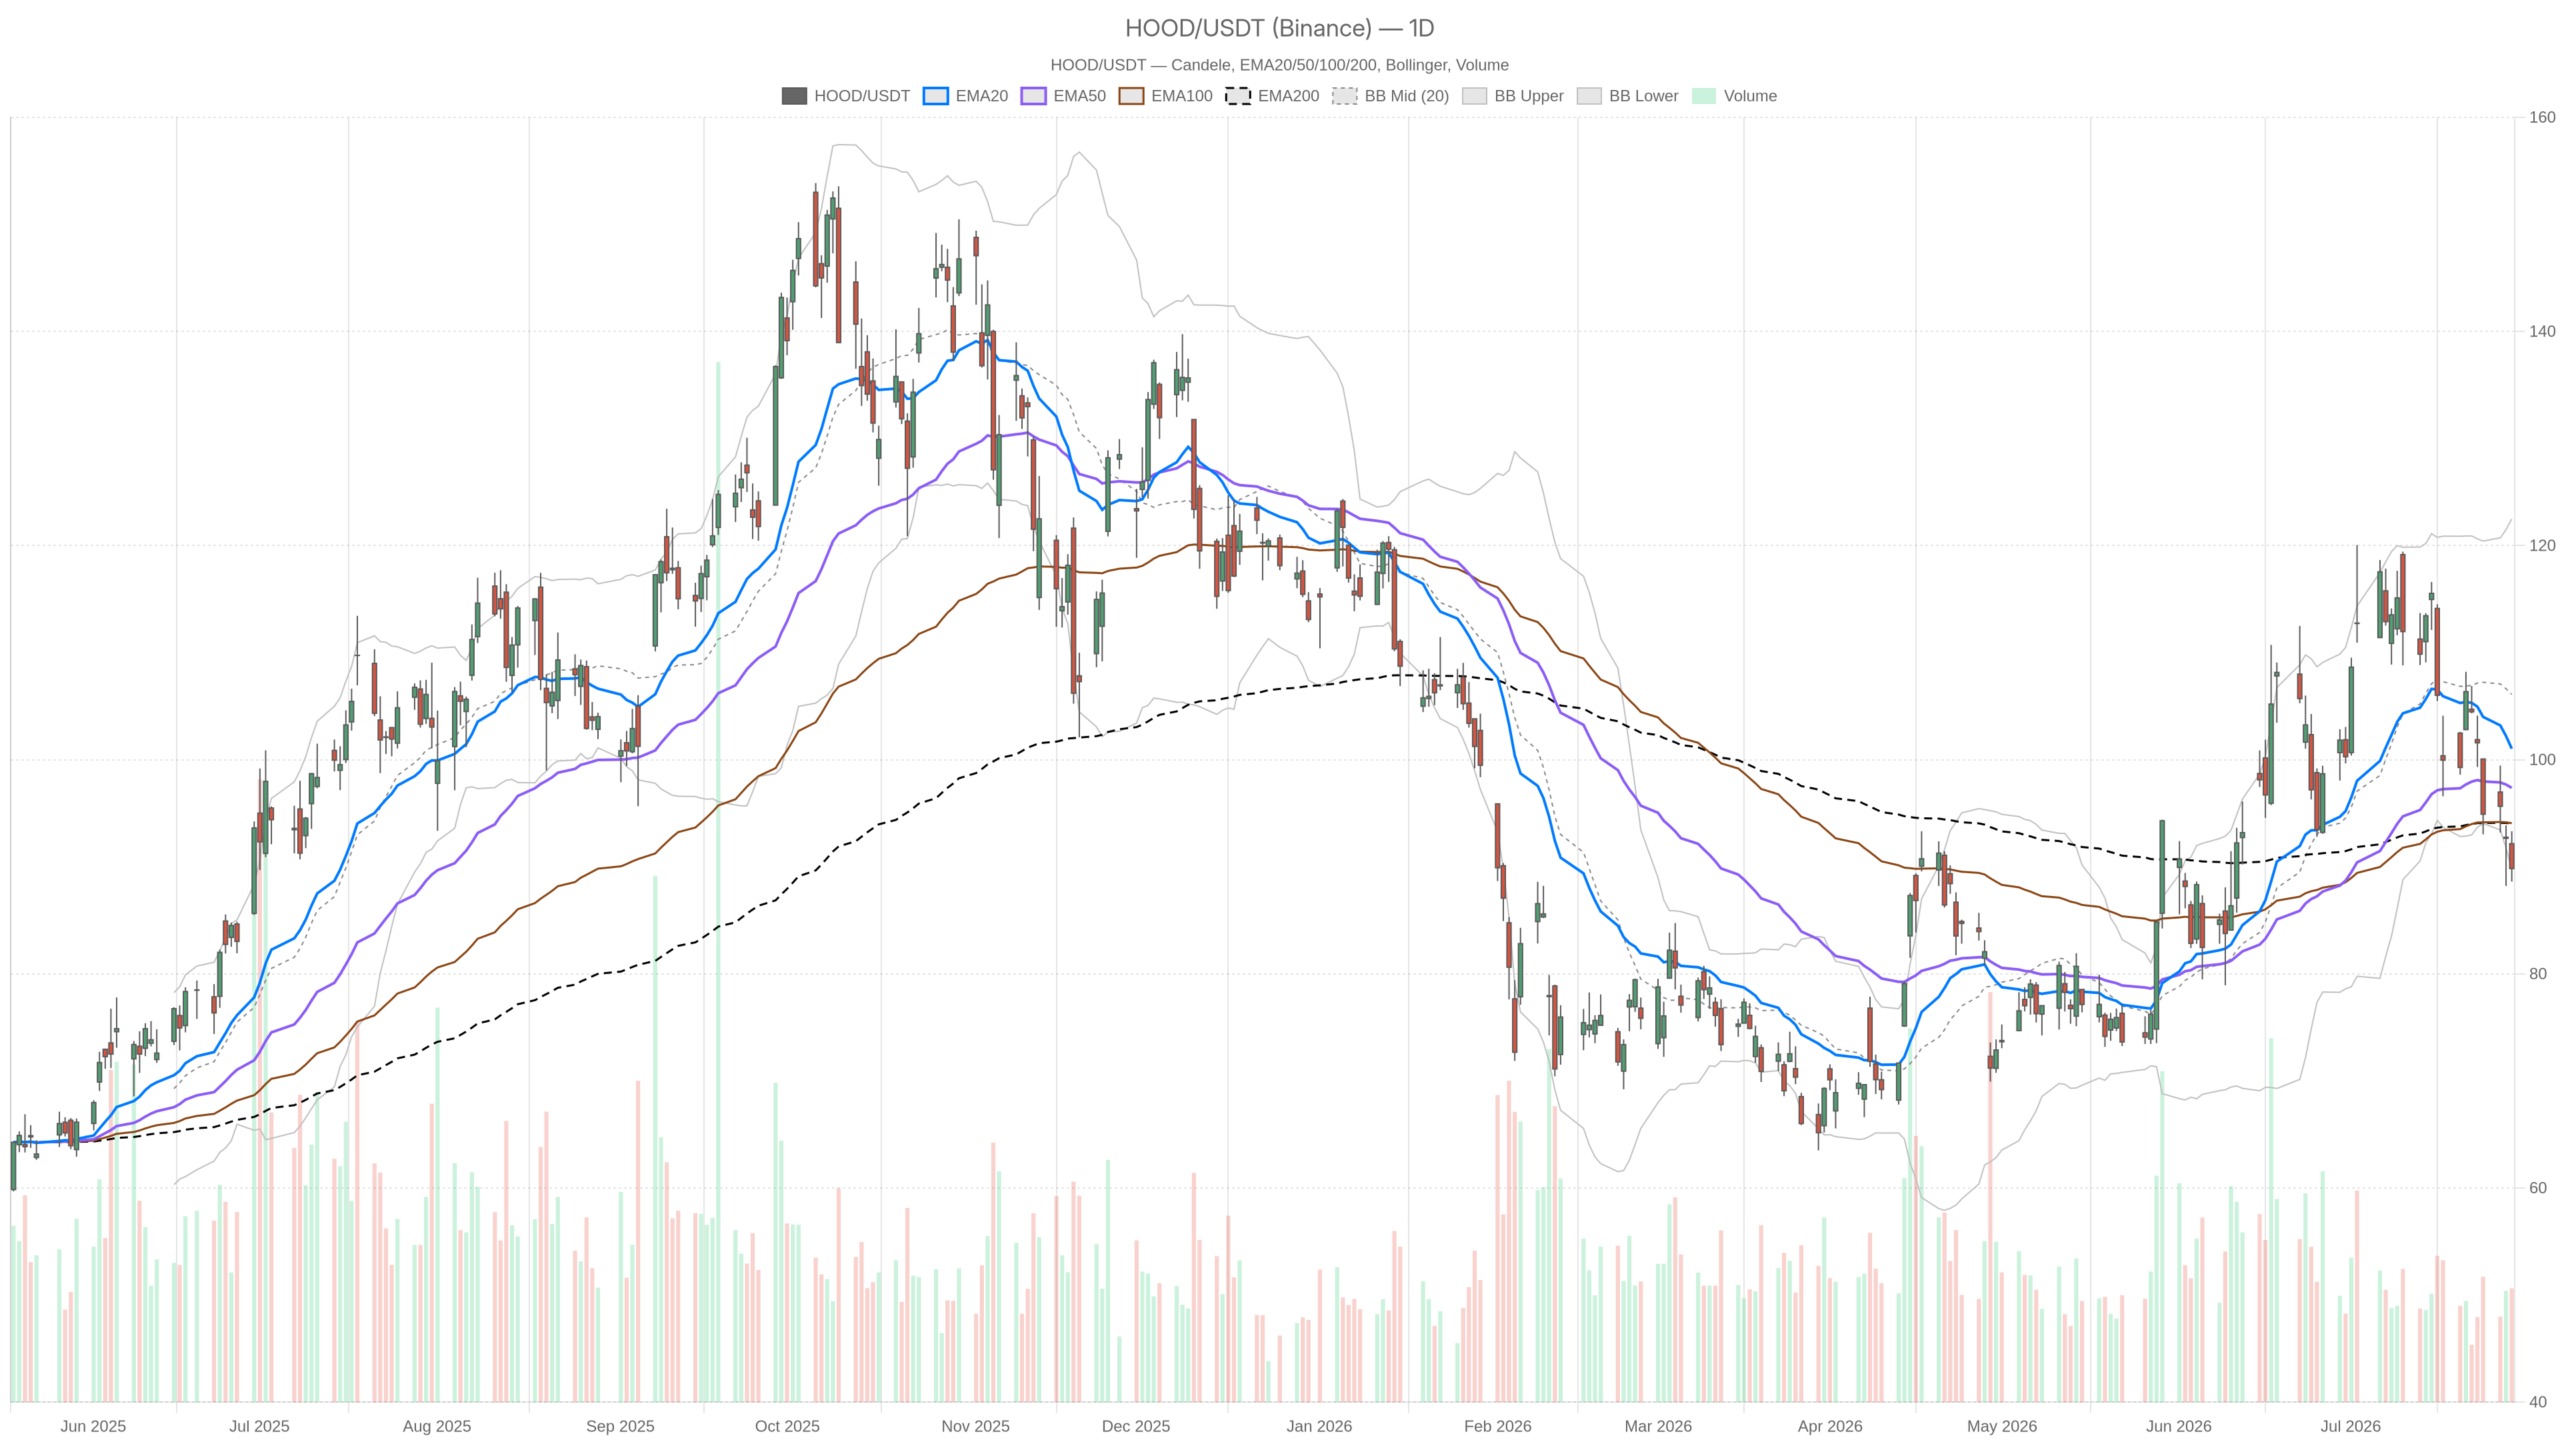
Robinhood Markets, Inc. stock closed at $89.84 on July 29, down from a $92.16 open. It now sits below every key daily moving average. The technical picture is bearish — even as the company posted record Q2 revenue of $1.31 billion, a 32% year-on-year jump.
Summary
Key takeaways
- HOOD closed at $89.84, below all three daily EMAs — the 20, 50, and 200
- Daily RSI at 38.47 and MACD histogram at -2.81 confirm strong bearish momentum
- Record Q2 revenue of $1.31 billion (+32% YoY) failed to prevent the post-earnings selloff
- The daily Bollinger lower band at $89.74 serves as the critical line in the sand
- A close below $89.74 opens the path toward $87.87 pivot support
Daily Bias: Bearish Momentum Dominates HOOD’s Price Structure
The daily bias for Robinhood Markets, Inc. stock is firmly bearish. Price trades below all three key EMAs while the MACD histogram sits deep in negative territory at -2.81.
Price is below the EMA20 at $101.03, the EMA50 at $97.37, and the EMA200 at $94.05. This stacked bearish alignment signals sustained distribution pressure, not a brief pullback. Meanwhile, the MACD line at -1.36 sits below the signal line at 1.46. That produces a histogram reading of -2.81 — one of the more decisive momentum divergences on the daily chart. Sellers are firmly in control of the medium-term trend.
Furthermore, the Bollinger Bands reinforce this reading. The midline sits at $106.11, well above current price. The lower band is at $89.74 — barely beneath Tuesday’s close of $89.84. HOOD is pinned against the lower band. This zone historically implies either a bounce or an accelerating breakdown. Momentum currently favors the latter unless a catalyst intervenes.
Notably, the daily ATR of $6.54 reflects wide daily swings and elevated realized volatility. Traders should treat any intraday move as potentially noisy. Directional conviction is premature until price reclaims key levels.
Hourly View Confirms the Pressure, With a Subtle Nuance
The hourly chart confirms the bearish regime. However, a marginally positive MACD histogram hints at slowing downside momentum near support.
On the 1H chart, price closed at $89.42. The EMA20 at $92.30, EMA50 at $96.65, and EMA200 at $100.89 all sit well above current price. The hourly RSI stands at 34.99, approaching oversold territory. Still, it has not yet triggered a classic mean-reversion signal.
However, there is one small nuance worth noting. The hourly MACD histogram printed at +0.11 — a marginally positive reading against a negative MACD line of -2.23. This suggests a very early, tentative loss of downside momentum at the hourly level. It does not constitute a reversal signal. Nevertheless, it may indicate the immediate selling pace is slowing near support.
Meanwhile, the 1H Bollinger lower band sits at $88.04. That level aligns closely with the 1H pivot support of $88.32. Together they create a confluence zone that could act as a short-term floor. Any intraday bounce from that area would need to clear the 1H pivot resistance at $90.83 to become meaningful.
Execution Context: What the 15-Minute Chart Shows
The 15-minute chart reflects short-term consolidation near the lows rather than a recovery attempt.
Price closed at $89.42. The EMA20 at $90.57 and EMA50 at $91.44 act as immediate overhead resistance. The 15m RSI of 42.67 sits in neutral territory, offering no strong directional conviction at this granularity. The MACD histogram at +0.02 is effectively flat.
Overall, the 15m picture reflects a market in short-term equilibrium near the lows. This is consistent with consolidation rather than recovery. The 15m ATR of $1.11 points to relatively contained intrabar moves. It reduces the risk of a sudden spike but also limits the probability of a sharp technical bounce without fresh news.
Fundamental Backdrop: Why Robinhood Stock Sold Off on Record Earnings
Robinhood’s Q2 2026 results were objectively strong, yet Robinhood Markets, Inc. stock sold off — a divergence that warrants attention.
The company reported record revenue of $1.3 billion alongside $22 billion in net deposits. The newly launched Trump accounts attracted 77 million sign-ups and over $1.5 billion in contributions. Robinhood also lowered its 2026 adjusted operating expense outlook. The new range of $2.675 billion to $2.775 billion signals tightening cost discipline.
Meanwhile, the company targets a Robinhood Social rollout by quarter-end. It also continues to expand into crypto and AI-driven trading products. These secular tailwinds support a fundamentally constructive long-term narrative.
Yet the stock sold off. This kind of post-earnings weakness typically reflects one of two dynamics. Either expectations were already priced in at higher levels. Or institutional participants are using the liquidity event to reduce exposure. HOOD had been trading significantly above current levels, so the latter interpretation carries weight.
Bullish Scenario: What HOOD Needs to Reverse
A credible bullish case exists for Robinhood Markets, Inc. stock, but it requires price action confirmation before gaining traction.
The lower Bollinger Band on the daily chart at $89.74 coincides closely with the current close of $89.84. If HOOD can hold this level and form a daily close back above the pivot point at $90.59, it would mark the first constructive sign of stabilization. A subsequent reclaim of $92.57 — the daily R1 resistance — would further validate potential base-building.
In that scenario, the fundamental story would provide the catalyst. Record revenues, accelerating deposit growth, and secular tailwinds from millennial and Gen-Z adoption all support a longer-term re-rating higher. The daily RSI at 38.47 is not yet at extreme oversold levels. However, it is low enough that a relief rally would surprise no one technically.
Bearish Scenario: The Risks of a Lower Low
The bearish case is currently better supported by price structure than the bullish alternative.
A daily close below the Bollinger lower band at $89.74 would be technically significant. It would suggest that selling pressure is strong enough to push price past a key statistical boundary. The daily pivot support of $87.87 would then become the next meaningful level to watch. Below that, little structural support is visible in the current data.
In contrast, the bearish case benefits from clear technical alignment. Every daily EMA sits above current price. The MACD histogram at -2.81 is deeply negative. The hourly regime is explicitly flagged as bearish. Unless buyers mount a decisive defense at current lows, the path of least resistance remains lower in the near term.
Positioning Into Uncertainty
Robinhood Markets, Inc. stock presents a genuine dilemma — operationally strong, yet technically weak.
The business is growing at pace with record revenues and expanding product lines. However, technical conditions across the daily and hourly timeframes remain clearly negative. The daily ATR of $6.54 means intraday swings will stay wide and unpredictable. Any positioning near current levels demands respect for that volatility.
Therefore, the $89.74 lower Bollinger Band is the line in the sand. A hold opens the door for a technical recovery. A break invites deeper downside. Until price reclaims at least the $92.57 daily resistance, the bias stays cautious.
FAQ
Why did Robinhood stock drop despite record earnings?
Strong post-earnings selloffs often indicate that positive results were already priced in. Given HOOD had been trading well above current levels, institutional investors likely used the liquidity event to reduce exposure. The gap between strong fundamentals and weak price action suggests distribution, not accumulation.
What is the most important support level for HOOD stock?
The daily Bollinger lower band at $89.74 is the critical near-term support. A close below this level would open the path toward the daily pivot support at $87.87. On the hourly chart, the confluence of the lower Bollinger band at $88.04 and pivot support at $88.32 provides an additional floor.
What would signal a bullish reversal for Robinhood Markets, Inc. stock?
A daily close back above the pivot point at $90.59 would be the first constructive sign. A subsequent reclaim of the daily R1 resistance at $92.57 would further validate a base-building phase. Price would also need to recover above the EMA200 at $94.05 to challenge the broader bearish structure.
Is the RSI oversold enough for a bounce?
The daily RSI at 38.47 is low but not at the extreme oversold levels — below 30 — that historically precede sharp mean-reversion moves. The hourly RSI at 34.99 is closer to oversold territory. While a relief rally is possible, neither reading yet provides a high-conviction mean-reversion signal.
Disclaimer: This article is for informational purposes only and does not constitute financial advice, an investment recommendation, or a solicitation to buy or sell any financial instrument or cryptocurrency. The analysis provided is not indicative of future results. Investing in crypto assets and financial markets carries a high risk of capital loss. Always do your own research (DYOR) and consult a qualified financial advisor before making any decision.
Article produced with the assistance of artificial intelligence and reviewed by the editorial team.
