




Uber Technologies, Inc. stock fell to 67.25, down from an open of 68.80, after a mixed Q2 report. Bookings and profit beat expectations, but weak Q3 guidance drove the sell-off. Price action, momentum, and trend structure now all point bearishly across multiple timeframes.
Summary
Key takeaways
- Uber Technologies, Inc. stock closed at 67.25 on the daily session, down from an open of 68.80.
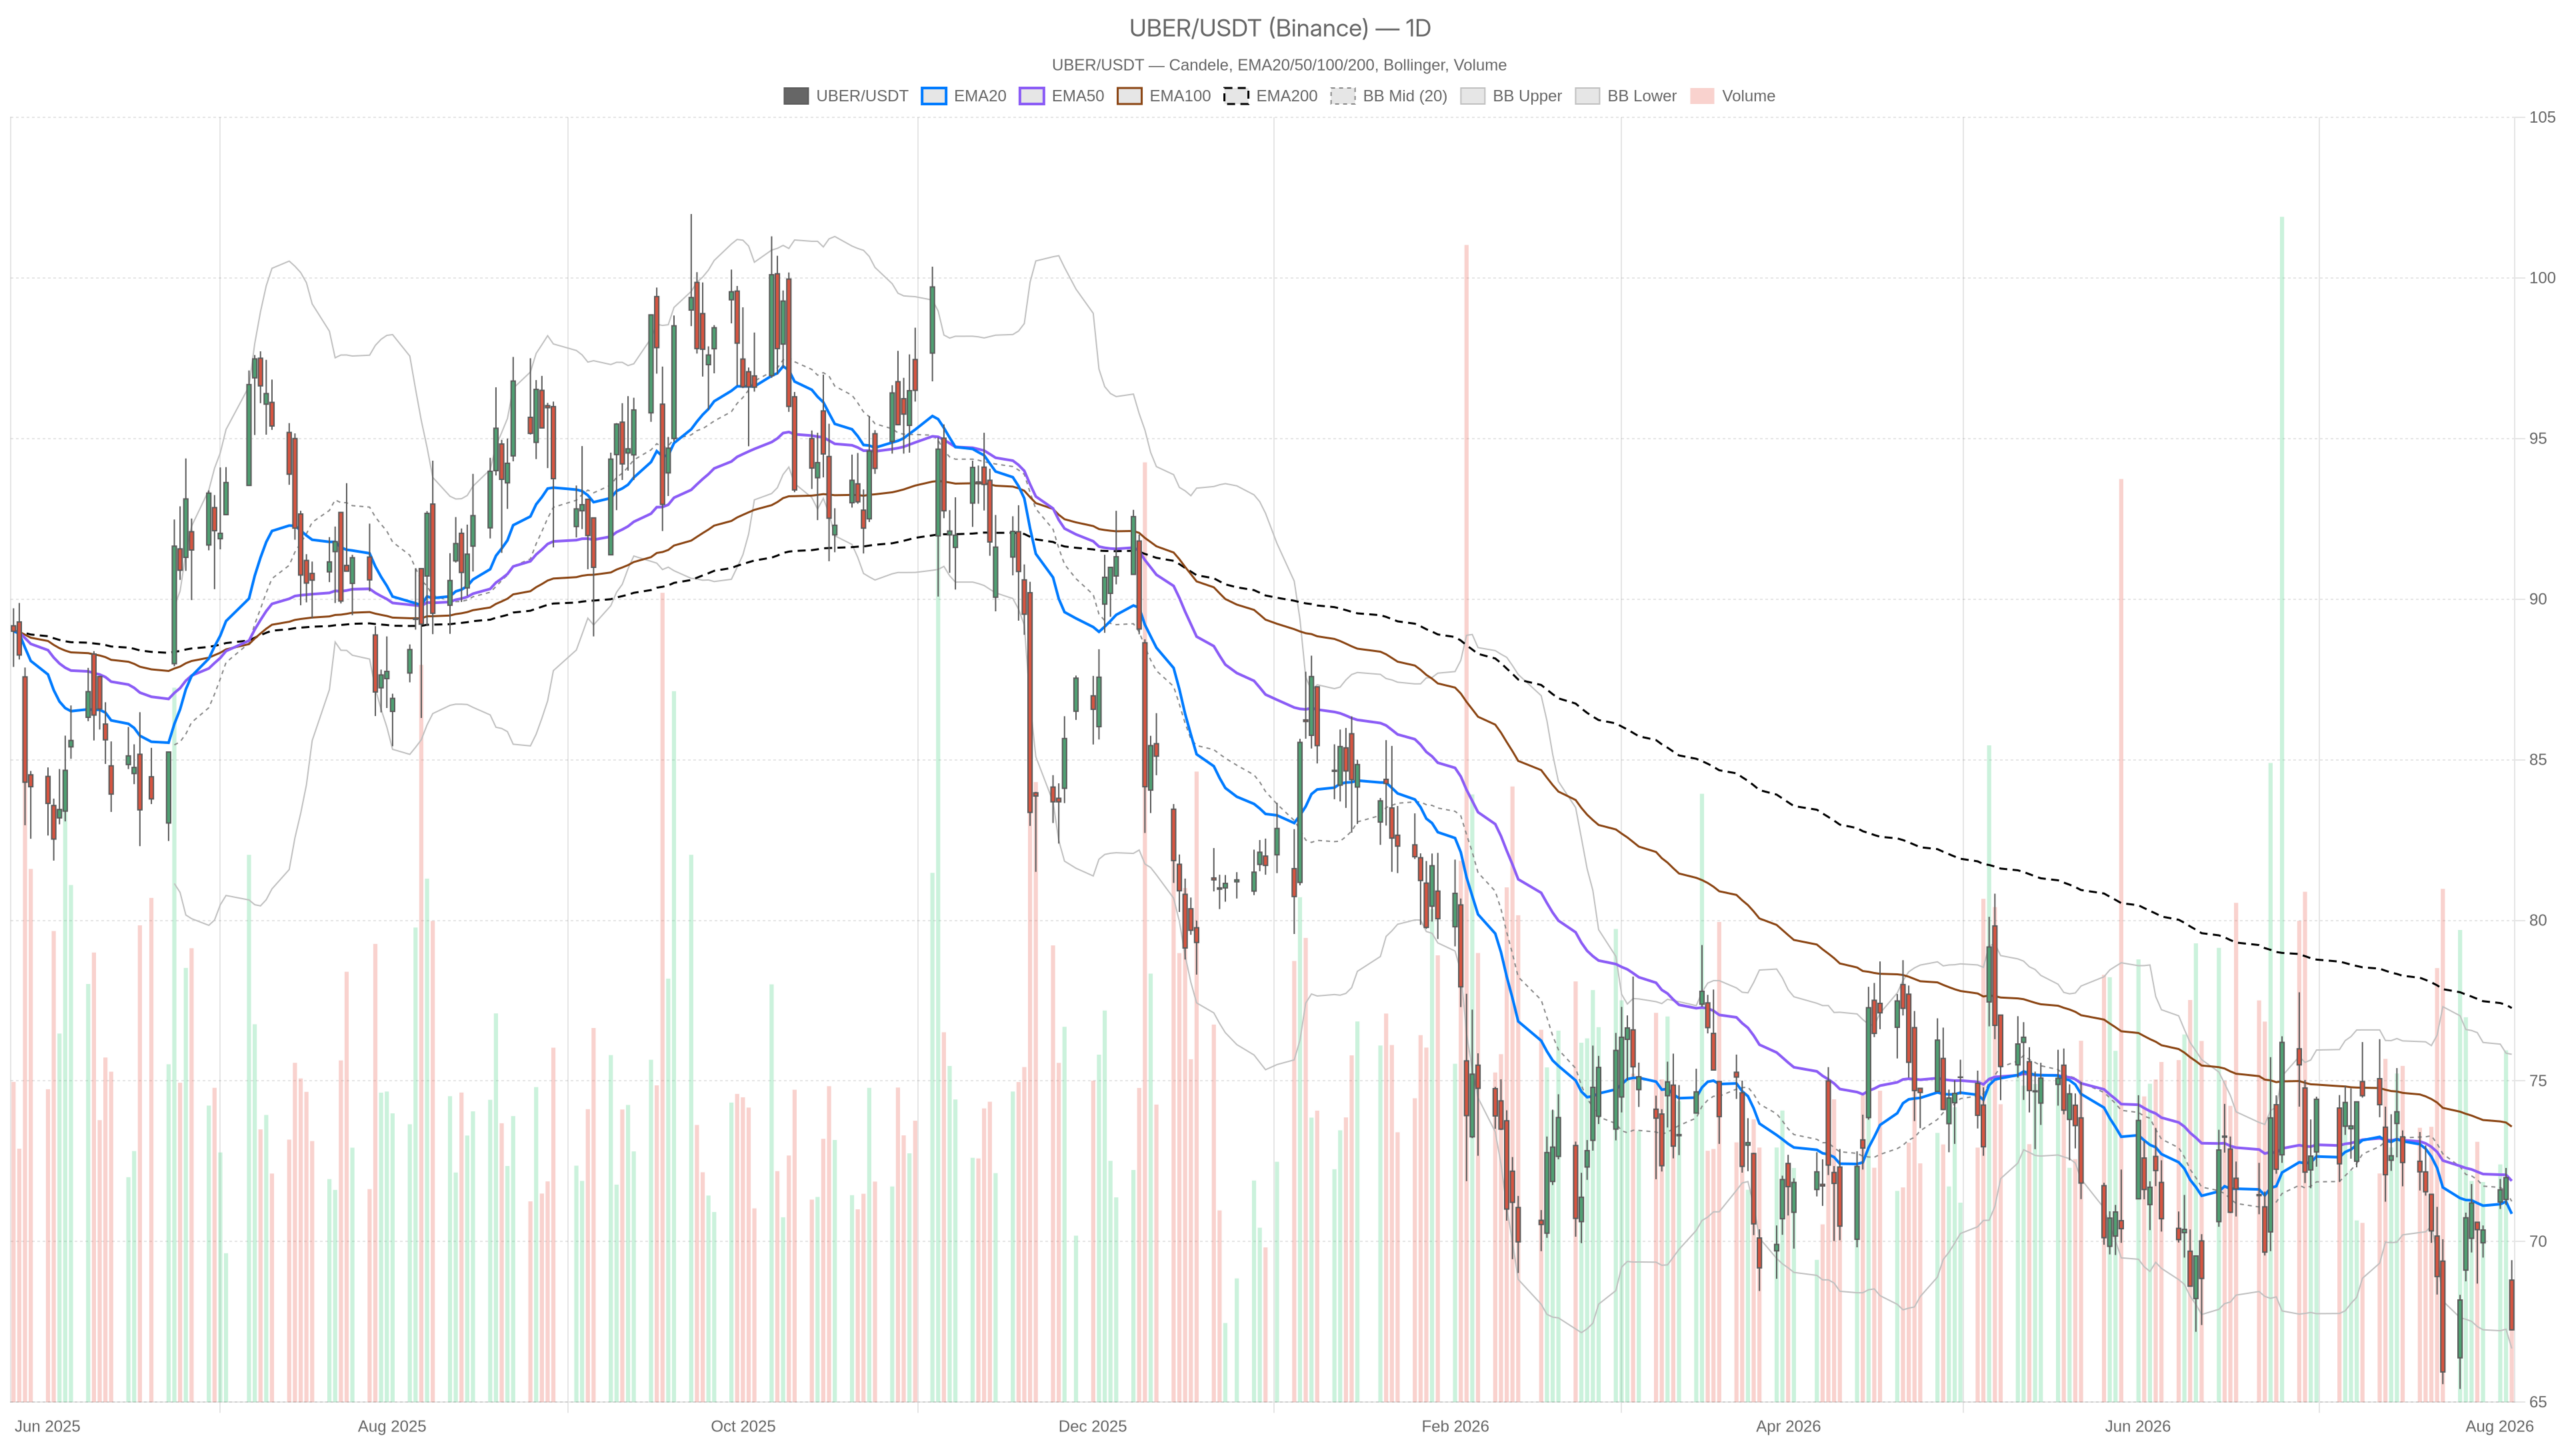
- The daily trend is bearish with price trading below the EMA20 at 70.86, EMA50 at 71.89, and EMA200 at 77.27.
- Daily RSI14 at 39.82 signals weakness but not yet oversold, leaving room for further downside.
- Hourly RSI14 has dropped to 26.14 — deep oversold territory that raises odds of a short-term bounce.
- The bearish scenario dominates as long as price stays below the EMA20/EMA50 cluster at 70.86–71.89.
- A break below daily S1 support at 66.52 would open the door toward the lower Bollinger Band at 66.67.
Daily Trend: A Clean Bearish Regime for Uber Technologies, Inc. Stock
The daily chart for Uber Technologies, Inc. stock confirms a clean bearish regime. Price trades below all three major moving averages — the EMA20 at 70.86, the EMA50 at 71.89, and the EMA200 at 77.27. That stacked, descending alignment is a textbook bearish structure, and the system’s regime classification confirms it directly: bearish.
Momentum and Volatility Context
The RSI14 sits at 39.82, which is weak but not yet in oversold territory on the daily chart. In practice, that means sellers still have room to push before the daily momentum reading becomes stretched. The MACD reinforces the same message. The line at -0.76 sits below the signal at -0.65, producing a histogram of -0.11. That negative histogram shows downside momentum is still building rather than fading.
Volatility is also worth flagging. The ATR14 stands at 2.38, a meaningfully elevated reading that reflects the size of the earnings-driven repricing. Meanwhile, price is hugging the lower Bollinger Band. The lower boundary sits at 66.67, versus a midline of 71.25 and an upper band of 75.83.
That positioning tells us the stock is stretched to the downside relative to its own recent range, though not yet outside it. On the pivot framework, price trades below the daily pivot point of 67.97 and near S1 support at 66.52. Bears want a break of that level for continuation. Bulls need a reclaim of the pivot to argue for stabilization.
1H Timeframe: Confirmation, Not Contradiction
The hourly chart sharpens the bearish case for Uber Technologies, Inc. stock rather than offering relief. Price sits below all three hourly moving averages, mirroring the daily structure with full bearish alignment.
The EMA20, EMA50, and EMA200 on the 1H are at 70.30, 70.35, and 71.27 respectively — all above the current price of 67.25. However, momentum on the 1H has become notably more stretched than on the daily. RSI14 has dropped to 26.14, deep oversold territory. This is where the first real divergence between timeframes emerges: the daily RSI is merely weak, while the hourly RSI signals near-term exhaustion. This hourly oversold condition raises the odds of a short-term bounce attempt, even within a broader downtrend.
Accelerating Downside Pressure
The MACD on the 1H tells a story of accelerating downside. The line is at -0.35, below a signal of 0.18. This produces a histogram of -0.52 — one of the most negative readings across all three timeframes. Notably, price has also pushed through the lower Bollinger Band.
The close at 67.25 sits below the lower boundary of 67.93. Trading outside the lower band on an hourly basis signals strong, possibly overextended, downside momentum. Therefore, while the 1H trend confirms the daily bearish bias, its momentum extremes tell another story. The move down has been sharp enough that consolidation or a relief bounce would not be surprising before further decline.
15-Minute Execution Context
The 15-minute chart for Uber Technologies, Inc. stock shows exhaustion at the margin. Extreme oversold readings on this timeframe typically precede at least a pause in selling pressure.
RSI14 has fallen to 18.81, an extreme oversold reading. The MACD line at -1.12 versus a signal of -0.82 still shows bearish momentum, with a histogram of -0.31. However, the pace of deterioration on this timeframe is less violent than the acceleration seen on the 1H.
Price hovers right around the 15m pivot point of 67.32. R1 sits at 67.40 and S1 at 67.20 — a very tight range reflecting short-term indecision after the initial drop. A break below 67.20 would likely extend the intraday slide. A reclaim above 67.40 could set up a short-term bounce toward the hourly resistance zone near 67.93.
Bullish Scenario: What Would Change the Narrative
For a bullish reversal to gain traction, Uber Technologies, Inc. stock must reclaim key technical levels. The daily pivot at 67.97 and the EMA20 at 70.86 are the first hurdles.
The stock would also need to move back above the daily EMA20 at 70.86. A recovery of that magnitude would require the hourly RSI to unwind from its current oversold extreme without triggering fresh selling. The MACD histograms on both the 1H and daily charts would need to start narrowing toward zero.
On the fundamental side, any signs that the robotaxi investment — described by the company as exceeding $10 billion over the coming years — is translating into tangible growth could help shift sentiment. Reassurance around the continuity of the Waymo partnership would also support the case. Until those technical levels are reclaimed, however, any upside move should be treated as a bounce within a downtrend rather than a reversal.
Bearish Scenario: What Would Invalidate the Bounce Case
The bearish scenario remains dominant for Uber Technologies, Inc. stock as long as price stays below the EMA20 and EMA50 cluster at 70.86–71.89. A break of daily S1 support would reinforce the downside.
A break of the daily S1 support at 66.52 would open the door toward the lower Bollinger Band at 66.67 and beyond. This is especially likely if the daily MACD histogram continues to widen in negative territory.
On the news side, the market has already shown its hand. Shares fell despite Uber beating on bookings and profit, precisely because third-quarter guidance trailed expectations. That reaction suggests investors are more focused on forward guidance than on the current quarter’s beat. Any further disappointment — or renewed uncertainty around the Waymo alliance — would likely reinforce the downside.
Closing Note: Positioning Amid Elevated Volatility
The weight of evidence across timeframes points to a bearish bias for Uber Technologies, Inc. stock, with the 15-minute chart showing early signs of short-term exhaustion that could produce a technical bounce.
At the same time, elevated ATR readings across timeframes underline that volatility remains high following the earnings reaction. Price swings in either direction could be sharp. Given the conflicting signals between a stretched hourly RSI and a still-building daily downtrend, positioning here calls for caution. Traders should wait until price reclaims key levels like the daily pivot or breaks decisively through nearby support before committing in either direction.
FAQ
What is the current price of Uber Technologies, Inc. stock?
Uber Technologies, Inc. stock closed the daily session at 67.25, down from an open of 68.80, following a mixed Q2 earnings report.
What are the key support levels to watch for Uber stock?
The nearest support is the daily S1 at 66.52, followed by the lower Bollinger Band at 66.67. A break below these levels would open the door for further downside.
Is Uber Technologies, Inc. stock oversold right now?
On the daily timeframe, RSI14 at 39.82 is weak but not oversold. However, the hourly RSI14 at 26.14 and the 15-minute RSI14 at 18.81 both signal oversold conditions, raising the odds of a short-term bounce.
What would reverse the bearish trend in Uber stock?
A reclaim of the daily pivot at 67.97 and a move back above the daily EMA20 at 70.86 would be the first steps toward reversing the bearish trend. Until then, any upside should be treated as a bounce within a downtrend.
Disclaimer: This article is for informational purposes only and does not constitute financial advice, an investment recommendation, or a solicitation to buy or sell any financial instrument or cryptocurrency. The analysis provided is not indicative of future results. Investing in crypto assets and financial markets carries a high risk of capital loss. Always do your own research (DYOR) and consult a qualified financial advisor before making any decision.
Article produced with the assistance of artificial intelligence and reviewed by the editorial team.
