




Uber stock is trading in deliberate balance. The $14.8 billion all-stock deal to acquire Delivery Hero — announced July 16 — dominates the narrative, yet price action signals hesitation, not conviction.
Summary
Key takeaways
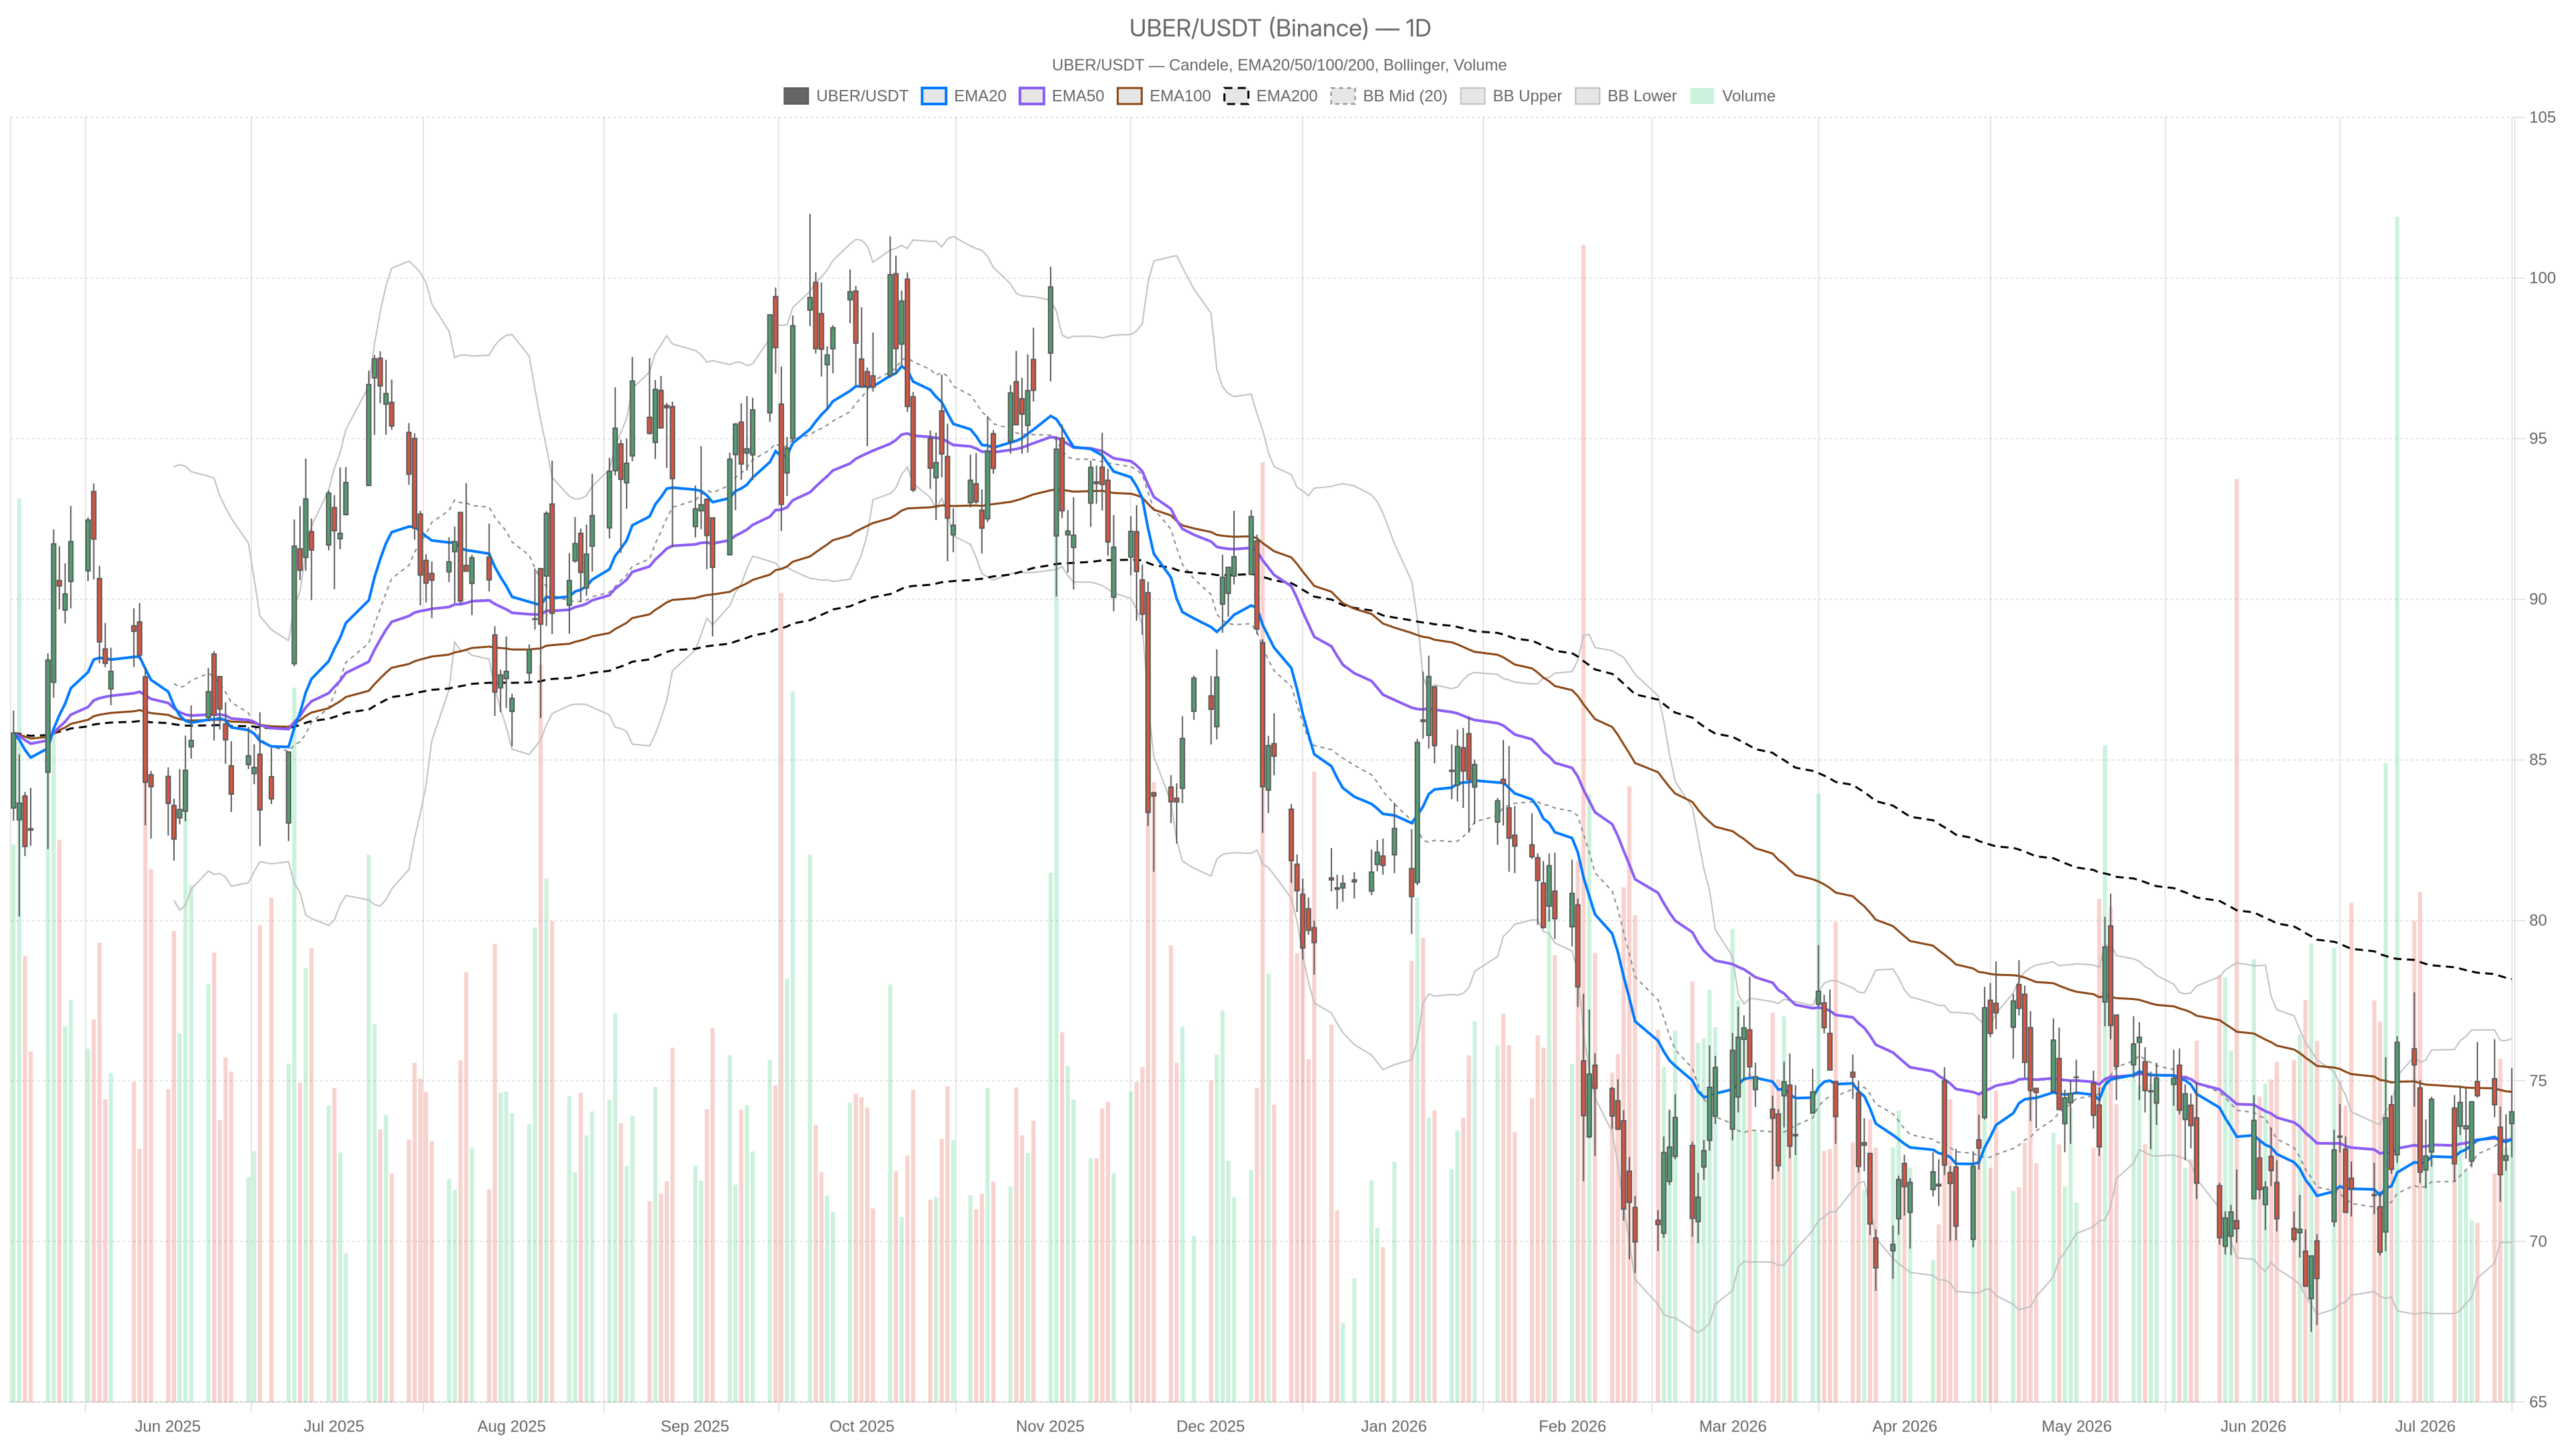
- Uber stock closed at $74.04, barely above virtually identical EMA20 ($73.19) and EMA50 ($73.18)
- The $14.8 billion all-stock Delivery Hero acquisition would expand Uber’s platform to 99 markets
- Daily RSI at 52.72 and flat MACD confirm a neutral technical regime with no directional bias
- The EMA200 at $78.17 remains a significant overhead obstacle, roughly $4 above the current price
- Key range: daily pivot S1 at $72.64 to R1 at $75.42, with Bollinger Bands spanning $69.98–$76.32
Uber Stock Technical Picture: Neutral Regime, Quiet Momentum
Uber stock’s technical picture is neutral across multiple timeframes, with flat momentum and no clear directional bias. The daily regime classification and supporting indicators both confirm this reading. Daily RSI at 52.72 sits comfortably in the middle ground — neither overbought nor oversold. It reflects a stock catching its breath after prior range-bound activity, not one building toward a decisive breakout.
Momentum Indicators Signal Indecision
Meanwhile, the daily MACD line and signal are both printing at 0.32, producing a histogram of exactly zero. That is a near-textbook flatline. Momentum is not declining, but it is not accelerating either. For now, the market is waiting for a catalyst to resolve the ambiguity. The Delivery Hero deal may be precisely that catalyst, though its final impact remains unclear.
Bollinger Bands and Key Levels
Meanwhile, Bollinger Bands on the daily frame place the upper boundary at $76.32 and the lower at $69.98. The midline rests at $73.15. The current close of $74.04 sits slightly above the midline — a mildly constructive position. However, the range itself is wide enough to accommodate significant two-way volatility. The daily ATR of 2.65 confirms that framework. Average intraday swings of nearly $2.65 mean meaningful moves can occur without changing the structural trend.
Still, the EMA200 on the daily chart, sitting at $78.17, remains a significant overhead obstacle. Price trades roughly $4 below that long-term average. Until Uber stock can reclaim $78 territory, the longer-term technical picture remains structurally bearish in context, even if near-term price action stabilizes.
The Delivery Hero Deal: Growth Story with Regulatory Risk
The Delivery Hero deal represents a high-upside, high-uncertainty event for Uber stock, with regulatory risk offsetting the strategic growth narrative. The strategic logic behind the acquisition is straightforward and ambitious. At $14.8 billion in an all-stock transaction, the deal would expand Uber’s platform to 99 markets. It would nearly double the mobility-delivery overlap to 58 markets. In short, Uber is not buying a competitor — it is buying global scale.
At the same time, the all-stock nature of the deal is worth noting. It avoids cash burn but introduces dilution risk for existing shareholders. This may partially explain why Uber stock is not surging on the news. Regulatory scrutiny also looms large. Multiple news sources explicitly flag that regulators may intervene, particularly given the sheer scope of the market consolidation involved.
Therefore, the deal is not yet a clean bullish catalyst. It is a high-upside, high-uncertainty event. The market appears to be pricing it that way.
Intraday Structure: A Subtle Positive Lean
Intraday structure shows a subtle positive lean for Uber stock, with price above all major hourly moving averages and nascent momentum building. On the one-hour timeframe, the picture is slightly more constructive than the daily view suggests. The close at $74.04 sits above the H1 EMA20 ($73.44), EMA50 ($73.58), and EMA200 ($73.13) — all three. That alignment provides a modest intraday tailwind.
Hourly Momentum Dynamics
Notably, the H1 MACD adds an important nuance. The MACD line is at -0.05, still in negative territory, but the histogram has turned to +0.11. That divergence — a rising histogram despite a negative MACD line — suggests nascent upward momentum is building. It is not confirmation, but it is directional. The H1 RSI at 55.02 is consistent with this mild constructive tilt.
In contrast, the H1 Bollinger upper band at $74.24 sits very close to the current close of $74.04. That proximity signals near-term compression. A decisive hourly close above $74.24 would represent a genuine intraday breakout. However, failure to hold above the pivot point at $73.85 would quickly neutralize the current micro-momentum.
Short-Term Execution Context
On the 15-minute frame, used here purely for execution context, the setup is similarly constructive but contained. The close is above the 15m EMA20, EMA50, and EMA200, with a mildly positive MACD histogram at 0.02 and an RSI of 58.38. The 15m ATR is just $0.35, suggesting very tight near-term volatility. Short-term support sits at $73.72 per the 15m pivot S1.
Bullish Scenario: Deal Confidence and Technical Breakout
The bull case for Uber stock rests on regulatory clarity and a technical breakout above $76.32. Two pillars must work in tandem. First, regulatory clarity — or at minimum, the absence of early blocking signals — would likely lift sentiment sharply. If markets begin pricing in a successful Delivery Hero integration, the growth narrative becomes very powerful. Ninety-nine markets and a doubled delivery footprint is a compelling story for long-term investors.
Technically, a daily close above the Bollinger upper band at $76.32 would be a significant signal. The daily pivot R1 at $75.42 is the first meaningful resistance to watch. A clean break there, on volume, would suggest that buyers are gaining real conviction. A subsequent move toward the EMA200 at $78.17 would confirm the structural recovery thesis for Uber stock.
Bearish Scenario: Regulatory Pushback and Distribution Risk
The bear case for Uber stock centers on regulatory pushback against the Delivery Hero deal and failure to hold above $73.19. It is not about the fundamentals of the ride-sharing business. It is about deal risk. If regulators in key European or Asian markets push back aggressively on the acquisition, sentiment could reverse quickly. The all-stock structure also means that any broad market weakness amplifies dilution concerns for UBER holders.
On the chart, failure to hold above $73.19 — the daily EMA20 — would suggest the current neutral regime is drifting bearish. A break below the daily pivot S1 at $72.64 would be the first warning. A move below the Bollinger lower band near $69.98 would invalidate the bullish case entirely. The EMA200 overhead at $78.17 remains an unresolved structural problem for any sustained rally attempt.
Positioning Uber Stock in a High-Stakes Environment
Uber stock is an event-driven trade requiring patience, with the $72.64–$75.42 range serving as the key decision zone. The technical structure is neutral by every objective measure — flat MACD, mid-range RSI, price hugging the short-term averages. Volatility, as measured by a daily ATR of $2.65, is elevated enough to punish poorly-timed entries.
Overall, the Delivery Hero deal introduces a binary dimension. Regulatory approval could unlock a major re-rating. Regulatory intervention could strip the deal’s premium entirely. Until that uncertainty resolves, price action is likely to remain range-bound between the daily S1 at $72.64 and the R1 at $75.42. Traders and investors should treat the current zone as a decision area, not a conviction zone. Regulatory headlines now matter as much as any chart signal.
FAQ
What is driving Uber stock’s current price action?
The $14.8 billion all-stock Delivery Hero acquisition, announced July 16, is the dominant narrative. Meanwhile, neutral technical indicators — including a flat daily MACD and a mid-range RSI of 52.72 — are keeping price action contained within a defined range.
What are the key technical levels for Uber stock?
Support sits at $72.64 (daily pivot S1) and $69.98 (Bollinger lower band). Resistance stands at $75.42 (daily pivot R1) and $76.32 (Bollinger upper band). The EMA200 at $78.17 represents a major overhead obstacle, roughly $4 above the current close of $74.04.
Is the Delivery Hero deal bullish or bearish for Uber stock?
It carries both high upside and significant risk. The deal would expand Uber to 99 markets and nearly double the mobility-delivery overlap to 58 markets. However, the all-stock structure introduces dilution concerns, and regulatory scrutiny could delay or block the acquisition entirely.
What is the short-term outlook for Uber stock?
Intraday structure shows a mild positive lean, with price above all hourly moving averages and a rising MACD histogram. However, the daily picture remains neutral. Until the Delivery Hero uncertainty resolves, the $72.64–$75.42 range is likely to hold.
Disclaimer: This article is for informational purposes only and does not constitute financial advice, an investment recommendation, or a solicitation to buy or sell any financial instrument or cryptocurrency. The analysis provided is not indicative of future results. Investing in crypto assets and financial markets carries a high risk of capital loss. Always do your own research (DYOR) and consult a qualified financial advisor before making any decision.
Article produced with the assistance of artificial intelligence and reviewed by the editorial team.
