




Uber stock turned decisively stronger after the latest earnings-driven move, and the chart now leans bullish. However, the stock is pushing into a key resistance zone where momentum can either extend or stall quickly.
Summary
Uber Stock Regains Trend Support After Earnings
Notably, the fundamental catalyst and the technical backdrop are aligned for now. News flow shows Uber surged after first-quarter results, with rising trips, strong growth commentary, and upbeat guidance offsetting a revenue miss. That matters because sharp post-earnings advances tend to hold better when the market focuses on forward demand rather than a backward-looking headline miss.
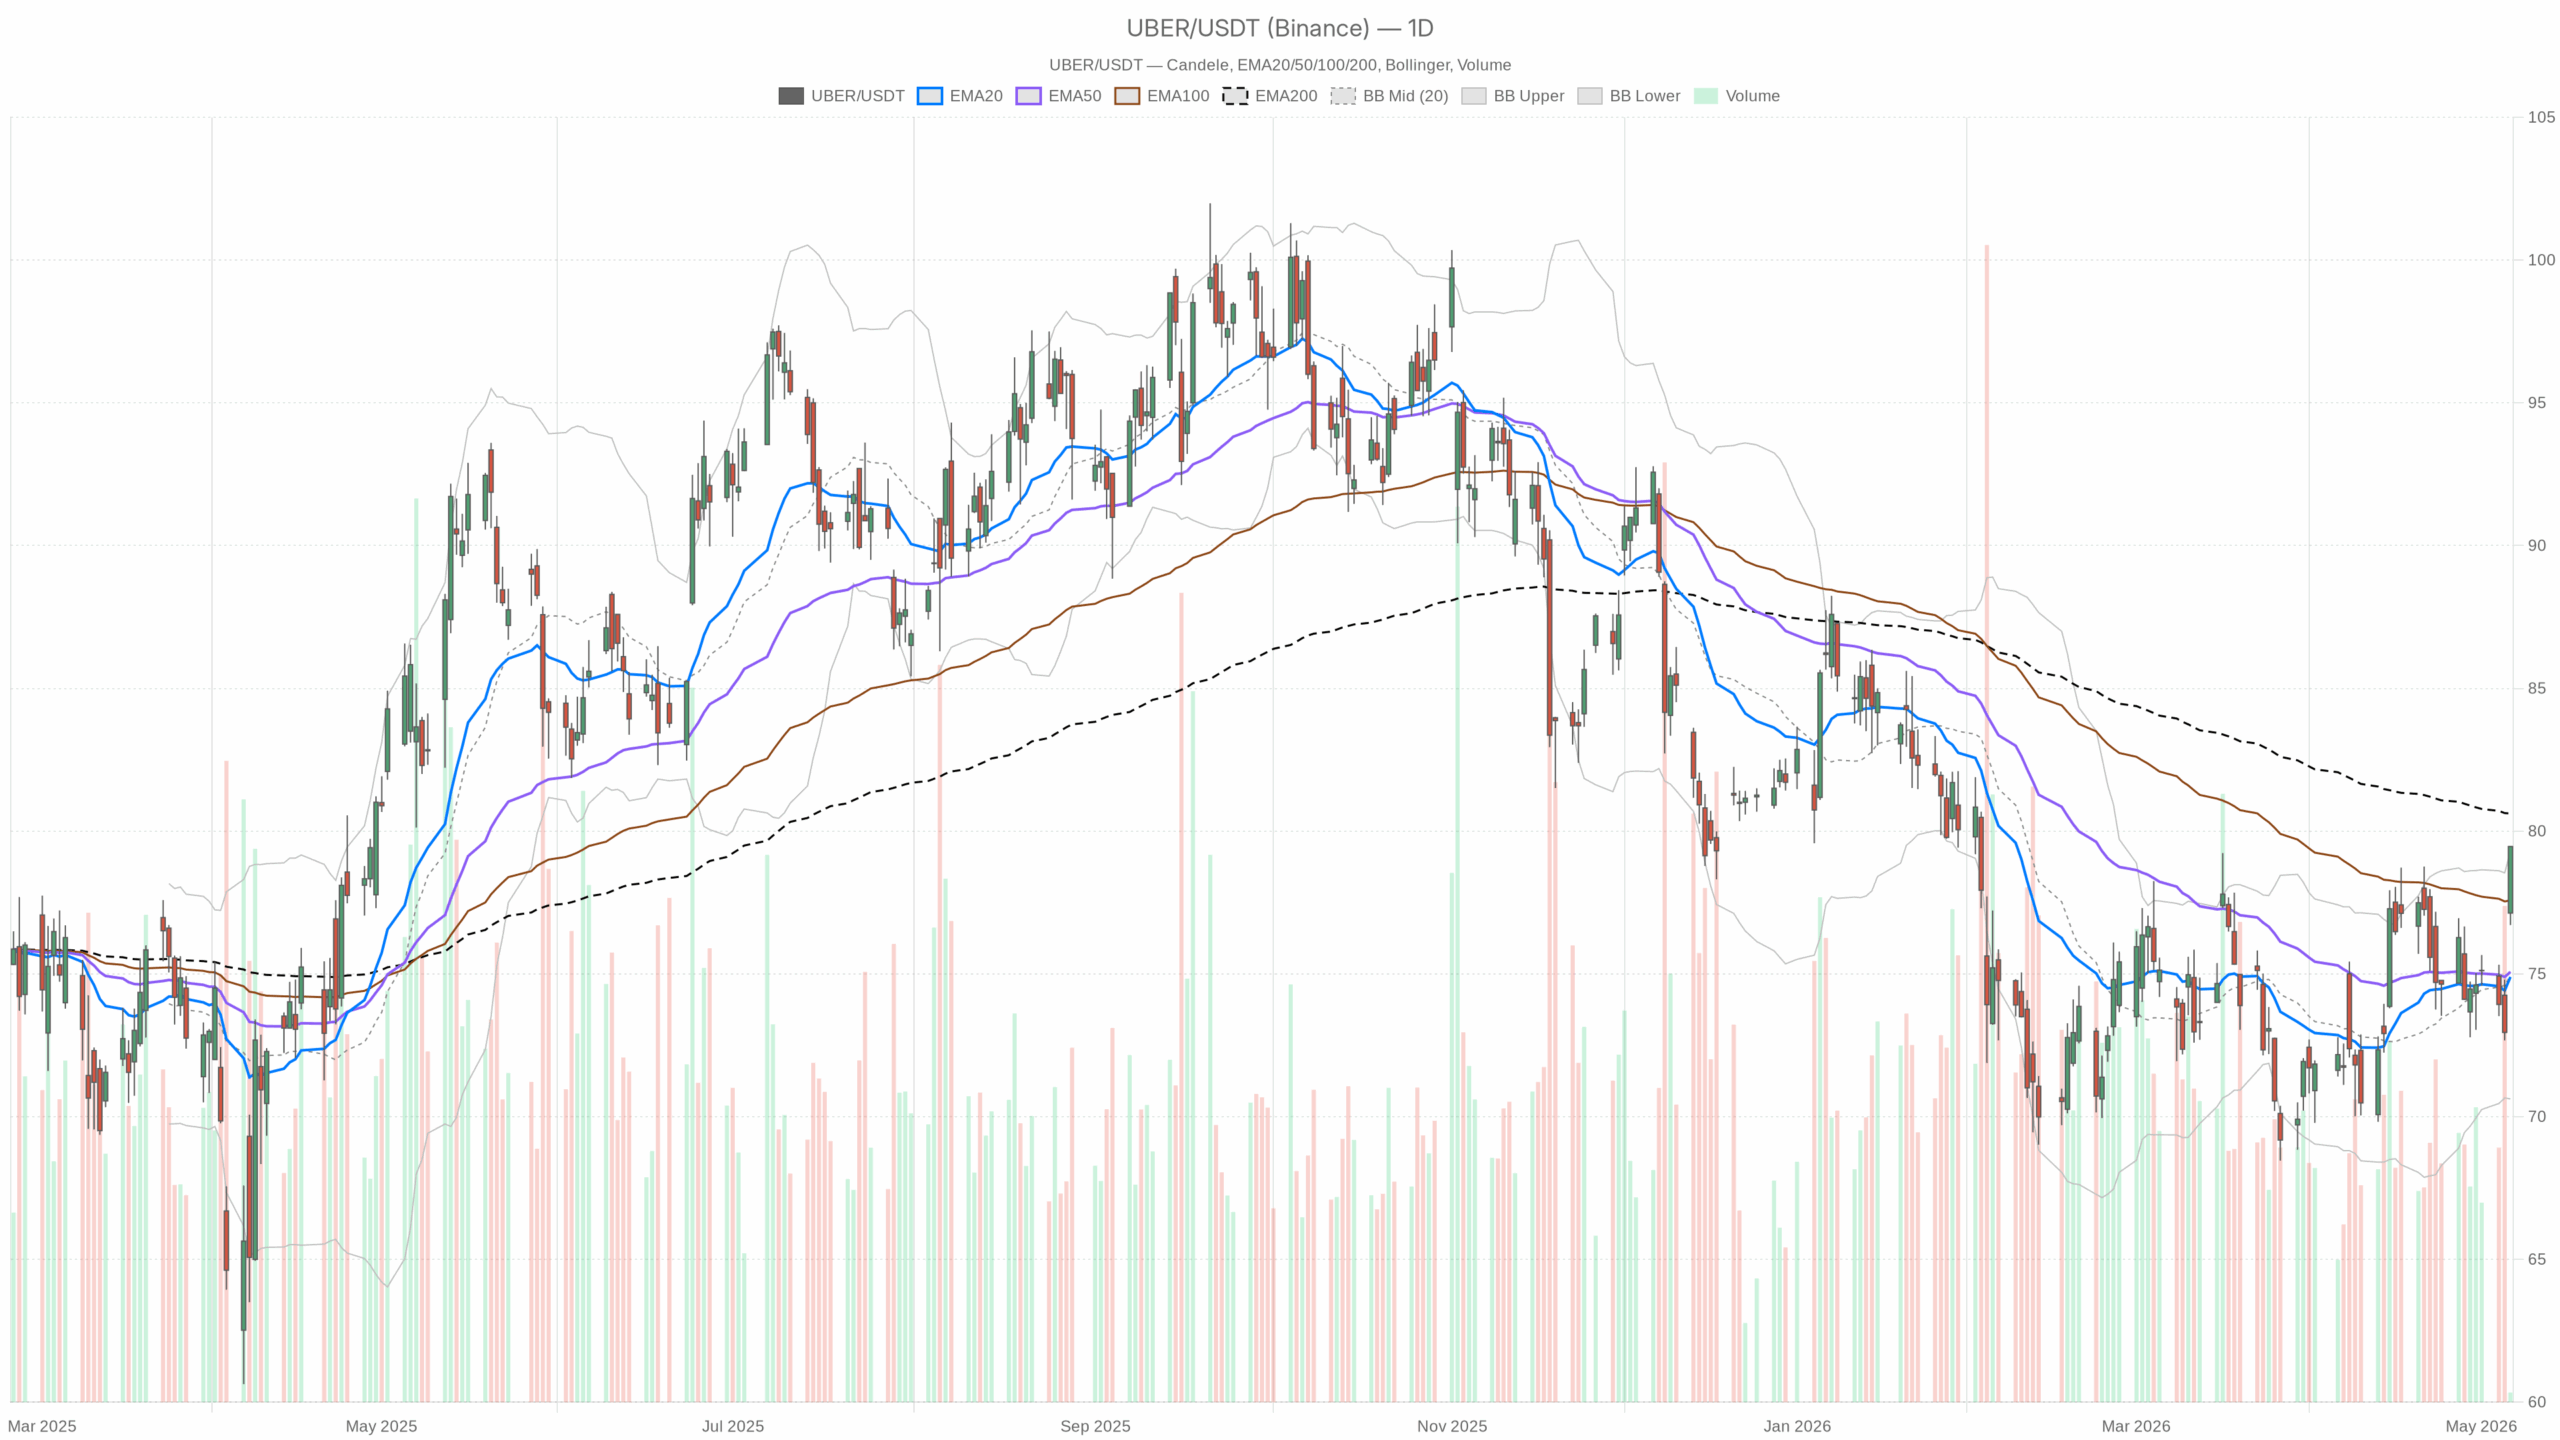
On the daily timeframe, Uber closed at 79.46 after trading between 76.71 and 79.47. That leaves the stock above the 20-day EMA at 74.89 and the 50-day EMA at 75.07. In practical terms, the near-term trend has turned constructive again, and buyers are defending pullbacks above the recent trend base.
However, price remains below the 200-day EMA at 80.62. That keeps the bigger recovery story incomplete and leaves a clear overhead test unresolved.
Uber Stock Daily Chart Signals Bullish Momentum, but Resistance Is Tight
Momentum backdrop stays supportive
The daily RSI stands at 62.86. That shows healthy upside momentum without yet signaling an exhausted move on the higher timeframe. At the same time, it confirms the stock is no longer cheap in the very short run after the post-earnings jump.
Daily MACD is also positive, with the line at 0.50 above the signal at 0.37 and a positive histogram of 0.14. Therefore, the improving trend is still supported, and bullish momentum appears to be building rather than fading.
Volatility and resistance cluster now matter
Meanwhile, Bollinger Bands on the daily chart show a midline at 74.95 and an upper band at 79.28. Uber closed slightly above that upper band at 79.46. That points to strong price action, but it also warns the stock is stretched enough to invite consolidation or a brief mean reversion before the next leg.
Daily ATR sits at 2.42, which points to elevated but manageable volatility for a stock reacting to earnings. Traders should expect wider swings than usual, but not disorderly conditions.
Daily pivot levels reinforce that the market is now testing an important resistance zone. The pivot point is 78.55, with first resistance at 80.38 and first support at 77.62. Holding above the pivot keeps the immediate post-earnings structure constructive.
More importantly, 80.38 sits just below the 200-day EMA at 80.62. That creates a tight overhead cluster that bulls need to clear decisively. Overall, the daily chart sets a bullish bias, but not an unqualified one.
Hourly Uber Stock Setup Shows Strength but Growing Extension
Intraday trend alignment remains clean
The one-hour chart confirms the strength, although it also shows the stock is becoming extended in the short term. Uber is above the 20-hour EMA at 75.15, the 50-hour EMA at 74.94, and the 200-hour EMA at 74.52. That is a clean intraday trend alignment, and it shows dip buyers have controlled the session well beyond the headline reaction.
Overbought conditions are building
However, hourly RSI is 72, which is already in overbought territory. That does not invalidate the rally, but it raises the odds of a pause, especially as price sits near immediate resistance.
Hourly MACD remains very strong, with the line at 0.51 against a 0.01 signal and a 0.50 histogram. Momentum is still accelerating on this timeframe. Therefore, any near-term pullback should be watched as digestion rather than assumed reversal.
In contrast, the hourly Bollinger structure underlines how stretched the move is. The upper band is 78.08, while price is trading at 79.29. That is a clear overshoot, and moves like that often cool off through sideways trade or a modest retracement.
Hourly ATR at 1.09 shows intraday ranges are active enough to produce sharp swings around levels, particularly after earnings. Hourly pivot levels are also very tight, with the pivot at 79.37, resistance at 79.45, and support at 79.21.
The latest price at 79.29 sits just below the pivot and near support after testing resistance. That suggests immediate follow-through is hesitating, even though the broader intraday trend remains bullish. In other words, the trend is up, but the stock is no longer in an easy chase zone.
15-Minute Uber Stock Chart Serves as Execution Context
The 15-minute chart should be treated only as execution context, and it largely mirrors the hourly picture. Uber remains above its 20-period EMA at 75.8, 50-period EMA at 74.99, and 200-period EMA at 74.9. That keeps the short-term tape firmly positive.
RSI at 76.02 shows the move is stretched on a very short horizon, while MACD stays strongly positive with the line at 1.11 above the 0.47 signal. Buyers still have momentum, but they are operating in an overheated short-term condition.
Additionally, the 15-minute Bollinger upper band sits at 79.16, while price is at 79.29. That again signals an extension rather than a fresh low-risk breakout entry.
The 15-minute pivot structure matches the hourly levels, with 79.37 as pivot, 79.45 as resistance, and 79.21 as support. For timing purposes, sustained trade back above 79.37 to 79.45 would show buyers are absorbing near-term profit-taking. Failure to hold 79.21 would increase the odds of a deeper intraday cooling move.
Uber Stock Outlook: Bullish Bias, but Follow-Through Is Critical
The cross-timeframe message is fairly clear. The daily chart is bullish, supported by positive momentum and a strong earnings catalyst. Meanwhile, the hourly and 15-minute charts confirm that strength, but they also warn the stock is stretched after a sharp move.
So there is no real directional conflict here. The conflict is between trend strength and short-term extension.
The bullish scenario is straightforward. If Uber stock holds above the daily pivot at 78.55 and buyers keep defending dips above the 77.62 support area, the market can continue pressing toward 80.38 and then the 200-day EMA at 80.62.
A clean break through that resistance cluster would strengthen the broader recovery case. It would also suggest the earnings move is developing into a more durable upside trend rather than a one-day reaction.
On the other hand, the bearish scenario starts with failed follow-through near current levels. If the stock cannot reclaim the intraday pivot zone around 79.37 to 79.45 and slips back under 78.55 on the daily structure, the post-earnings spike would begin to look overextended.
A break below 77.62 would weaken the immediate bullish thesis further. In that case, the door would open to a retracement back toward the 20-day and 50-day EMA zone around 75.
Overall, Uber stock has earned a bullish near-term bias after earnings, and both momentum and trend structure support that view. Still, the rally is now testing dense resistance while short-term indicators are overbought. That leaves the stock in a strong but less forgiving position, where holding gains matters as much as adding new ones.
Volatility remains elevated, and the next move will depend on whether buyers can turn this earnings spike into sustained acceptance above resistance.
