




Lumentum stock remains in a clear daily uptrend, supported by strong earnings and a higher Bank of America price target. However, near-term momentum has cooled after the earnings-driven surge, leaving LITE in a constructive but more fragile position around key pivot levels.
Summary
Lumentum Stock outlook stays bullish on the daily chart
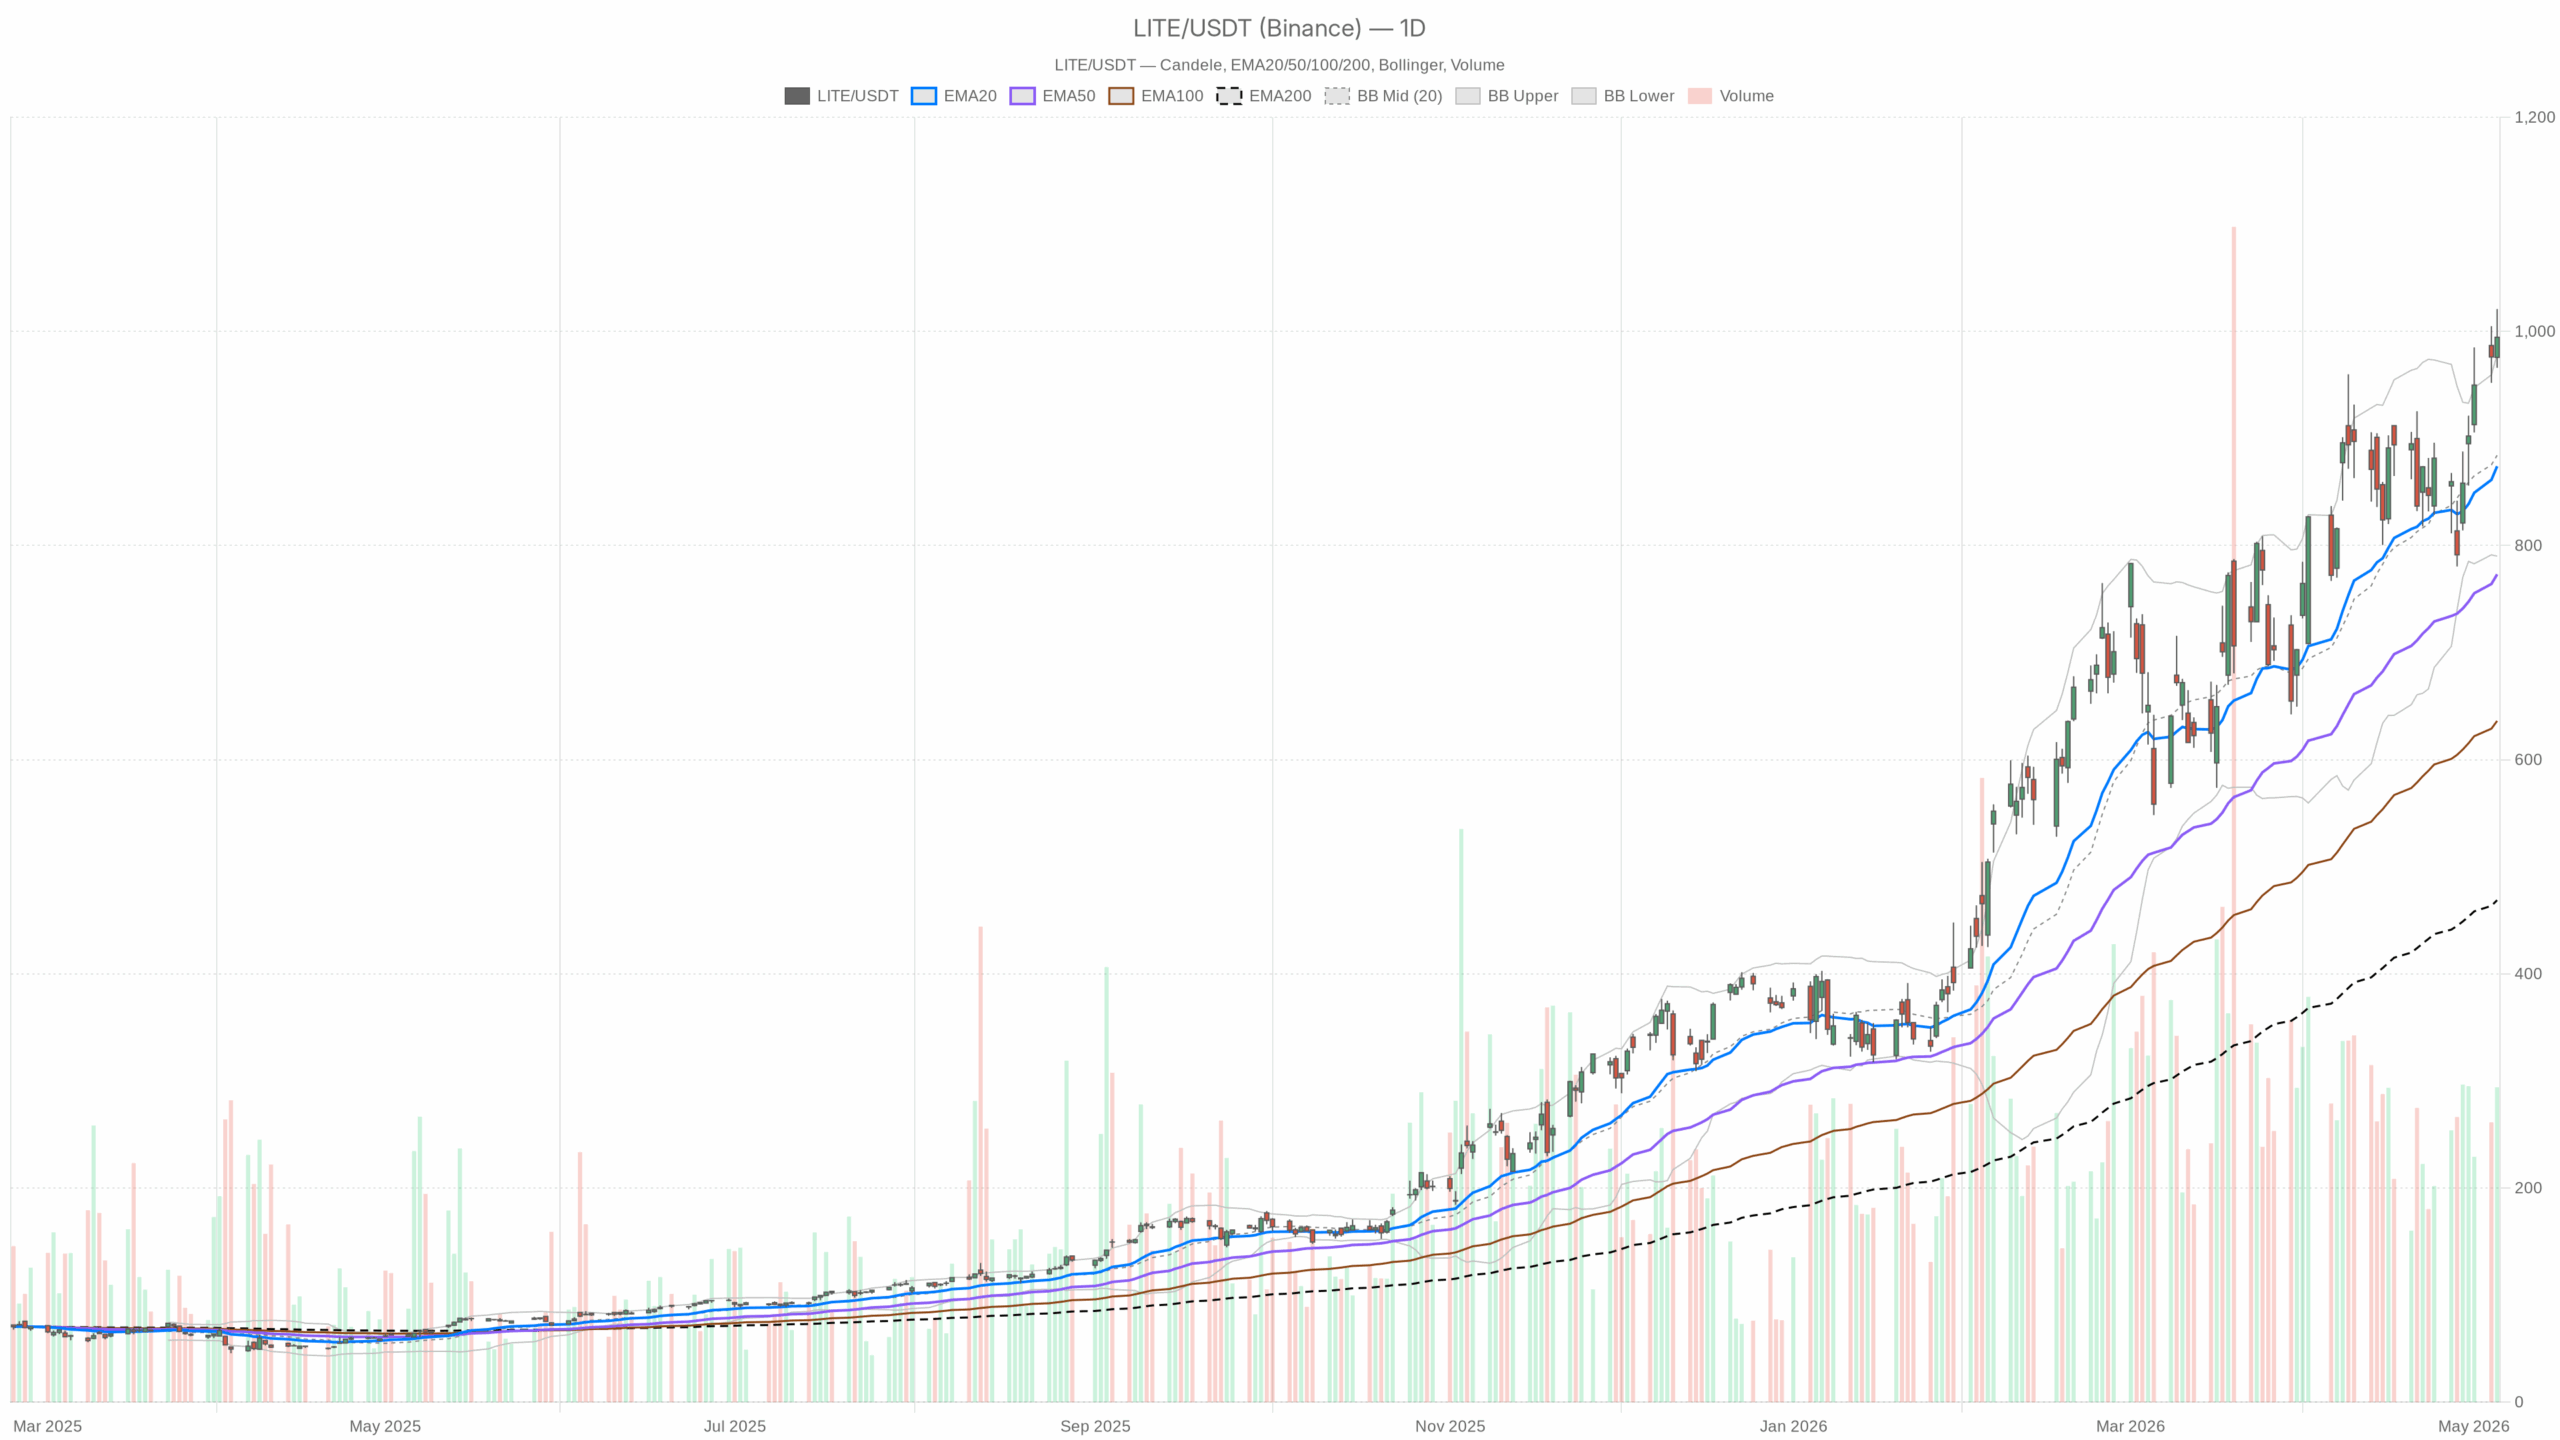
On the daily timeframe, the trend structure remains decisively positive. Lumentum stock is trading above the 20-day EMA at 874.12, the 50-day EMA at 773.19, and the 200-day EMA at 468.83. That alignment signals trend persistence and shows buyers still control the broader structure across short, medium, and long horizons.
Meanwhile, daily RSI stands at 64.8. That is firm but not extreme, which matters because it points to strong momentum without confirming a fully stretched condition. Daily MACD also remains bullish, with the MACD line at 50.39 above the signal line at 44.09 and a positive histogram of 6.3.
Notably, price closed at 994.56, above the upper Bollinger Band at 978.57. That reflects strong upside pressure. However, it also suggests the stock is extended in the short run and may need consolidation before attempting a cleaner continuation. Daily ATR at 67.46 reinforces that volatility remains elevated after the earnings move.
Daily pivot levels define the next decision zone
The daily pivot point sits at 993.87, almost exactly where price closed. Resistance stands near 1021.69, while support comes in at 966.75. Therefore, Lumentum stock is trading near an important decision area. Holding above the pivot keeps the market biased toward another resistance test. A break below it would open the door to a deeper pause.
Lumentum Stock on the one-hour chart: trend intact, momentum softer
On the one-hour chart, the bullish case remains broadly intact, but it is less convincing than the daily setup. Price closed at 995.01, still above the 20-hour EMA at 976.53, the 50-hour EMA at 931.45, and the 200-hour EMA at 848.32. That tells us the intermediate trend has not broken down, and buyers still retain structural control despite the latest pullback.
At the same time, hourly momentum has cooled. RSI is 61.56, which remains supportive but no longer shows accelerating strength. More importantly, MACD has softened, with the MACD line at 27.73 below the signal line at 29.83 and a negative histogram of -2.1. That indicates upside momentum is fading on this timeframe, even though the broader uptrend remains in place.
Hourly volatility and pivot structure
The one-hour Bollinger Bands show a midline at 982.9 and an upper band at 1022.75. With price near 995.01, LITE is no longer pressing the upper envelope. Instead, it is trading back toward the middle of the hourly range. That often reflects digestion rather than immediate trend failure. Hourly ATR at 22.95 also points to active but more contained volatility than the daily chart.
The one-hour pivot levels sharpen the near-term map. The pivot is 1000.76, resistance is 1011.24, and support is 984.54. Price closed just below the pivot, which weakens immediate upside pressure. Therefore, the stock likely needs to reclaim and hold above 1000.76 to rebuild intraday momentum and put 1011.24 to 1021 back in focus.
15-minute Lumentum stock action shows a tactical pullback
On the 15-minute chart, the message is tactical rather than directional. The regime is neutral, and the short-term indicators reflect a market pulling back inside a larger uptrend. Price at 995.01 is below the 20-period EMA at 1006.65 but still above the 50-period EMA at 992.47 and far above the 200-period EMA at 929.66.
In contrast, the 15-minute RSI at 43.95 and the MACD setup point to recent seller control. The MACD line is at 3.92, below the signal line at 6.25, with a negative histogram of -2.33. The lower Bollinger Band sits at 994.89, almost exactly where price closed. That suggests the stock is pressing the lower edge of its immediate range, which can produce either a rebound attempt or a brief flush before support stabilizes the move.
Multi-timeframe view and key Lumentum Stock scenarios
The key point is that the timeframes are not in full agreement. The daily chart is clearly bullish. The one-hour chart still supports that bias structurally, but momentum has weakened. Meanwhile, the 15-minute chart is in a short-term corrective mode. That conflict does not negate the bullish trend. However, it does argue against chasing strength near current levels unless the intraday picture improves.
The bullish scenario remains straightforward. If Lumentum stock holds around the daily pivot near 993.87 and regains the hourly pivot at 1000.76, the market can stabilize and reattempt resistance near 1011.24 and 1021.69. A clean push through that upper zone, especially if hourly momentum turns back up, would confirm that the post-earnings trend is still extending rather than simply consolidating.
On the other hand, the bearish scenario is also easy to define. If price slips below hourly support at 984.54 and then loses daily support near 966.75, the current bullish case would weaken materially. That would suggest the earnings rally is entering a deeper retracement phase, not just a healthy pause. In that setup, the stock’s extension above key daily averages would matter more, because stretched trends can correct sharply when momentum fades.
Overall Lumentum Stock assessment
Overall, Lumentum stock still deserves a bullish label because the daily trend is strong, the moving-average structure is firmly positive, and recent news flow has been supportive. Still, near-term momentum has cooled after the surge, and volatility remains elevated. That leaves the stock in a constructive but more fragile position, where holding key pivot and support zones matters if buyers want to keep control.
