




AppLovin stock enters earnings with a cautiously bullish setup, but the trend is not clean enough to confirm a breakout. APP closed at 478.11, almost exactly on the 477.01 pivot point, leaving the stock balanced near a key decision area rather than extending decisively in either direction.
Summary
AppLovin stock outlook stays constructive on the daily chart
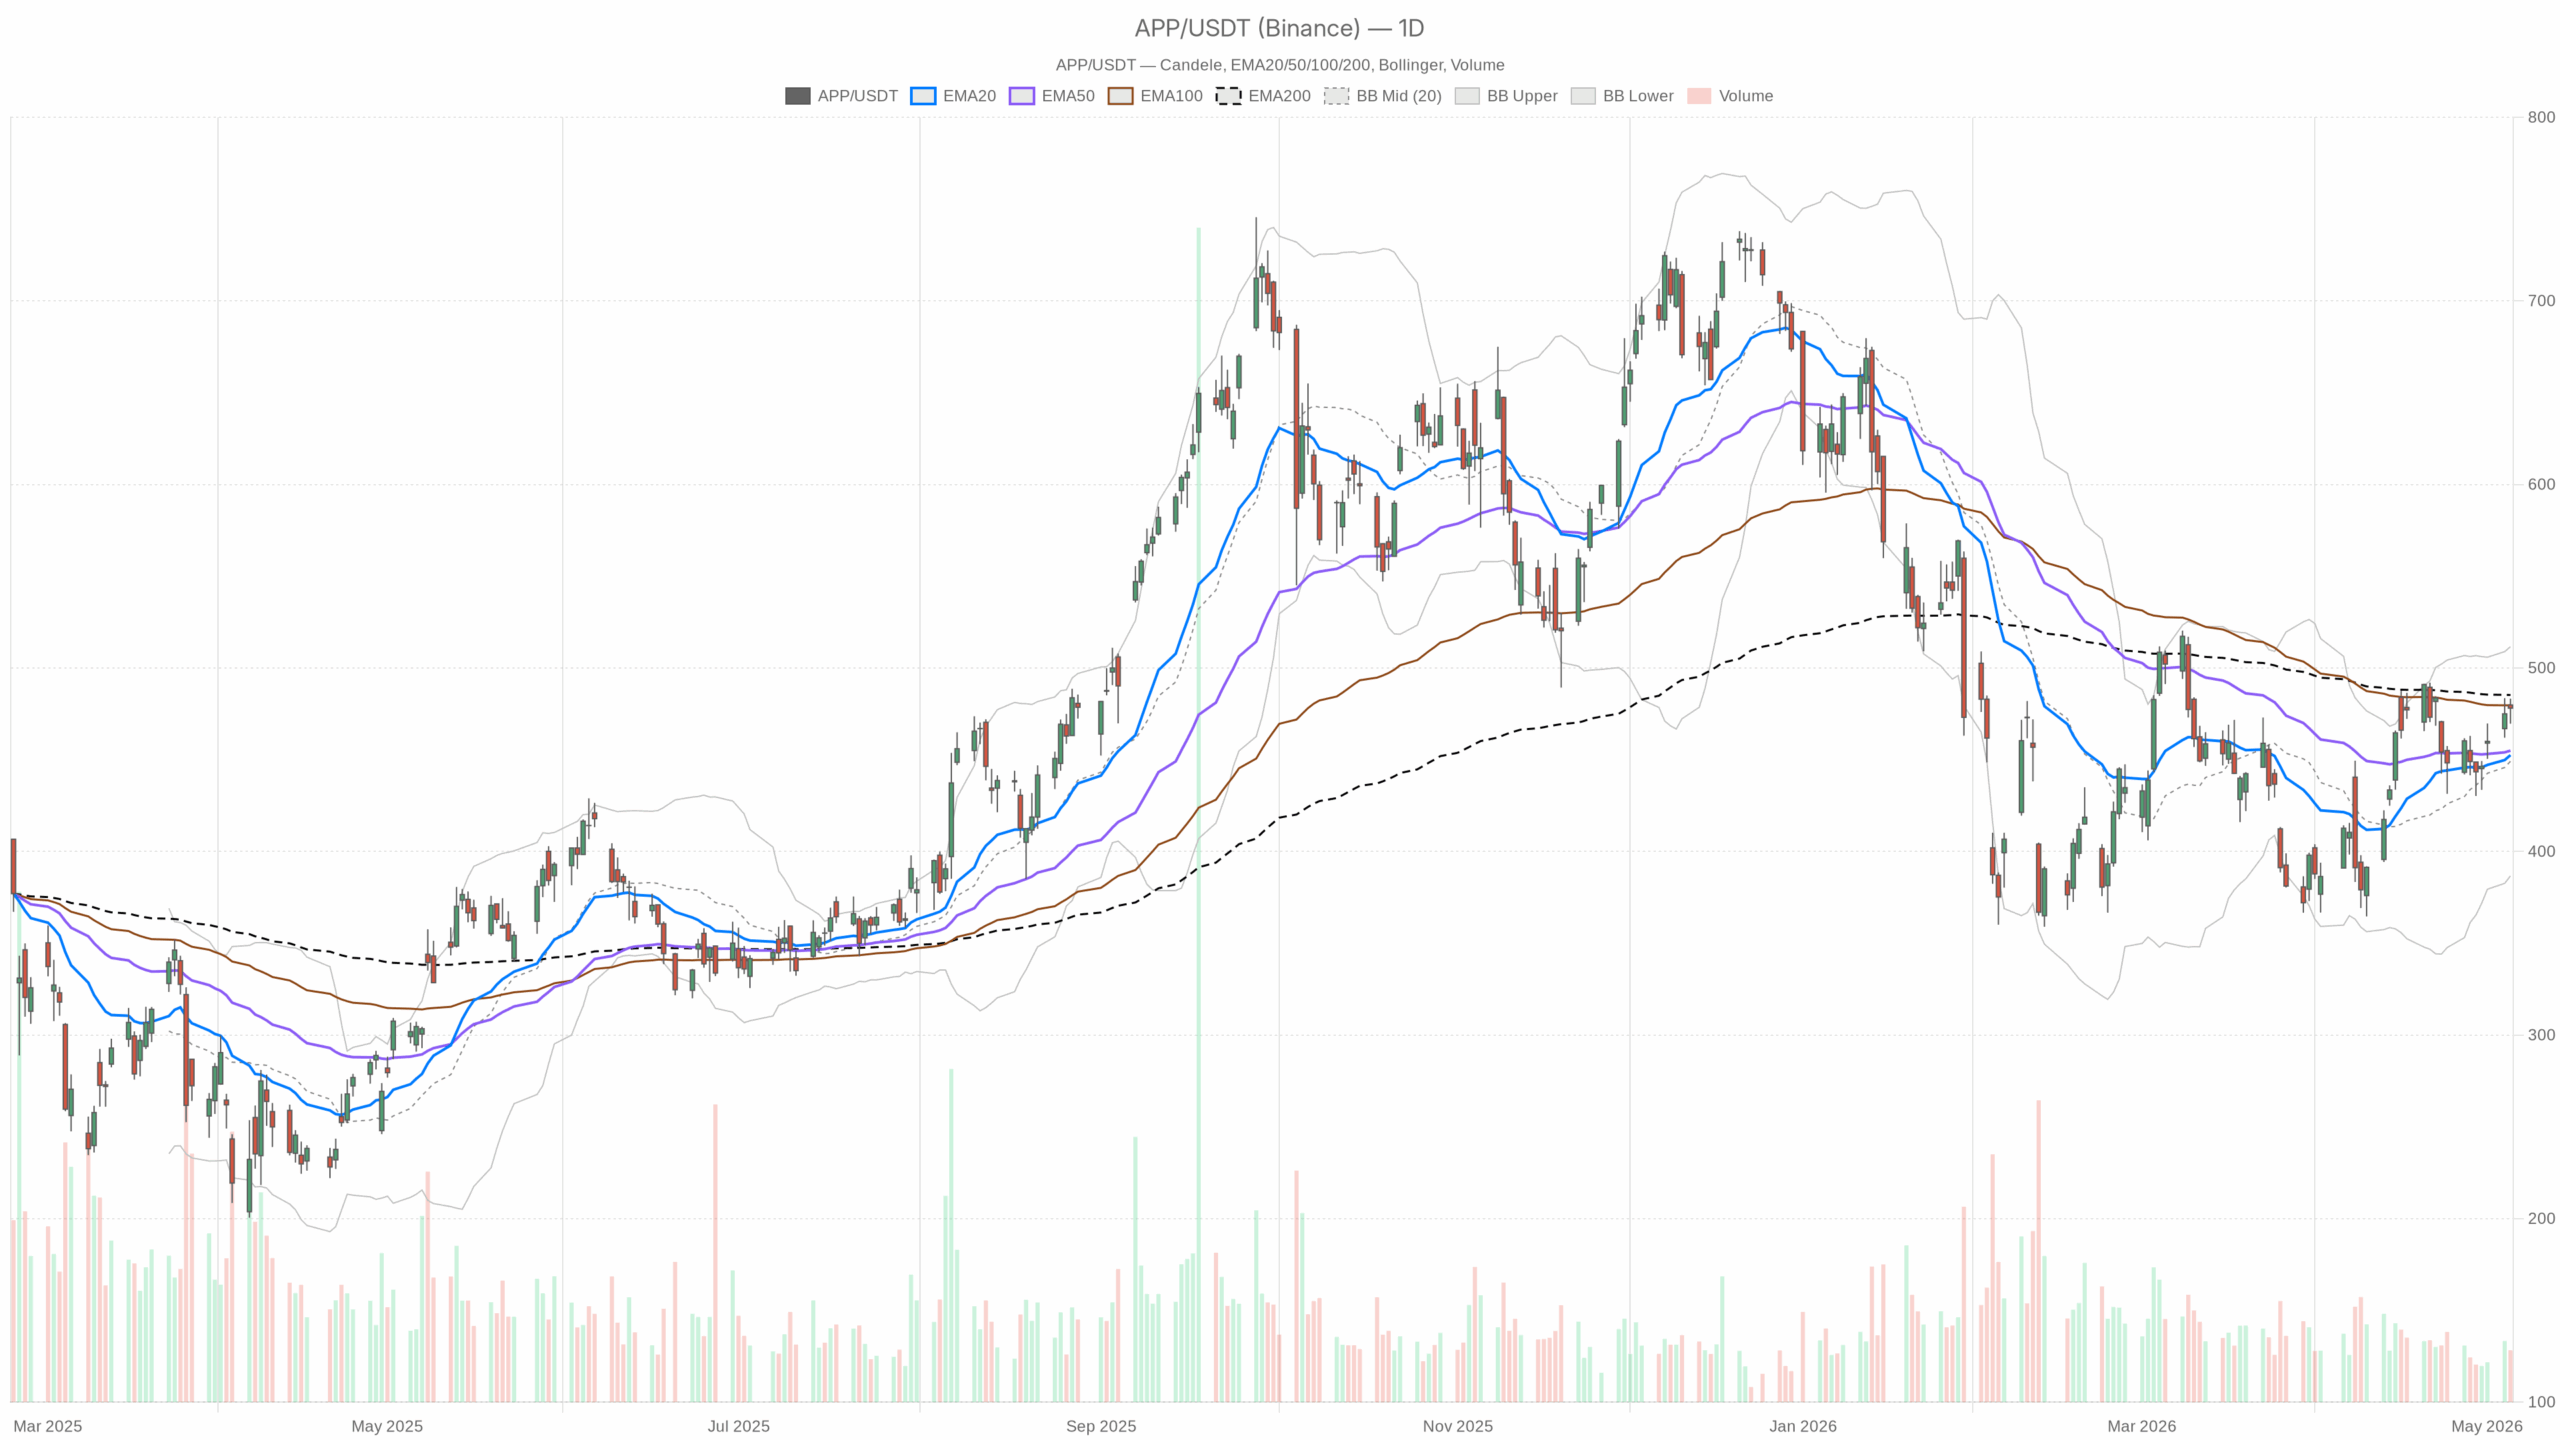
The broader daily structure remains constructive. APP is trading above its 20-day EMA at 452.53 and above its 50-day EMA at 454.96. That keeps the medium-term recovery intact and shows buyers still control the trend from lower levels.
However, the stock remains below its 200-day EMA at 485.28. That keeps a major overhead barrier in play. It also explains why the daily regime is still tagged as neutral rather than fully bullish.
Momentum remains supportive, but not stretched
Daily momentum is supportive, but not euphoric. The RSI stands at 58.48, which points to positive momentum without indicating a stretched market. In practical terms, buyers still have room to press higher.
Meanwhile, MACD is positive, with the line at 8.96 above the 6.77 signal line and a histogram of 2.19. That suggests upward momentum is still building rather than fading.
Volatility and pivot levels frame the setup
Volatility also adds useful context. Daily Bollinger Bands sit between 386.71 and 511.60, with a midpoint at 449.16. APP is trading in the upper half of that range, which supports the recovery bias.
Still, the stock is not yet pressing the upper band aggressively. Therefore, the move still looks like a controlled advance rather than a momentum spike. Daily ATR is 22.38, signaling that APP can still move sharply on new catalysts. That matters even more with earnings risk close by.
On support and resistance, the daily pivot map is tight. The stock closed above S1 at 470.72 and just under R1 at 484.39. That leaves APP boxed into a narrow technical zone near the close.
A push through 484.39 would also bring the 200-day EMA into direct focus. That area is the first real test for bulls. On the other hand, a drop back through 470.72 would suggest buyers are losing short-term control.
APP short-term trend stays positive, but momentum is flattening
The hourly chart strengthens the daily case, but only to a point. APP is above the 20-hour EMA at 471.28, the 50-hour EMA at 462.54, and the 200-hour EMA at 449.86. That alignment confirms short-term trend support and shows dip buyers have been active.
In addition, the hourly RSI at 61.51 remains firm. That reflects positive momentum, although it is approaching levels where follow-through needs fresh demand.
Hourly MACD shows less urgency
However, the hourly MACD is much less convincing than the daily one. The MACD line is 7.14 versus a 7.08 signal line, and the histogram is only 0.06. That is still positive, but barely.
It tells us upside momentum has not broken down, yet it is losing urgency. At the same time, the hourly Bollinger Bands, from 455.84 to 488.08 around a 471.96 midpoint, place APP near the upper half of the short-term range. That supports the bullish bias, but it also shows the stock is nearing local resistance rather than emerging from it.
AppLovin stock faces intraday hesitation near the pivot
The 15-minute chart adds a more cautious execution backdrop. Price at 478.11 is sitting almost exactly on the 15-minute 20 EMA at 478.15 and close to the Bollinger midpoint at 478.17. That signals near-term equilibrium rather than immediate directional pressure.
RSI at 52.45 is neutral, while MACD has slipped slightly negative, with the line at 1.50 below the 1.67 signal line and a histogram of -0.17. In other words, the intraday tape is stalling even as the higher timeframes still lean constructive.
That conflict across timeframes matters. The daily chart favors a gradual bullish continuation. The hourly chart generally confirms that view, but with momentum flattening. Meanwhile, the 15-minute chart shows hesitation around the same pivot area, suggesting APP may need a fresh catalyst to clear resistance cleanly. Given the news flow, that catalyst is likely to be earnings.
Fundamental backdrop supports APP, but valuation remains a constraint
Fundamentally, the near-term backdrop is supportive but not one-sided. Recent coverage points to expectations for strong Q1 results, with robust earnings growth, roughly 20% revenue growth, solid margins, and continued focus on e-commerce expansion through Axon Ads.
That gives bulls a clear narrative. However, reports also highlight rich valuation and mixed price action heading into the release. That caution fits the chart well: optimism is present, but conviction is still being tested near major resistance.
Key AppLovin stock levels into earnings
Bullish scenario
The bullish scenario is straightforward. APP needs to hold above the 470.72 support zone and then reclaim 484.39 on the daily pivot framework. A sustained move above the 200-day EMA at 485.28 would matter even more, because it would remove a key technical ceiling and shift the daily picture from neutral recovery to a firmer bullish trend.
If that happens, the upper daily Bollinger area near 511.60 becomes a logical next region to watch.
Bearish scenario
Conversely, the bearish scenario starts with failure around 484 to 485, followed by a break back below 470.72. That would show resistance is still winning and that the recent bounce is losing structure.
If sellers force APP under the daily 20-day EMA at 452.53 and the 50-day EMA at 454.96, the bullish recovery thesis would weaken sharply. In that case, the market would likely reassess whether the rally into earnings had been overextended.
AppLovin stock outlook ahead of earnings
Overall, AppLovin stock is leaning higher, but not yet with decisive strength. The daily chart carries the main message: recovery is intact, but major resistance is close overhead. The hourly chart supports that bias, while the 15-minute view warns of fading short-term momentum.
With ATR still elevated and earnings expectations high, positioning remains sensitive to both breakout risk and reversal risk.
