




Lucid stock is trying to stabilize near the lower end of its broader range ahead of earnings. However, LCID still trades within a bearish daily structure, which leaves the rebound vulnerable unless buyers can reclaim nearby resistance and improve the higher-timeframe trend.
Summary
Lucid stock analysis: Daily trend remains bearish
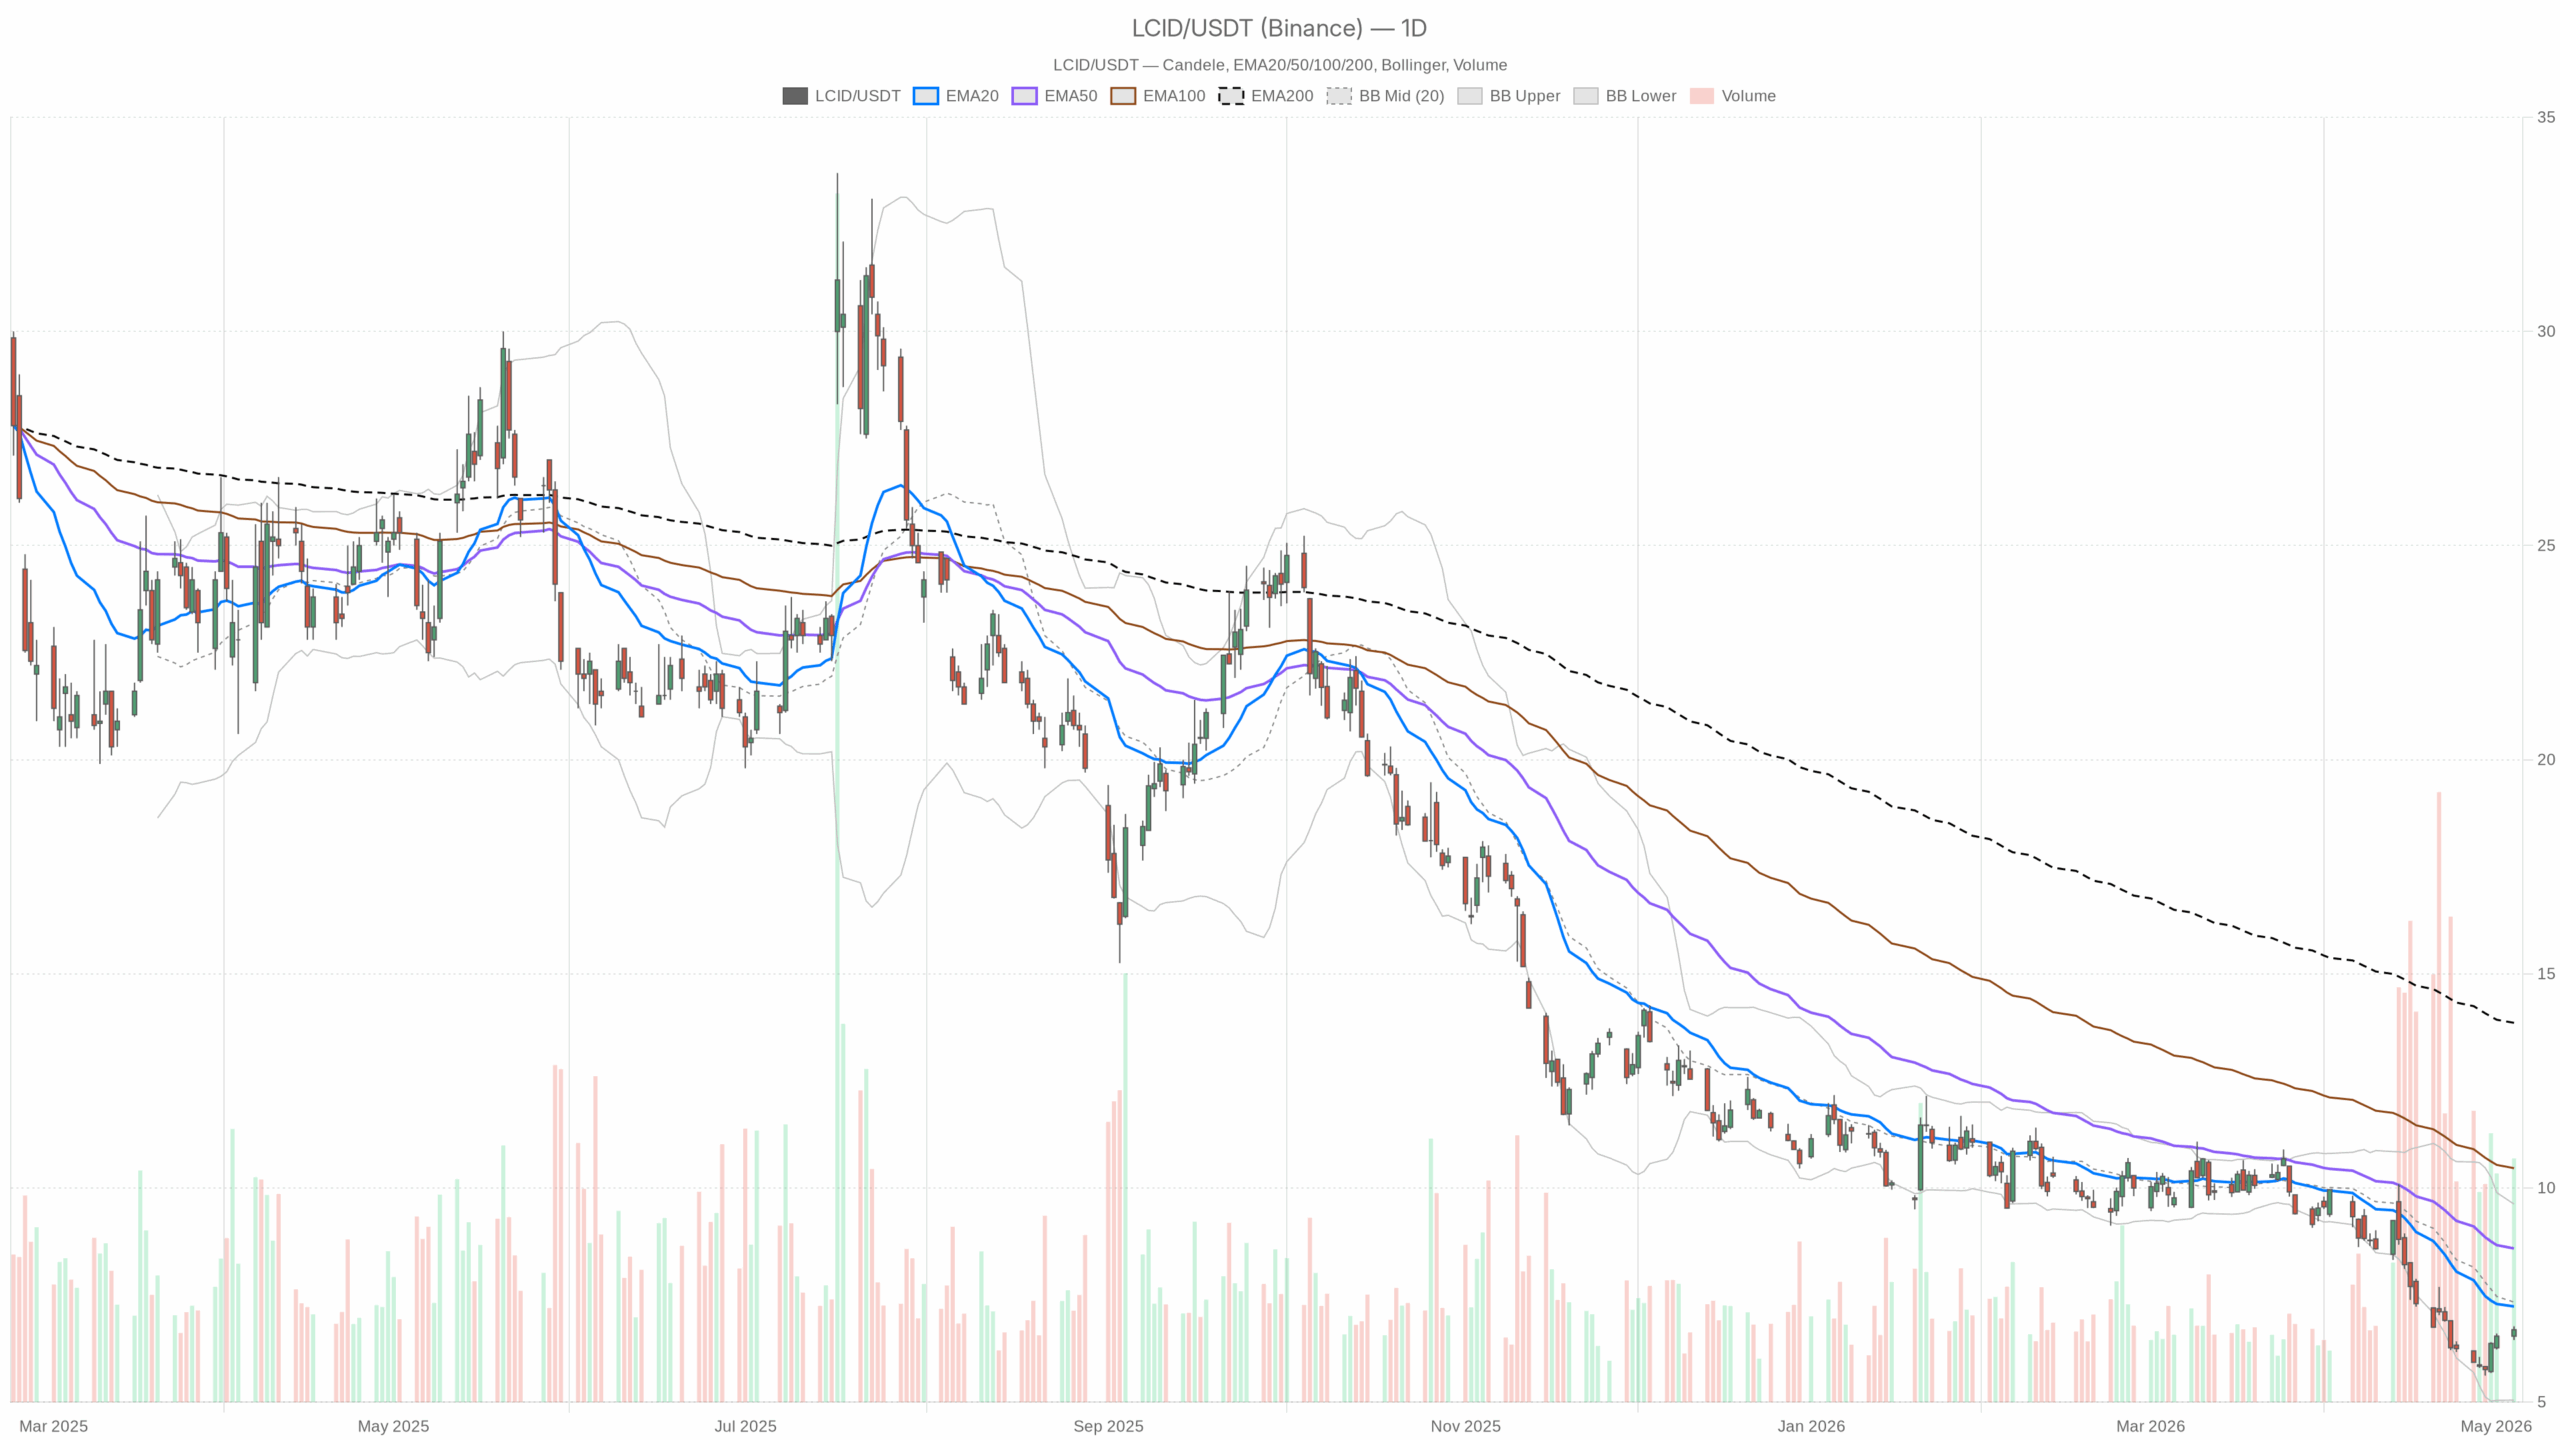
Lucid stock closed at $6.69 on May 4, slightly above the daily pivot at $6.64 and just below resistance at $6.82. That keeps near-term price action somewhat firmer. However, the broader structure remains weak, and this rebound is still unfolding inside a much larger downtrend.
The daily timeframe sets the main bias, and it remains defensive. LCID trades below the 20-day EMA at $7.23, the 50-day EMA at $8.59, and the 200-day EMA at $13.86. That shows weakness across short-, medium-, and long-term trend layers. As a result, buyers may be attempting a bounce, but they are still operating beneath heavy overhead supply.
Momentum is soft, but downside pressure is easing
Daily momentum remains weak, though it is not collapsing. The RSI stands at 38.65, which keeps Lucid stock in bearish territory without reaching a deeply oversold reading. That points to weak underlying demand rather than panic selling.
At the same time, the MACD remains negative, with the line at -0.86 versus a -0.87 signal and a marginally positive histogram. Therefore, downside momentum appears to be easing. Still, that does not yet amount to a confirmed trend reversal.
Volatility context keeps earnings risk elevated
Daily Bollinger Bands add context to the setup. The midpoint sits at $7.33, the upper band at $9.62, and the lower band at $5.05. With LCID trading below the midpoint and in the lower half of the band structure, the stock remains in a weak price zone.
Still, Lucid stock is no longer pressing the extreme lower band. That supports the idea of stabilization rather than an active breakdown. Meanwhile, daily ATR is $0.53, which is a relatively large move for a $6 to $7 stock. Earnings could therefore amplify already elevated price swings.
LCID short-term recovery is improving, but broader damage remains
The one-hour chart complicates the bearish daily view. LCID is trading above its 20-hour EMA at $6.48 and 50-hour EMA at $6.43, which confirms a short-term recovery. However, it remains far below the 200-hour EMA at $7.70. That means the bounce has improved short-term conditions, but it has not repaired the broader technical damage.
Hourly momentum stays constructive near resistance
The hourly momentum picture is constructive. RSI is 64.39, showing buying pressure has improved materially. MACD is also positive, with the line at 0.16 versus a 0.14 signal and a small positive histogram. That supports the view that near-term momentum is still leaning higher.
Even so, the one-hour regime is only neutral. This fits a market that is rebounding within a larger bearish structure rather than starting a clean upside trend.
Notably, hourly Bollinger Bands place the midpoint at $6.48 and the upper band at $6.90, while price closed at $6.68. LCID is trading in the upper half of the hourly band range, which shows buyers currently control the short-term tape. Yet the stock is also approaching the upper band and sitting almost exactly on the hourly pivot at $6.68, with nearby resistance at $6.75. That creates a clear short-term test zone where momentum must follow through to keep the rebound alive.
Hourly ATR at $0.14 suggests intraday movement remains active, but not disorderly outside an event catalyst.
Lucid stock intraday setup shows a pause, not a breakdown
On the 15-minute chart, the execution backdrop is mildly constructive but less decisive. LCID is above the 20-period EMA at $6.66, the 50-period EMA at $6.55, and the 200-period EMA at $6.41. That supports short-term trend alignment for traders watching immediate price action.
However, the 15-minute RSI is 54.82 and the MACD histogram has turned slightly negative. That points to a rebound that may be losing momentum near resistance rather than accelerating.
In addition, the 15-minute pivot structure is tight. The pivot sits at $6.70, with resistance at $6.73 and support at $6.65, while the latest close was $6.68. Lucid stock is therefore trapped in a narrow intraday decision zone. Bollinger Bands from $6.56 to $6.77 and ATR at $0.06 reinforce that this timeframe is better used for timing than for broader directional conviction.
LCID outlook: Key levels and earnings scenarios
The conflict across timeframes is clear. The daily chart still argues for a bearish primary trend, as LCID remains below all major daily moving averages and below the daily Bollinger midpoint. By contrast, the hourly chart confirms a tactical rebound, while the 15-minute chart shows that rebound is pausing rather than failing outright. Overall, the current move still looks more like a countertrend recovery than a completed trend change.
A bullish scenario would require LCID to hold above the daily pivot area around $6.64 and extend through the near-term resistance band between $6.75 and $6.82. If that happens, the hourly recovery would gain credibility. The market could then start challenging the daily 20-day EMA near $7.23.
A stronger bullish case would also require further daily MACD improvement and a daily RSI push out of the high-30s into firmer recovery territory. Without that, upside may remain limited to a reflex bounce.
On the other hand, the bearish scenario remains the base case until the daily structure improves. A failure to hold the $6.64 to $6.50 zone would put pressure back on the recent floor and reopen downside risk toward the lower daily Bollinger region. That would also invalidate the short-term bullish argument from the hourly chart, especially if price slips back below the 20-hour and 50-hour EMAs.
With earnings due Tuesday, any disappointment around revenue, guidance, or delivery expectations could quickly overwhelm the fragile rebound.
Lucid stock remains tactical until daily resistance is reclaimed
Overall, Lucid stock is attempting to stabilize ahead of earnings, but the bigger trend still favors caution. Short-term momentum has improved, and that prevents an outright bearish collapse call. However, until LCID reclaims more meaningful daily resistance, rallies still look tactical and vulnerable.
At the same time, positioning into the event is likely to remain sensitive. Volatility is elevated, and conviction is limited by the clear gap between short-term strength and a still-bearish daily trend.
