




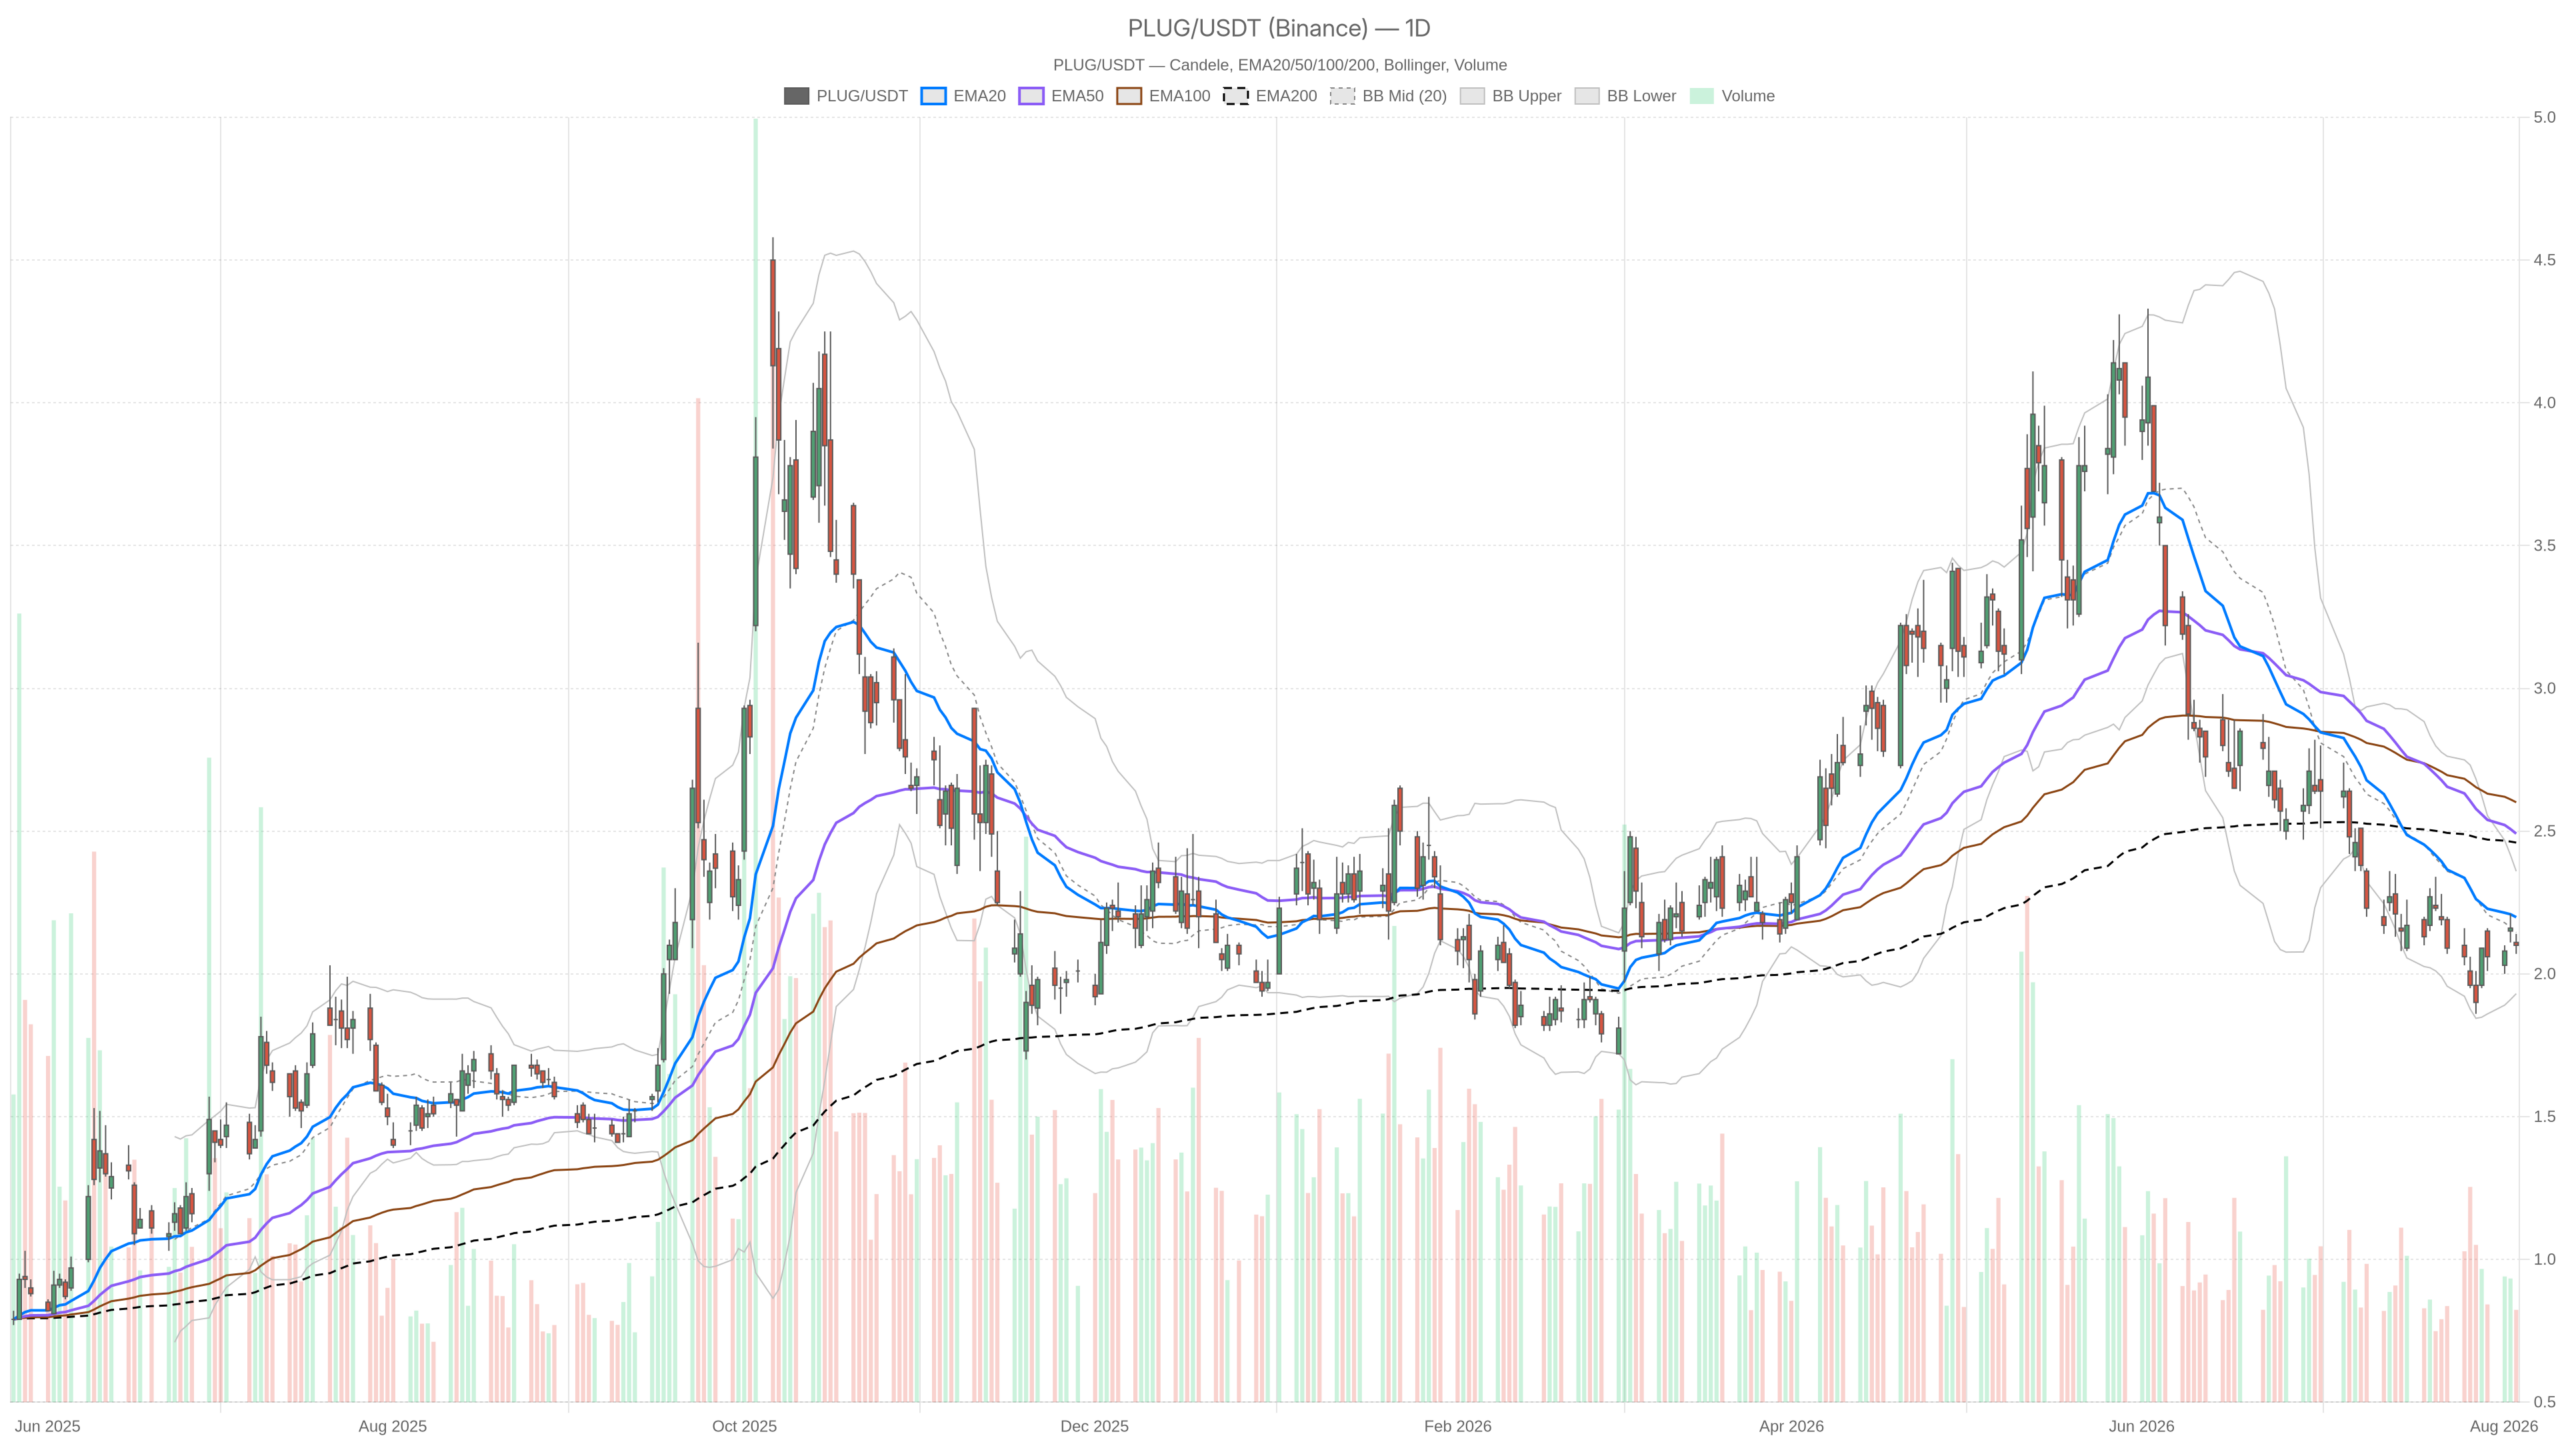
Plug Power stock closed at $2.10 on August 5, sitting below every major daily moving average. The EMA20, EMA50, and EMA200 stack above price in a textbook bearish alignment. Momentum is soft but not collapsing. Volatility remains elevated ahead of the August 10 earnings report.
Summary
Key takeaways
- Plug Power stock closed at $2.10 on August 5, below the EMA20, EMA50, and EMA200 on the daily chart.
- Daily RSI14 at 40.66 confirms bearish momentum, though the reading is not yet oversold.
- The August 10 earnings report is the dominant near-term catalyst, with pre-report analysis flagging low beat probability.
- Hourly consolidation near $2.09–$2.10 has not reversed the broader downtrend.
- A decisive break above $2.14 or below $2.07 will likely determine the post-earnings direction.
Daily Timeframe: Structure Still Favors Sellers
The daily chart confirms a bearish structure for Plug Power stock. Price sits below the EMA20 at $2.20, the EMA50 at $2.49, and the EMA200 at $2.46. This is a classic bearish alignment.
RSI14 on the daily chart reads 40.66. That is below the neutral 50 line, confirming negative momentum. However, it is not deep into oversold territory. There is room for further downside before exhaustion signals would typically appear.
The MACD picture adds nuance. The MACD line sits at -0.15 while the signal line is at -0.19. The indicator remains in negative territory overall. However, the histogram has turned slightly positive at 0.03. This suggests bearish momentum may be losing some speed. Still, the broader trend has not reversed. Sellers remain in charge, but their grip looks marginally less firm.
Bollinger Bands on the daily chart add context. The mid-line sits at $2.15, with the upper band at $2.36 and the lower band at $1.93. Price closed near the middle of that range. This positioning reflects indecision rather than a strong directional push in either direction.
Average True Range14 stands at $0.13. That is a meaningful figure relative to a $2.10 stock. It represents roughly 6% of price in daily movement potential. Volatility therefore remains a real factor. The approaching earnings report adds to that risk.
Daily pivot levels place the pivot point right at $2.10. Resistance sits at $2.14 and support at $2.07. Price is essentially parked on the pivot itself. This underscores the lack of conviction in either direction right now.
1H Timeframe: Short-Term Stabilization, Longer-Term Warning
The hourly chart shows short-term stabilization but no reversal for Plug Power stock. Price hovers near $2.09, while the hourly EMA200 at $2.31 remains far above current levels.
The EMA20 at $2.10 and EMA50 at $2.09 overlap with price. This suggests a short-term consolidation phase. However, the EMA200 at $2.31 sits well above current levels. That gap confirms the larger downtrend remains intact. The shorter-term averages are merely flattening within it.
RSI14 on the 1H chart reads 48.89. That is almost dead center neutral. Meanwhile, MACD is similarly flat. The MACD line sits at 0.01 and the signal at 0.02, producing a histogram of -0.01. There is no clear momentum edge in either direction.
The 1H Bollinger Bands show a mid-line of $2.11. The upper band is at $2.20 and the lower band at $2.02. ATR14 registers just $0.04. Volatility has compressed noticeably on this timeframe. That kind of compression often precedes a more decisive move once a catalyst arrives.
15m Timeframe: Execution Context Only
The 15-minute chart offers no directional edge for Plug Power stock. Extreme compression across all indicators signals a market in a holding pattern, waiting for a trigger.
EMA20, EMA50, and EMA200 are all clustered near $2.09. Price closed at the same level. RSI14 at 48 confirms flat momentum. MACD readings are equally neutral. There is no short-term directional signal visible on this timeframe.
Bollinger Bands are noticeably tight. The upper band sits at $2.10 and the lower band at $2.06. ATR14 reads just $0.02. For traders, this timeframe serves only to time entries around the daily and hourly structure. It does not support a standalone view.
The Earnings Catalyst: August 10
The August 10 earnings report is the dominant near-term catalyst for Plug Power stock. Pre-earnings analysis suggests the company lacks factors typically associated with a beat.
Plug Power will announce its second-quarter 2026 results on August 10. The call is scheduled for 4:30 PM ET. That date now sits as the primary event risk for the stock. Recent commentary has flagged low beat probability. According to pre-earnings analysis, the combination of factors needed is simply not present.
This matters because the stock has already shown fragility. It slid to $2.05 on July 31, a -1.91% move on a day when the broader market rose. Such relative underperformance ahead of a headline event tends to keep volatility elevated. It also adds weight to the bearish daily bias already visible in the chart.
Bullish Scenario: What Would Need to Change
For a genuine bullish case to develop, Plug Power stock would need to reclaim the daily EMA20 at $2.20 with conviction. A brief spike above that level would not be enough to shift the outlook.
A push through the daily pivot resistance at $2.14 would be an early signal worth watching. Beyond that, MACD histogram expansion beyond the current 0.03 reading would help. It would support the idea that bearish momentum is genuinely fading rather than just pausing.
On the hourly chart, the more meaningful confirmation lies higher. Price would need a decisive break above the EMA200 at $2.31. Until that happens, any short-term stabilization near $2.09–$2.10 should be treated as a pause within a downtrend. Not a reversal.
Bearish Scenario: What Would Invalidate the Upside Case
The bearish case remains the default for Plug Power stock given the daily moving average structure. A break below $2.07 would confirm sellers are firmly back in control.
A subsequent drop below the Bollinger lower band at $1.93 would reinforce that signal. Similarly, losing the 1H support at $2.07 would suggest the hourly consolidation is resolving downward. Not building a base.
An earnings miss on August 10 could easily supply that catalyst. This would be consistent with pre-report expectations. Given ATR14 readings across timeframes, any post-earnings move is likely to be sharp rather than gradual.
Closing Thoughts
Overall, Plug Power stock sits in a technically bearish daily posture heading into earnings. The hourly chart shows only tentative stabilization rather than a true reversal signal.
The 15-minute chart offers no directional edge. Execution decisions therefore depend on how price behaves around the daily pivot at $2.10. The key support and resistance band sits between $2.07 and $2.14.
Volatility is set to rise heading into the August 10 earnings release. Positioning around this event carries real uncertainty in both directions. Meanwhile, the conflict between the daily downtrend and the hourly consolidation means traders should watch for a decisive break. Either above $2.14 resistance or below $2.07 support will clarify which side gains control once earnings are out.
FAQ
What is the current trend for Plug Power stock?
Plug Power stock is in a bearish daily trend. Price closed at $2.10 on August 5, below the EMA20 at $2.20, the EMA50 at $2.49, and the EMA200 at $2.46. The hourly chart shows short-term stabilization but no reversal signal.
When is Plug Power’s next earnings report?
Plug Power will report its second-quarter 2026 results on August 10. The earnings call is scheduled for 4:30 PM ET. Pre-report analysis suggests the company lacks factors typically associated with an earnings beat.
What are the key levels to watch for Plug Power stock?
The daily pivot sits at $2.10 with resistance at $2.14 and support at $2.07. The daily EMA20 at $2.20 marks the first major resistance level. On the downside, the Bollinger lower band at $1.93 represents the next significant support.
What would signal a bullish reversal for Plug Power stock?
A bullish case would require price to reclaim the daily EMA20 at $2.20 with conviction. A decisive break above the hourly EMA200 at $2.31 would provide more meaningful confirmation that the downtrend is genuinely reversing.
Disclaimer: This article is for informational purposes only and does not constitute financial advice, an investment recommendation, or a solicitation to buy or sell any financial instrument or cryptocurrency. The analysis provided is not indicative of future results. Investing in crypto assets and financial markets carries a high risk of capital loss. Always do your own research (DYOR) and consult a qualified financial advisor before making any decision.
Article produced with the assistance of artificial intelligence and reviewed by the editorial team.
