




Walmart Inc. stock is trading in a tense spot after an earnings beat and raised guidance failed to lift shares. Softer traffic and U.S. comparable sales growth left the daily structure unsettled rather than directional. That disconnect is now the chart’s central question.
Summary
Key takeaways
- Walmart Inc. stock closed at 114.30 after reversing from a 116.87 intraday high.
- Daily price sits below the 50-day EMA (114.94) and 200-day EMA (115.98), but above the 20-day EMA (113.58).
- The 1-hour chart shows a bearish MACD crossover and RSI14 at 43.86, confirming fading momentum.
- Daily support at 113.24 is the key level; a close below it opens the path toward 112.72.
- Bullish repair requires reclaiming the daily pivot at 115.05 and the 50-day EMA.
Daily Chart: Walmart Inc. Stock Holds Above Its 20-Day EMA
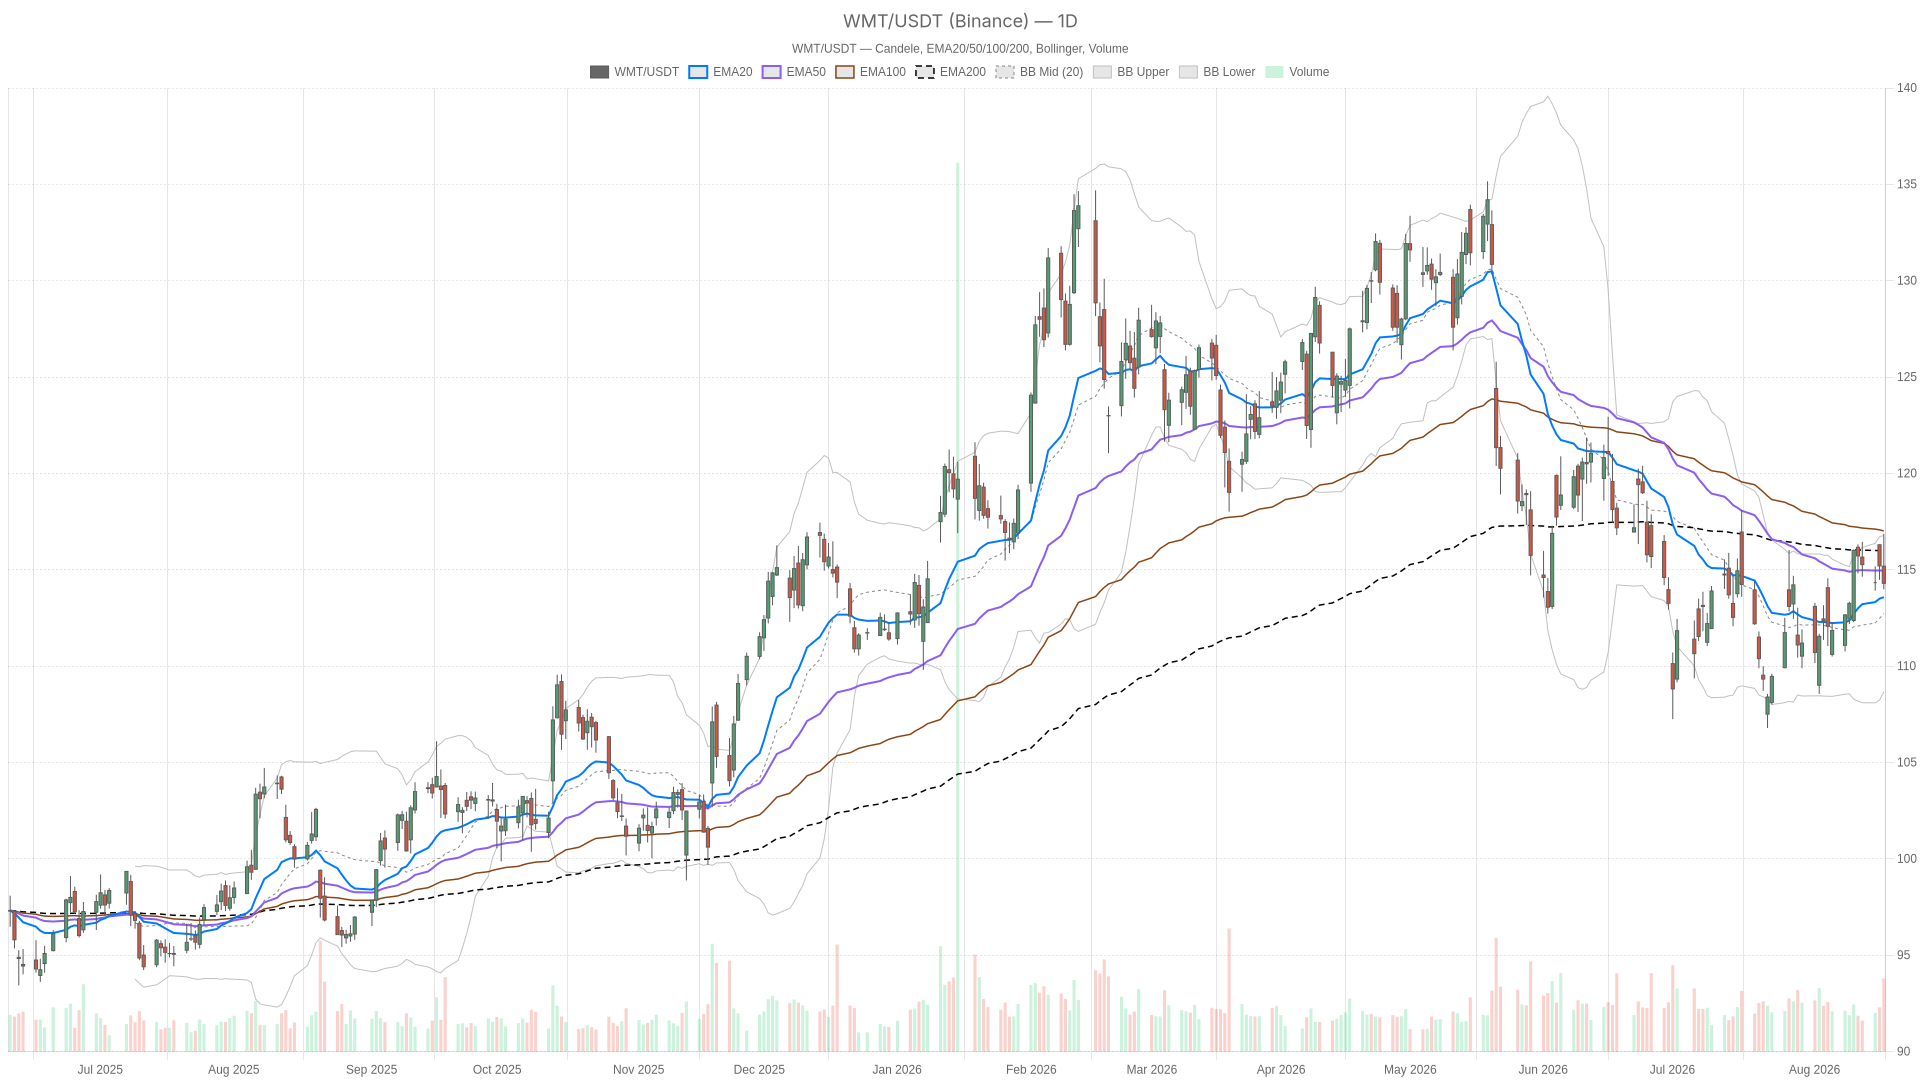
Walmart Inc. stock remains in a transitional setup on the daily chart. It has slipped below its medium- and long-term anchors but is still holding above its short-term one.
On the daily timeframe, Walmart closed at 114.30 after opening at 115.19 and trading as high as 116.87. Notably, that is a meaningful intraday reversal. Price sits below both the 50-day EMA (114.94) and the 200-day EMA (115.98). It still holds just above the 20-day EMA at 113.58. In practical terms, the stock has slipped below its medium- and long-term trend anchors, but it has not broken its short-term one. That is not a decisive bearish signal.
Momentum and Trend Anchors
The daily RSI14 sits at 52.37, which is essentially neutral. It shows momentum has not collapsed, but it is also offering no bullish conviction. Meanwhile, the daily MACD line at 0.33 sits above the signal at -0.13. That produces a positive histogram of 0.46. The configuration usually reflects improving momentum. However, it stands in tension with the price action. The stock closed well off its highs and below two key moving averages on the same day.
Volatility Context and Pivot Levels
Still, Bollinger Bands on the daily chart show the mid-line at 112.72, with the upper band at 116.78 and the lower band at 108.67. Price is trading above the mid-line, closer to the upper half of the range. That keeps the broader structure intact for now. The daily ATR14 reads 2.27. That is a reminder that this is not a low-volatility name, especially with an earnings reaction still working through the tape.
At the same time, pivot levels frame the near-term battle clearly: the pivot point sits at 115.05, resistance at R1 116.12, and support at S1 113.24. Reclaiming the pivot would be the first sign that buyers are stepping back in. Losing 113.24 would open the door to further downside testing.
1-Hour Chart Confirms a Weaker Short-Term Trend
The 1-hour timeframe, however, shows a more cautious picture for Walmart Inc. stock. Short-term momentum has rolled over, even though the broader intraday structure has not fully given way.
On this timeframe, price at 114.38 is trading below both the 20-period EMA (115.21) and the 50-period EMA (114.61). It still holds above the 200-period EMA at 113.43. That mixed EMA stack suggests the short-term trend has turned down while the broader intraday structure holds.
Momentum Rollover on the Hourly Chart
In contrast, the 1H RSI14 at 43.86 has dropped below the 50 midpoint, confirming that momentum has faded from recent highs. The MACD on this timeframe shows the line at 0.10 below the signal at 0.26. That produces a negative histogram of -0.16. It is a bearish MACD crossover, and it lines up with the RSI reading. In other words, the 1H timeframe is actively weakening the daily picture rather than confirming it.
The two timeframes therefore disagree. The daily chart still shows a mildly constructive MACD, while the hourly chart shows momentum rolling over. That conflict matters. It suggests the current move down is real and not just daily noise, even if the larger daily trend has not broken outright.
Intraday Range and Support
Meanwhile, the 1H Bollinger Bands show price near the lower half of the range, with the mid-line at 115.18 and the lower band at 113.75. Price sits close to that lower band. Combined with an ATR14 of 0.93, that points to a market pressing toward the downside boundary of its recent range. The 1H pivot at 114.33 with support at 114.03 gives traders a tight zone to watch for any stabilization attempt.
15-Minute Chart: Execution Context Only
The 15-minute chart points to stretched downside conditions. Short-term oversold readings suggest any bounce is more about positioning than a trend change.
On the 15-minute chart, RSI14 has dropped to 32.17, deep into oversold territory for this short-term window. The MACD line at -0.32 sits below the signal at -0.14, with a negative histogram of -0.18. That confirms short-term sellers have been in control into the most recent candles. Price is also hugging the lower Bollinger Band, with the lower boundary at 114.22 versus a mid-line of 115.43.
Still, this does not change the broader bias. It does suggest any short-term bounce attempts are more about oversold conditions than a change in trend. The 15m pivot at 114.31 with support at 114.05 mirrors the tight support zone already visible on the hourly chart. That reinforces the level as a near-term line in the sand.
Bullish Scenario for Walmart Inc. Stock
The bullish case for Walmart Inc. stock depends on quickly reclaiming lost ground. Buyers need to retake the daily pivot and the 50-day EMA.
A move back above the daily pivot at 115.05, and ideally through the 50-day EMA at 114.94, would start to repair the technical picture. If the daily MACD histogram continues to expand while price stabilizes above these levels, that would support a specific reading. The post-earnings drop would look more like a knee-jerk reaction to the sales growth miss than a structural shift. In that scenario, R1 at 116.12 and the upper Bollinger Band near 116.78 become realistic near-term targets.
The broader context matters too: Walmart raised its guidance even as it approaches a $1 trillion valuation milestone. A strong recovery would suggest the market weighs the raised outlook and margin story more heavily than the near-term sales growth softness.
Bearish Scenario for Walmart Inc. Stock
The bearish case for Walmart Inc. stock is straightforward. The key trigger is a daily close below 113.24.
On the other hand, a daily close below S1 at 113.24 would break the last visible support. That would open the way toward testing the daily Bollinger mid-line near 112.72. The lower band at 108.67 is a more distant reference point.
That kind of breakdown would also validate the weakness already showing on the 1H chart. There, the bearish MACD crossover and sub-50 RSI are already flagging fading momentum. Given the daily ATR14 of 2.27, moves of this size are well within normal range for the stock right now. So this is not an unrealistic scenario.
The bearish case is essentially the news backdrop playing out technically. The market is questioning whether a 41-times valuation is justified when comparable sales growth is missing expectations. That question stands even with an earnings beat and raised guidance on the table.
Overall, Walmart Inc. stock is caught between conflicting signals. The daily chart still shows some underlying resilience through its MACD reading. Yet price has slipped below both the 50-day and 200-day EMAs. Meanwhile, the 1H timeframe is actively confirming near-term weakness through a bearish MACD crossover and a sub-50 RSI. The 15-minute chart shows momentum stretched into oversold territory. Therefore, the immediate bias leans cautious rather than outright bearish, with 113.24 on the daily chart standing out as the key level that would tip the balance.
Given the elevated ATR readings across timeframes, volatility is likely to remain the dominant theme in the sessions ahead. The market is still digesting a mixed earnings reaction. Positioning should account for the possibility of sharp moves in either direction until the stock re-establishes a clearer trend.
FAQ
Why did Walmart Inc. stock fall after beating earnings?
Shares fell because traffic and U.S. comparable sales growth came in softer than Wall Street wanted, even though the company beat on earnings and raised its guidance. The market is weighing the sales growth miss against the stronger headline result.
What is the key support level for Walmart Inc. stock?
The key support is 113.24, which is the daily S1 level. A daily close below it would break the last visible support and open the way toward the daily Bollinger mid-line near 112.72.
What would signal a bullish recovery for Walmart Inc. stock?
A bullish recovery would require price to reclaim the daily pivot at 115.05 and ideally the 50-day EMA at 114.94. From there, R1 at 116.12 and the upper Bollinger Band near 116.78 become realistic near-term targets.
What do the hourly charts show for WMT?
The 1-hour chart shows a bearish MACD crossover and an RSI14 at 43.86 below the 50 midpoint. This confirms short-term momentum has faded, even though price remains above the 200-period EMA at 113.43.
Disclaimer: This article is for informational purposes only and does not constitute financial advice, an investment recommendation, or a solicitation to buy or sell any financial instrument or cryptocurrency. The analysis provided is not indicative of future results. Investing in crypto assets and financial markets carries a high risk of capital loss. Always do your own research (DYOR) and consult a qualified financial advisor before making any decision.
Article produced with the assistance of artificial intelligence and reviewed by the editorial team.
