




As of August 20, 2026, the XRP crypto market is running hot after a sharp push to $1.19. Every timeframe from daily to 15-minute is flashing overbought readings, while total crypto market capitalization sits near $2.45 trillion, up 7.29% in 24 hours.
Summary
Key takeaways
- XRP rallied to $1.19 on August 20, 2026, with the daily RSI at 72.39 in overbought territory.
- Total crypto market capitalization reached near $2.45 trillion, up 7.29% in 24 hours, according to CoinGecko.
- Bitcoin dominance sits at 58.7%, while XRP represents roughly 3% of the total crypto market cap.
- Price trades above the 20-day EMA at 1.05 and 50-day EMA at 1.08 but below the 200-day EMA at 1.34.
- Hourly RSI reached 82.44, and the 15-minute MACD histogram flattened to 0.00.
Daily Chart: The Macro Bias Behind the XRP Trend
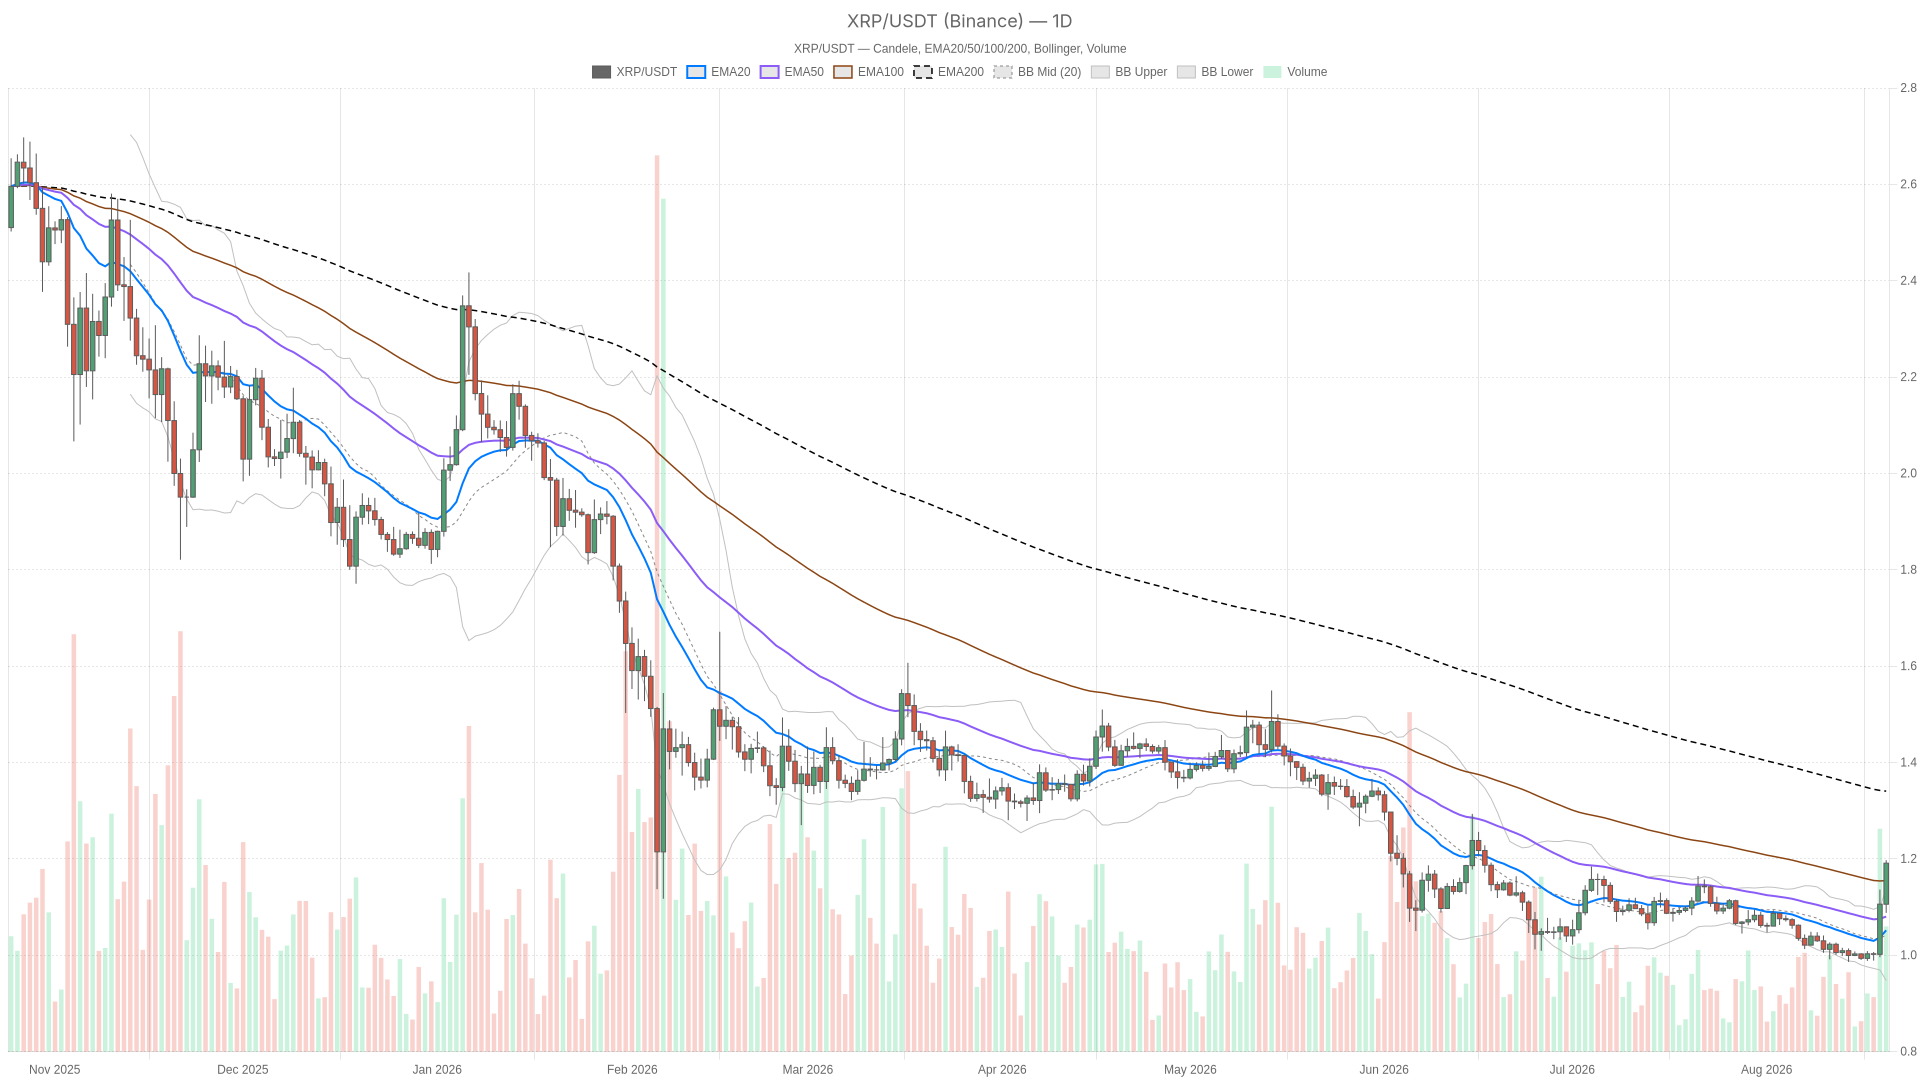
The daily chart still reads as neutral, not bullish, because the rally has not cleared the long-term trend structure. XRP closed at $1.19 with an RSI14 of 72.39, which places price firmly in overbought territory and usually precedes at least a pause, even in strong trends.
The MACD line sits at 0.00 against a signal line of -0.02, producing a modest positive histogram of 0.02. That marks a fresh, early-stage bullish cross rather than a confirmed one, so the daily momentum shift is real but still young.
The EMA structure deserves the most attention. Price is trading above both the 20-day EMA (1.05) and the 50-day EMA (1.08), which looks constructive on the surface. However, the 200-day EMA sits at 1.34, well above the current price.
That gap matters: XRP is still technically below its long-term average, so this rally is happening inside a broader corrective structure rather than confirming a fresh long-term uptrend. This is why the system classifies the daily regime as neutral rather than bullish. The short-term momentum is up, but the bigger picture has not flipped yet.
The Bollinger Bands reinforce the idea of an overheated near-term move. With the daily mid-band at 1.04 and the upper band at 1.14, a close at 1.19 means price is trading noticeably above its own upper band. That stretched condition often resolves through a sharp pullback toward the band or through sideways consolidation while the bands catch up.
Daily ATR14 of 0.04 confirms volatility has expanded meaningfully alongside the move. On the pivot framework, price has already cleared the daily pivot point at 1.16 and is pressing toward R1 at 1.23. Meanwhile, S1 sits at 1.12 as the first line of defense if momentum fades.
1-Hour Chart: Confirmation, But Momentum Is Thinning
The hourly chart remains unambiguously bullish in regime, and its EMA stack confirms that bias cleanly. The 20-EMA (1.12) sits above the 50-EMA (1.07), which sits above the 200-EMA (1.03) — a textbook bullish alignment.
However, the RSI14 here is at 82.44, an extreme reading that is hard to sustain for long without at least a cooling-off period. The MACD is positive (0.04 line vs 0.03 signal), but the histogram has narrowed to just 0.01. That suggests the thrust behind this move is losing a bit of steam even as price holds up.
The clearest warning sign on this timeframe is the Bollinger Band setup: the hourly close of 1.19 is sitting right at the upper band, also 1.19. Price is glued to the ceiling of its own volatility envelope. The pivot point is at 1.19, R1 at just 1.20, and S1 at 1.18. That is an unusually tight range with little room before either a breakout attempt or a rejection becomes obvious.
15-Minute Chart: Execution Context
The 15-minute chart holds a bullish regime, and the EMA stack (20 at 1.16, 50 at 1.13, 200 at 1.07) is properly aligned for continuation. RSI14 at 76.28 is still hot, though marginally less extreme than the hourly reading.
However, what stands out is the MACD histogram flattening out to 0.00. Momentum on this execution timeframe has essentially stalled even though price has not dropped. That kind of quiet deceleration often shows up just before a decision point, whether that decision resolves higher or lower.
Bullish Scenario
The bullish case holds as long as buyers can defend the hourly pivot near 1.19 and push decisively through the 1.20 level. If price breaks and holds above the daily Bollinger upper band at 1.14, then continues past 1.20, the short-term uptrend stays intact. That would put real pressure on sellers, especially with the broader market backdrop still constructive after the 7.29% 24-hour gain in total market cap.
Moreover, the path toward the daily R1 at 1.23 opens up if the 1.20 level breaks decisively. This scenario would break if price fails to hold above the daily pivot at 1.16 or slips back under the hourly EMA20 at 1.12. Either would signal the bounce is running out of fuel.
Bearish / Mean-Reversion Scenario
The case for a pullback is arguably just as strong right now. With daily RSI at 72.39, hourly RSI at 82.44, and price trading well above the daily upper Bollinger Band, XRP is overbought across essentially every relevant timeframe simultaneously. That condition historically invites mean reversion.
In addition, the flattening MACD histogram on the 15-minute chart and the thin 0.01 histogram make the momentum picture look tired, even if price has not cracked yet. A retracement toward the daily EMA20 at 1.05, or at least back to the pivot support at 1.12, would not be surprising. That move becomes more likely if buyers cannot sustain the current pace.
Moreover, it is worth remembering that the daily EMA200 sits up at 1.34. Spot price remains below that long-term average, so the primary trend by that measure has not technically turned bullish yet. That keeps a defensive read on the table.
This bearish and mean-reversion case would fail if price reclaims and holds above the daily EMA200 at 1.34. That would represent a genuine structural shift rather than a short-term bounce.
Positioning and Risk
The Fear & Greed Index reads 62, in “Greed” territory, which lines up with what the charts are showing. Sentiment has gotten ahead of itself just as XRP pushes into stretched technical conditions. That combination does not necessarily mean a reversal is imminent, but it does mean volatility risk is elevated in both directions.
Daily ATR14 at 0.04 versus hourly ATR14 at 0.02 shows how much the intraday range has compressed relative to the daily swing. That gap tends to close abruptly rather than gradually. For anyone tracking XRP crypto right now, the honest read is that the trend is up and the momentum is real.
Still, the multi-timeframe overbought stack and the daily price sitting below its own 200 EMA mean multiple angles are testing this rally at once. This is a market that rewards patience over conviction until one of these tensions resolves.
FAQ
Is XRP overbought on the daily chart?
Yes. The daily RSI14 sits at 72.39, which places XRP in overbought territory after the close at $1.19.
What is the key resistance level for XRP right now?
The immediate focus is the 1.20 level, with the daily R1 at 1.23 as the next target if buyers can push through.
Where could XRP pull back if momentum fades?
A retracement toward the daily EMA20 at 1.05, or at least back to the pivot support at 1.12, would not be surprising if buyers lose pace.
Disclaimer: This article is for informational purposes only and does not constitute financial advice, an investment recommendation, or a solicitation to buy or sell any financial instrument or cryptocurrency. The analysis provided is not indicative of future results. Investing in crypto assets and financial markets carries a high risk of capital loss. Always do your own research (DYOR) and consult a qualified financial advisor before making any decision.
Article produced with the assistance of artificial intelligence and reviewed by the editorial team.
