




As of August 19, 2026, the Bitcoin price is trading around $68,362. It sits near the top of a sharp multi-day advance that has reignited talk of a fresh leg higher. Total crypto market cap jumped 4.76% to $2.4 trillion, with BTC dominance holding at roughly 57%.
Summary
Key takeaways
- Bitcoin trades at $68,362 on August 19, 2026, with total crypto market cap up 4.76% to $2.4 trillion in 24 hours.
- Whales added $2.9 billion in BTC holdings over 60 days, Bloomberg reported on August 18.
- The Fear & Greed Index reads 46 (“Fear”), creating a notable disconnect with the ongoing price rally.
- Hourly RSI14 sits at 85.32, while daily RSI14 is at 70.99 — both firmly in overbought territory.
- Price remains below the 200-day EMA at $71,676, keeping the daily trend structurally unconfirmed.
What’s Actually Driving This Rally Right Now
Short-term momentum fueled by whale accumulation is colliding with an unfinished structural repair on the daily chart. The daily timeframe still shows Bitcoin trading below its 200-period EMA, the classic marker of a market that has not fully confirmed a trend reversal. Yet short-term momentum on the hourly and 15-minute charts is unambiguously strong. That is the core tension right now.
Bloomberg reported on August 18 that Bitcoin whales have ended a selling spree and added $2.9 billion in holdings over 60 days. That is a real structural tailwind if large holders are stepping back in. However, the Fear & Greed Index reads 46, classified as Fear — an odd pairing next to a market cap up nearly 5% in a day. Sentiment has not caught up to price yet, and that gap is exactly what technical analysts watch closely.
Daily Chart: Macro Bias Still Caught Between Trend and Structure
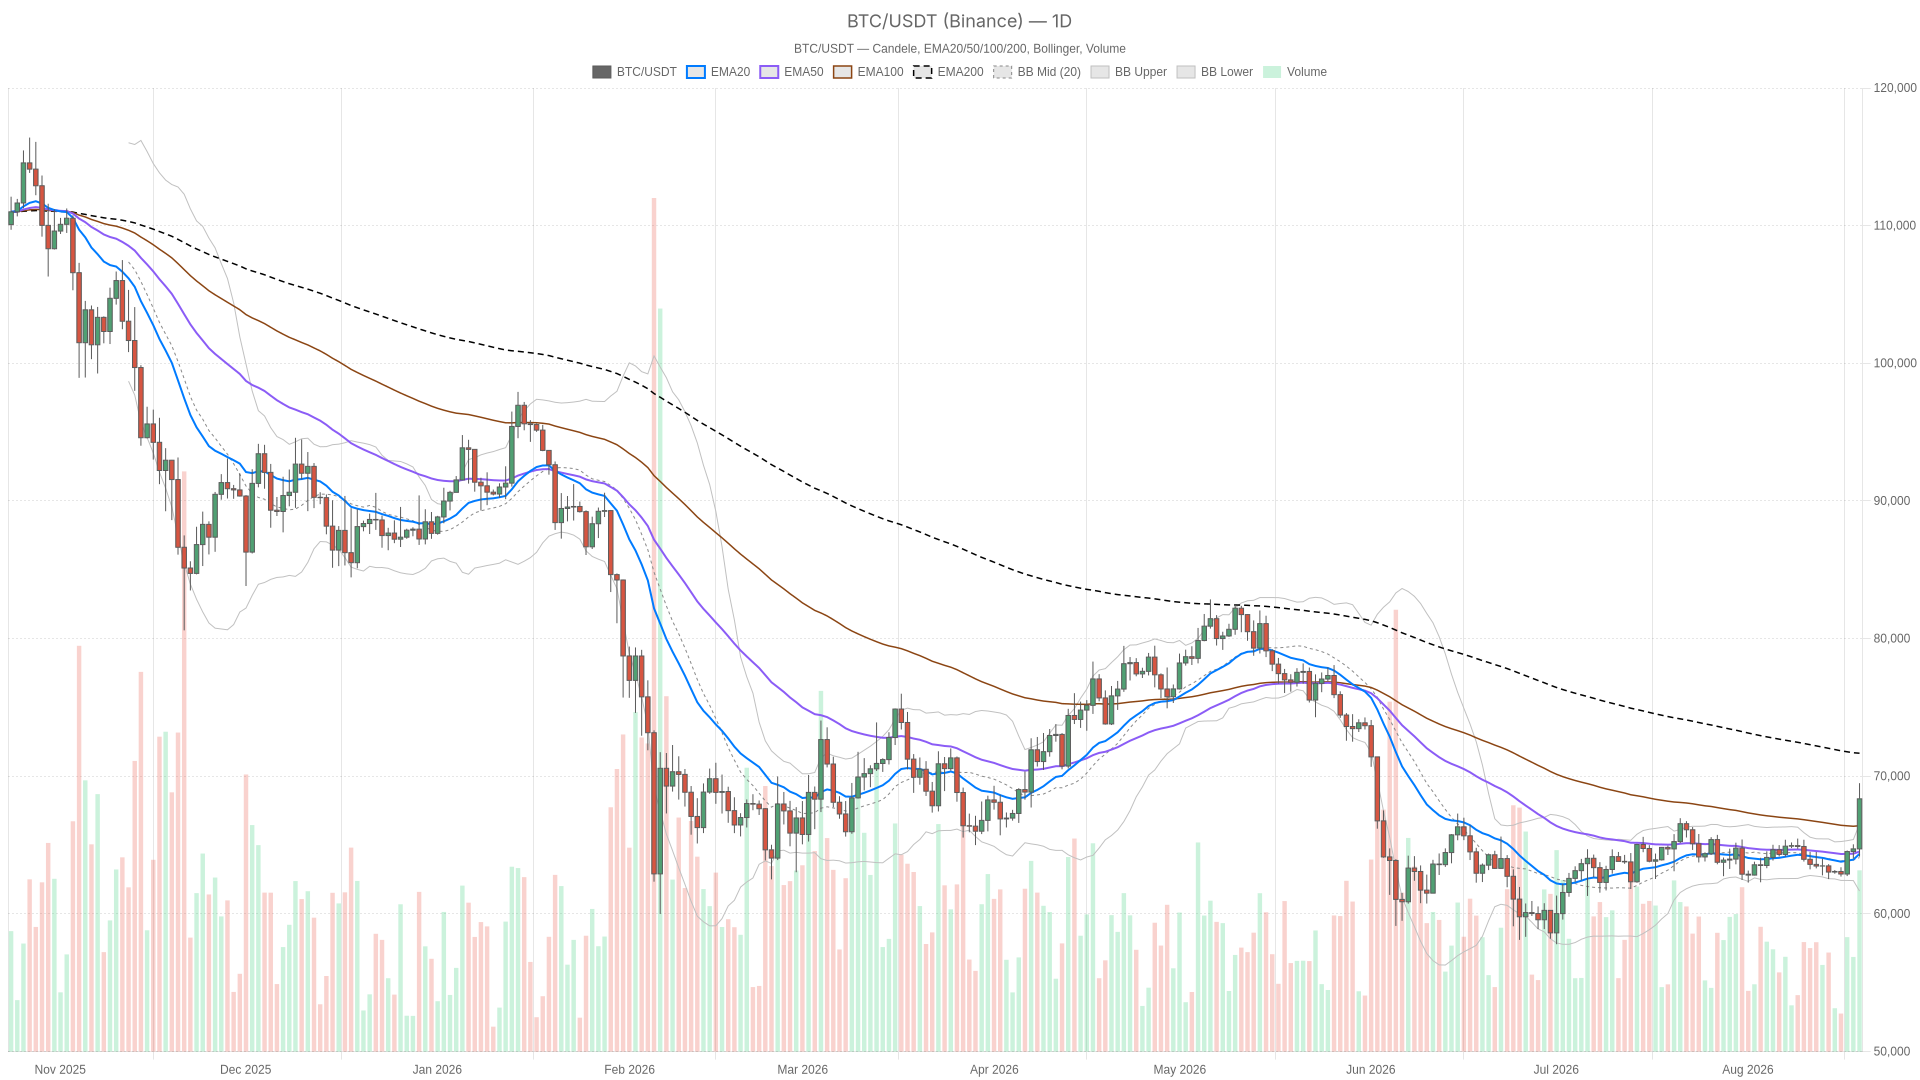
The daily chart shows a recovery that has not yet been confirmed, with price above short-term EMAs but still below the 200-day EMA. The daily close at $68,361.99 sits above both the 20-EMA ($64,367.74) and 50-EMA ($64,532.05), which is constructive for the short-to-medium trend. But it remains below the 200-EMA at $71,676.06, and that single fact is why the system still tags this daily regime as neutral rather than outright bullish.
RSI14 on the daily is at 70.99, comfortably in overbought territory. Meanwhile, MACD shows a positive histogram of 307.63 with the line at 295.48 crossing above a signal of -12.15. That is a fresh bullish crossover, not a tired one, which adds credibility to the move. The price is also trading above the daily Bollinger upper band ($66,522.61), a sign the market is stretched. ATR14 of 1,336.61 confirms daily ranges have expanded meaningfully. On the pivot grid, price is above the daily pivot ($67,342.66) and closing in on R1 at $70,519.33.
1-Hour Chart: Confirmation, With a Warning Attached
The hourly picture is fully aligned bullish — price above the 20, 50, and 200-EMA, all stacked in the right order ($65,884.11 / $64,952.26 / $64,094.67). That is textbook trend confirmation. However, RSI14 at 85.32 is extreme, the kind of reading that rarely holds for long without at least a pause or pullback.
MACD is strongly positive (941.25 line, 447.25 histogram), so the trend itself is not broken — it is just running hot. Price is pressing against the hourly Bollinger upper band at $68,481.42. The pivot structure shows the market trading between the pivot ($68,254.42) and R1 ($68,466.84), a tight and high-stakes zone for the next few hours.
15-Minute Chart: Execution Context Shows Early Fatigue
The 15-minute chart delivers the first crack in the momentum story. M15 EMAs remain bullish-aligned ($67,543.07 / $66,310.48 / $64,882.54), and RSI14 is still elevated at 74.82. Yet the MACD histogram has flipped negative at -67.91, even though price has not dropped meaningfully. That is a subtle divergence — momentum decelerating while price holds near highs. It typically signals that a short-term pullback or consolidation is due before the next directional decision, rather than confirming the move is over.
Bullish Scenario
A breakout above $70,519.33 would put Bitcoin on track to test the 200-day EMA and potentially confirm a trend reversal. If Bitcoin price clears the daily R1 at $70,519.33, the next target would be the 200-day EMA near $71,676.06. Clearing that level would convert this from a stretched bounce into a confirmed trend reversal. Whale accumulation reported by Bloomberg gives this scenario structural backing. This case would be invalidated if price loses the daily pivot at $67,342.66. A breakdown below the daily 50-EMA at $64,532.05 would put the whole recovery thesis back in question.
Bearish / Mean-Reversion Scenario
Given how stretched RSI is on the hourly chart and the early MACD fatigue already showing on the 15-minute chart, a pullback remains a realistic possibility even inside an otherwise healthy uptrend. Price could drift toward the hourly pivot support at $68,145.58, or deeper toward the daily S1 at $65,185.33. This scenario gets invalidated if price reclaims and holds above the daily R1 at $70,519.33. That would confirm buyers are strong enough to absorb the overbought reading without a real correction.
Positioning, Risk, and What to Watch
Daily ATR sitting at 1,336.61 and hourly ATR at 581.15 both point to a market where ranges have widened. Whatever happens next is likely to happen with size, not a slow grind. The disconnect between price strength and a Fear & Greed reading of 46 is worth sitting with. Sentiment may be lagging and about to flip toward greed as the rally continues. Alternatively, it may be flagging that this move is more fragile than the chart alone suggests.
Broader on-chain activity backs the risk-on read for now. DEX fee data shows Uniswap V3 volumes up 146% in 24 hours and Curve DEX fees rising 128%. Both are consistent with a market that is genuinely more active. None of this removes the core tension on the charts. A bullish hourly and 15-minute structure sits on top of a daily trend that has not yet cleared its own 200-EMA. That is the kind of setup that rewards patience over conviction until one of the two timeframes gives way.
FAQ
Why is Bitcoin’s price rising right now?
The rally is being driven by a combination of short-term momentum and structural accumulation. Bloomberg reported on August 18 that whales added $2.9 billion in BTC holdings over 60 days, providing a genuine tailwind. Meanwhile, total crypto market cap surged 4.76% in 24 hours. On-chain activity on Uniswap and Curve confirms the market is broadly more active, not just BTC moving in isolation.
Is Bitcoin overbought at current levels?
Yes, by multiple measures. The hourly RSI14 reads 85.32, while the daily RSI14 sits at 70.99 — both in overbought territory. The price is also trading above the daily Bollinger upper band, which signals the market is stretched. However, overbought conditions in a strong trend can persist longer than expected. The MACD on the daily chart shows a fresh bullish crossover, not a tired one.
What is the key level Bitcoin needs to break?
The 200-day EMA at $71,676.06 is the most important structural level. A close above it would go a long way toward confirming a trend reversal from the current neutral daily regime. Before that, the daily R1 at $70,519.33 serves as a nearer-term resistance that needs to be cleared first.
Could Bitcoin pull back sharply from here?
A pullback is a realistic possibility given the extreme hourly RSI and the negative MACD histogram already showing on the 15-minute chart. Initial support sits at the hourly pivot near $68,145.58, with deeper support at the daily S1 of $65,185.33. A break below the daily 50-EMA at $64,532.05 would put the entire recovery thesis back in question.
Disclaimer: This article is for informational purposes only and does not constitute financial advice, an investment recommendation, or a solicitation to buy or sell any financial instrument or cryptocurrency. The analysis provided is not indicative of future results. Investing in crypto assets and financial markets carries a high risk of capital loss. Always do your own research (DYOR) and consult a qualified financial advisor before making any decision.
Article produced with the assistance of artificial intelligence and reviewed by the editorial team.
