




Pinterest stock hit an uncomfortable crossroads on August 4. Shares rallied to $25.58, stretching the chart across every timeframe. Then after-hours brought a 7% drop as weak Q3 guidance clashed with an otherwise strong Q2 earnings beat.
Summary
Key takeaways
- Pinterest stock closed at $25.58 on August 4, above its daily Bollinger upper band at $25.14
- RSI14 reached 70.68 on the daily chart, firmly overbought before earnings
- After-hours trading saw a 7% drop following weak Q3 revenue guidance
- Q2 earnings beat Wall Street expectations, but the Q3 outlook disappointed
- Daily ATR at 0.91 already flagged elevated volatility ahead of the known catalyst
Daily Timeframe: Bullish Structure Stretched to Extremes
The daily chart painted a firmly bullish picture heading into earnings — but also one stretched to unsustainable extremes.
Moving Average Stack Confirms Uptrend
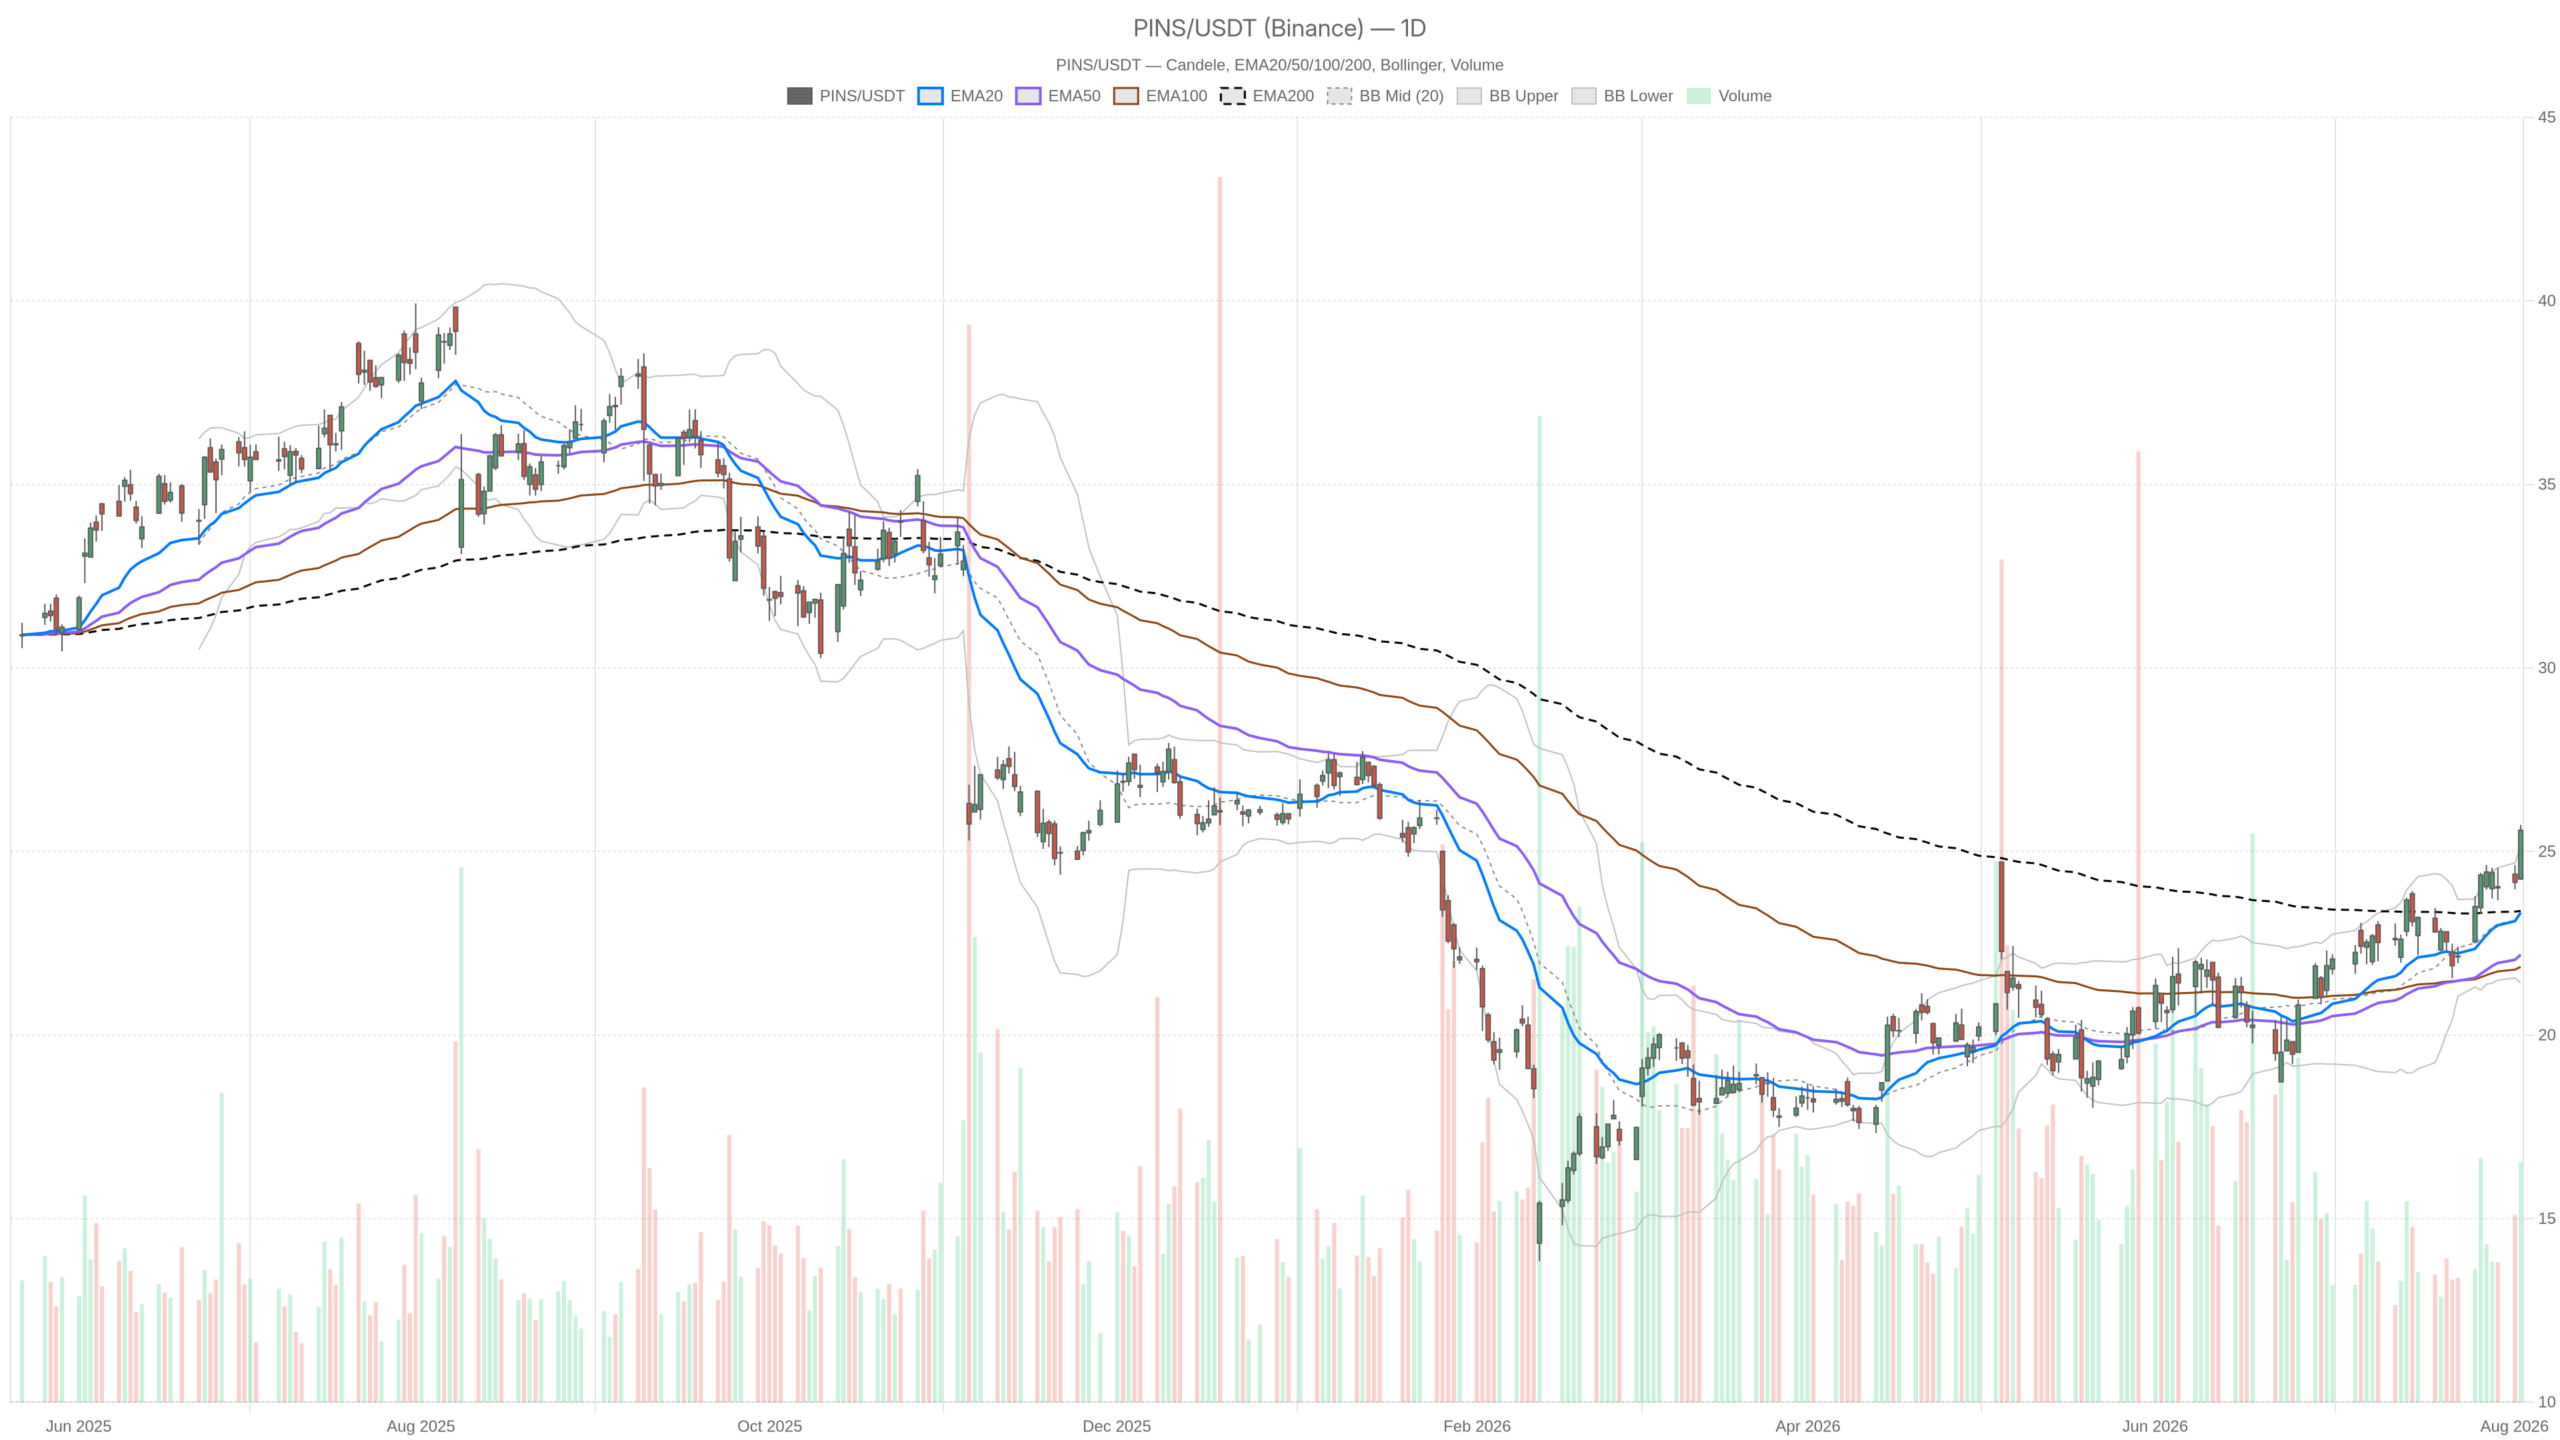
Price reached a high of $25.73 before settling at $25.58. That close sat comfortably above the 20-day EMA at $23.34, the 50-day EMA at $22.19, and the 200-day EMA at $23.38. Short-term averages stacking above longer-term ones reflects a market in bullish trend mode. However, the rally also pushed the close above the daily Bollinger upper band at $25.14. An overshoot this decisive typically signals a market running ahead of itself. It becomes vulnerable to at least a short-term pullback.
Overbought Momentum Signals Caution
RSI14 on the daily chart sits at 70.68, firmly in overbought territory. MACD remains positive, with the line at 0.82 above the signal at 0.67. The histogram of 0.16 confirms momentum was still technically intact into the close. Meanwhile, the daily pivot structure shows price closing between the pivot point at $25.18 and R1 at $26.13. Bulls were testing resistance rather than breaking cleanly through. ATR14 at 0.91 already pointed to elevated volatility ahead of a known catalyst.
1H Confirmation: Trend Intact, Momentum Cooling
The hourly chart confirmed the daily bullish bias while showing momentum was not accelerating.
Price Parked at a Decision Point
EMA20 at $24.80 sits above EMA50 at $24.21, which in turn sits above EMA200 at $22.89. This clean bullish alignment leads the system to label the regime outright bullish. RSI14 at 70.58 mirrors the daily overbought reading almost exactly. MACD stays positive, with the line at 0.43 above the 0.30 signal.
However, the histogram of 0.13 suggests the push higher was not accelerating aggressively. Notably, price closed almost exactly on the hourly pivot at $25.60. The Bollinger upper band remained untouched at $25.91. The hourly chart confirms the trend. Yet it shows Pinterest stock parked at a decision point rather than breaking away cleanly.
15m Execution: Signs of Exhaustion Before the Guidance Shock
On the 15-minute chart, cracks were already visible before the earnings reaction hit the tape.
Tight Range Signals Classic Exhaustion
RSI cooled to 64.91, a step down from the stretched readings on higher timeframes. More telling, the MACD line at 0.23 dipped below its signal at 0.26. This produced a negative histogram of -0.03 — a subtle bearish crossover on the shortest actionable timeframe. Price hugged the upper Bollinger band at $25.74 inside an unusually tight range of $25.30 to $25.74. ATR14 compressed to just 0.13.
Taken together, that is a classic exhaustion pattern. Buyers ran low on conviction right into the close, just before the after-hours guidance shock arrived. This exhaustion set the stage for the sharp reaction that hit Pinterest stock after the closing bell.
Bullish Scenario for Pinterest Stock
The bullish case for Pinterest stock does not collapse just because of one disappointing guidance headline.
The underlying structure into earnings was strong across daily and hourly timeframes. Q2 numbers themselves actually beat expectations. If sellers fail to push shares below the daily pivot zone, the broader uptrend stays technically intact. That zone spans from $24.63 (S1) to $25.18 (pivot). Price must also stabilize above the daily EMA20 at $23.34. The uptrend is further anchored by EMA50 at $22.19 and EMA200 at $23.38.
A recovery back toward the prior close near $25.58 would suggest something important. The market would be treating the weak Q3 outlook as a short-term overreaction rather than a trend-changing event. This distinction matters for positioning in Pinterest stock over the coming sessions.
Bearish Scenario and Invalidation Levels
A 7% after-hours drop is not a small move. The technical setup makes a deeper pullback plausible.
RSI was already stretched above 70 on both daily and hourly timeframes before the drop. Therefore, a mean-reversion move is not surprising from a technical standpoint. A daily close below the EMA20 at $23.34 or below pivot support S1 at $24.63 would invalidate the near-term bullish structure.
In that scenario, the daily Bollinger mid-band at $23.28 and the 50-day EMA at $22.19 become the next logical zones. Sellers would need to be absorbed there for the broader trend to survive. The 7% after-hours move in Pinterest stock suggests these levels may be tested sooner rather than later.
Closing Take: Positioning Amid Rising Volatility
Pinterest stock now trades at a crossroads between technical exhaustion and fundamental disappointment.
The daily ATR of 0.91 already signaled elevated volatility even before the earnings reaction. The reported 7% after-hours drop suggests the next session could open with a gap. That gap would redefine the near-term range entirely. Therefore, until price finds a new equilibrium around the existing pivot and moving-average framework, expect choppy, headline-driven action. A clean continuation of the prior uptrend seems unlikely in the immediate term.
Given the mixed signals across timeframes, caution around sizing and timing seems warranted. The daily and hourly charts remain technically bullish but overbought. Meanwhile, the 15-minute chart was already showing fatigue. These conflicting signals in Pinterest stock argue for patience in the sessions ahead.
FAQ
Why did Pinterest stock drop after earnings?
Pinterest stock fell 7% in after-hours trading on August 4 despite beating Q2 earnings estimates. The drop was driven by disappointing Q3 revenue guidance, which overshadowed the strong second-quarter results.
Is Pinterest stock technically overbought?
Yes. RSI14 reached 70.68 on the daily chart and 70.58 on the hourly chart before the earnings release. Price also closed above the daily Bollinger upper band at $25.14, signaling an overextended rally.
What are the key support levels for Pinterest stock?
The critical support zone lies between the daily pivot S1 at $24.63 and the pivot point at $25.18. Below that, the daily EMA20 at $23.34, the Bollinger mid-band at $23.28, and the 50-day EMA at $22.19 serve as deeper support levels.
Does the bullish trend in Pinterest stock remain intact?
The broader uptrend remains structurally intact as long as price holds above the daily EMA20 at $23.34 and the 50-day EMA at $22.19. However, a daily close below these levels would invalidate the near-term bullish structure.
Disclaimer: This article is for informational purposes only and does not constitute financial advice, an investment recommendation, or a solicitation to buy or sell any financial instrument or cryptocurrency. The analysis provided is not indicative of future results. Investing in crypto assets and financial markets carries a high risk of capital loss. Always do your own research (DYOR) and consult a qualified financial advisor before making any decision.
Article produced with the assistance of artificial intelligence and reviewed by the editorial team.
