




Summary
Circle Stock Faces Mounting Pressure on Multiple Fronts
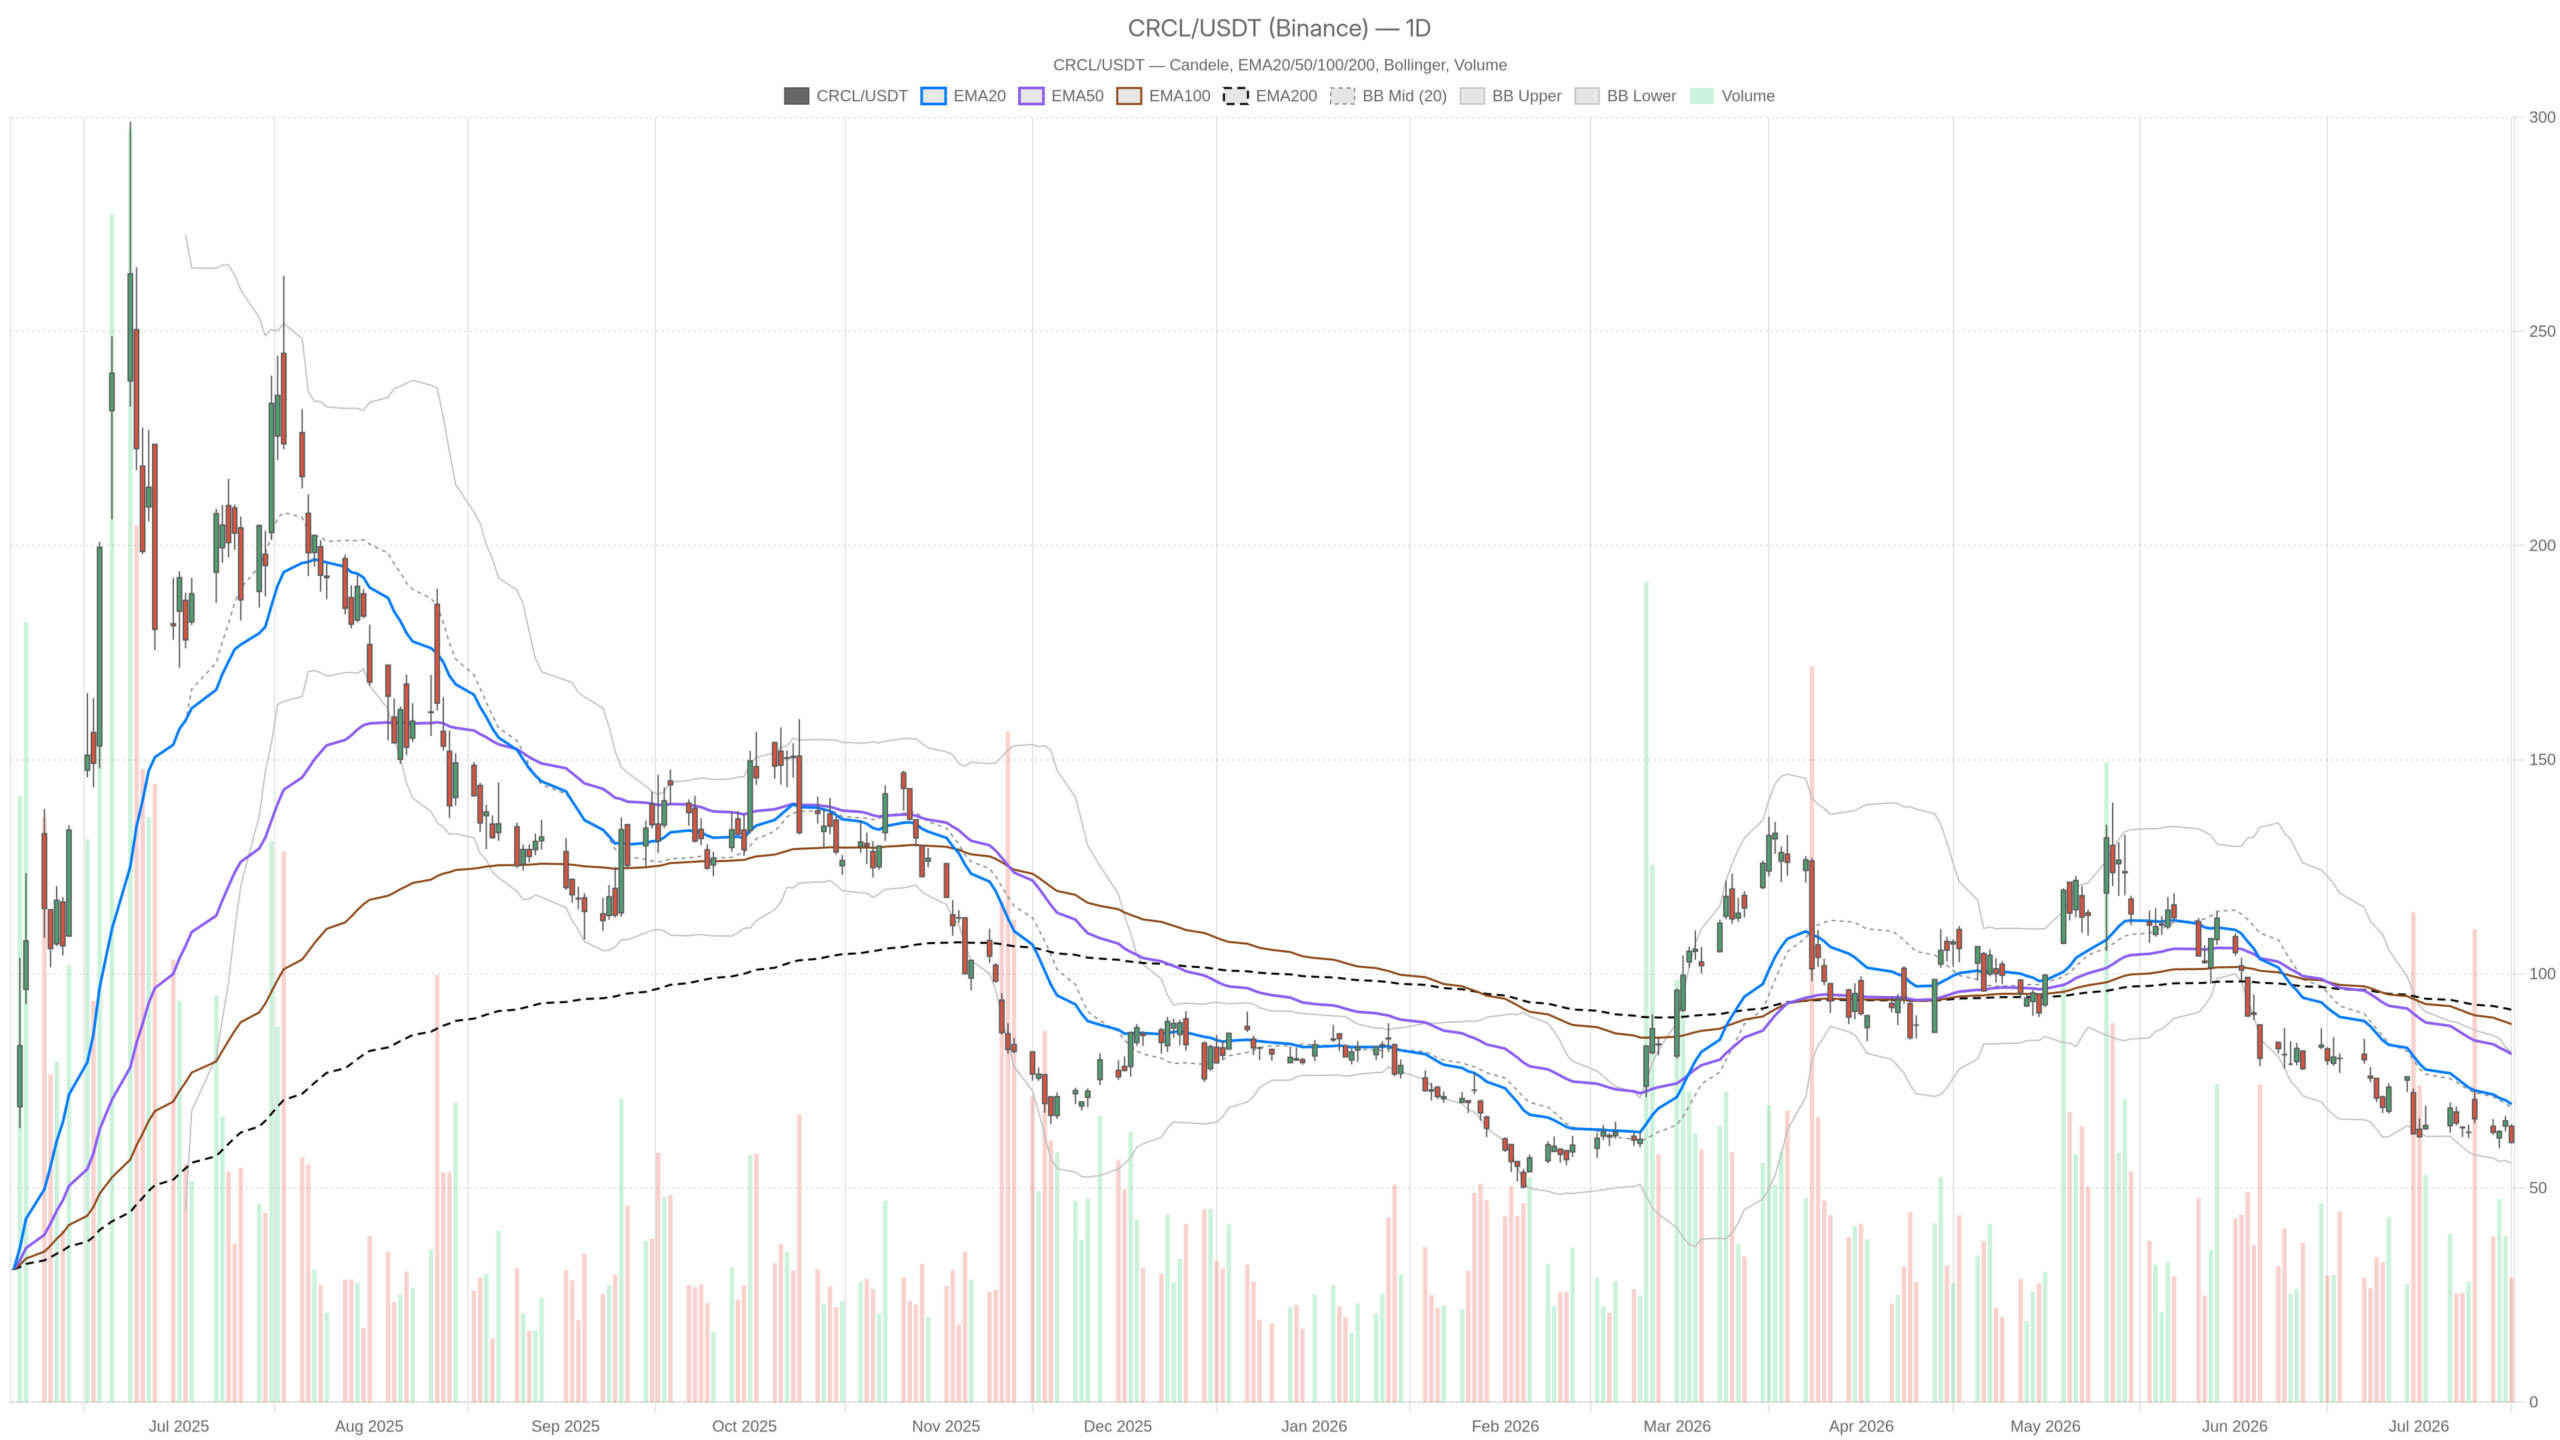
Circle Stock faces mounting technical and fundamental pressure. CRCL closed at $60.64 on July 16, beneath all key moving averages. The bearish regime spans daily, hourly, and intraday timeframes. Visa’s Open USD platform now adds fresh competitive uncertainty to the mix.
Key takeaways
- Circle Stock (CRCL) closed at $60.64 on July 16, significantly below its EMA20 ($69.57), EMA50 ($81.27), and EMA200 ($91.63).
- The daily RSI sits at 35.88, just above oversold territory, while the MACD histogram shows a slight positive turn at +0.67.
- Visa’s Open USD stablecoin platform introduces a major competitive threat to Circle’s USDC franchise within the $300 billion stablecoin industry.
- Mizuho downgraded CRCL to Underperform on July 14, citing growing competitive pressures as a drag on long-term revenue.
- William Blair maintains a constructive view, arguing CRCL has “outsized” Bitcoin recovery leverage and that existing risks are already priced in.
Daily Timeframe: The Dominant Bearish Bias
The daily chart defines the primary market structure, and the message is clear. CRCL is trading at $60.64, significantly below its EMA20 at $69.57, EMA50 at $81.27, and EMA200 at $91.63. That full stack of declining exponential averages above price is a textbook downtrend configuration. There is no ambiguity here — sellers control every meaningful structural level.
The daily RSI sits at 35.88, hovering just above oversold territory. That proximity to 30 does not automatically signal a reversal. In persistent downtrends, RSI can remain suppressed for extended periods. Meanwhile, the MACD line stands at -6.91 against a signal of -7.58, with a histogram reading of +0.67. The histogram turning slightly positive is a small flicker of momentum improvement, but it operates within deeply negative territory. It hints at a deceleration of selling pressure — not a reversal of it.
Still, Bollinger Bands on the daily frame place the midline at $68.73, the upper band at $81.69, and the lower band at $55.77. Price is pressing toward the lower half of the range. The ATR of 5.77 underlines that daily swings remain wide. This is a volatile stock where moves of several dollars in either direction are normal. Daily pivot support sits at $59.03 (S1), with the pivot point itself at $61.97 and resistance at $63.57 (R1).
Hourly Structure Confirms the Weakness
The 1H timeframe does not complicate the daily thesis — it reinforces it. CRCL is trading at $60.67 on the hourly chart. It sits below the EMA20 at $63.09, EMA50 at $64.20, and EMA200 at $74.89. All three intraday averages slope downward and sit above price. Hourly RSI reads 37.18 — weak, but not yet technically oversold enough to trigger mean-reversion buying in isolation.
On the hourly MACD, the line has moved to -0.69 against a signal of -0.34, with the histogram at -0.35 and widening. That divergence from the daily MACD histogram — which is slightly improving — creates a minor conflict worth noting. On the daily, momentum deterioration is slowing. On the hourly, it is still accelerating to the downside. In practice, this suggests the intraday trend remains weak even if the daily is beginning to stabilize at the edges.
Hourly Bollinger Bands show price near the lower band at $60.31. This proximity is consistent with short-term oversold conditions on the hourly. However, the lower band has been compressing. This indicates sustained directional pressure rather than a sharp spike requiring mean reversion. Hourly pivot levels show tight structure. Support sits at $60.23, pivot at $60.81, and resistance at $61.25. This narrow range reflects the stock consolidating near its recent lows.
15-Minute Chart: Execution Context Near Lows
The 15-minute frame tells a story of compression near session lows. Price trades at $60.67, beneath EMA20 ($61.91), EMA50 ($62.78), and EMA200 ($63.86). RSI on the 15-minute has dropped to 33.33, the weakest reading across all three timeframes. The MACD histogram on the 15-minute is -0.06 — marginally negative but essentially flat. This suggests the micro-trend selling impulse is beginning to exhaust itself at current levels.
Meanwhile, ATR at the 15-minute level is 0.52, meaning average intraday micro-swings are contained. The 15-minute Bollinger midline sits at $61.82, with price pressed against the lower band at $60.78. Intraday pivot support is $60.34. This level is now the immediate line in the sand on the short-term chart. A sustained break below it would likely accelerate the move toward the daily lower Bollinger Band near $55.77.
The Fundamental Catalyst: Visa’s Open USD Challenge
Technical weakness alone rarely drives sustained trends in crypto-adjacent equities. The news flow around Circle reinforces the selling. Visa’s launch of the Open USD stablecoin platform introduces a heavyweight competitor into the $300 billion stablecoin industry. Visa’s platform allows banks, fintechs, and crypto firms to issue, store, transfer, and redeem stablecoins through managed infrastructure. This directly overlaps with Circle’s USDC franchise.
On July 14, Mizuho downgraded CRCL to Underperform, citing growing competitive pressures as a potential drag on long-term revenue. That downgrade landed before the Visa announcement. The market is now absorbing two back-to-back negative signals on the competitive front. At the same time, Circle secured final OCC banking approval from the U.S. Office of the Comptroller of the Currency on July 10. This establishes a national banking presence. However, this regulatory win has been largely overshadowed by the competitive noise.
Notably, William Blair took a more constructive view on July 15. The firm argued that CRCL has “outsized” Bitcoin recovery leverage. It also noted that existing risks are already reflected in market expectations. That perspective is important context for the bullish scenario, though it has not been enough to arrest the selling so far.
Bullish Scenario: What Would Need to Change
A genuine recovery in Circle Stock would require more than a technical bounce. The daily MACD histogram turning positive is a necessary but insufficient condition. Bulls would need to see price reclaim the daily pivot at $61.97 and then challenge resistance at $63.57 on a sustained basis. A close above the EMA20 at $69.57 would be a meaningful structural shift — but that target is roughly 15% away from current price.
On the fundamental side, clarity about Open USD’s limited competitive threat could reinvigorate buying interest. Similarly, confirmation that Circle’s OCC banking approval provides a durable moat would help. If Bitcoin prices strengthen materially, the leverage argument made by William Blair could attract capital back into CRCL. The RSI at 35.88 on the daily does leave room for a technical rebound without entering overbought territory.
Bearish Scenario: What Would Accelerate the Decline
In contrast, a break below the daily S1 pivot at $59.03 would put the lower Bollinger Band at $55.77 squarely in view. At that level, CRCL would be down roughly 8% from current prices. Given the ATR of 5.77, a single volatile session could cover that distance. The 15-minute chart’s proximity to its own support at $60.34 suggests this scenario could develop quickly if intraday demand fails.
A continuation of analyst downgrades — particularly if more firms follow Mizuho’s lead — would compound the technical selling with fundamental re-rating pressure. The Visa story is still developing, and further details about Open USD’s scale or adoption could deliver additional negative catalysts. The full EMA stack alignment leaves very little structural resistance on the downside. EMA20, EMA50, and EMA200 all sit above price on the daily chart. Bears have little to fight through.
Positioning and Volatility Outlook
Overall, the weight of evidence here favors the bears for Circle Stock. The daily regime is bearish. The hourly confirms it. The 15-minute shows price grinding at its lows, with momentum nearly exhausted but not yet reversed.
The slight MACD histogram improvement on the daily is worth watching. It is the one technical detail that could precede a short-term stabilization. However, it does not change the primary bias until price structure improves meaningfully.
With a daily ATR near $5.77, CRCL remains a high-volatility, high-uncertainty name. The fundamental picture remains unsettled by Visa’s competitive entry. Traders should respect the current technical regime. They should stay alert to developments in the Open USD rollout. Further analyst commentary could shift the narrative quickly.
FAQ
What is Circle Stock’s current price and technical posture?
CRCL closed at $60.64 on July 16, trading below all major moving averages — EMA20 ($69.57), EMA50 ($81.27), and EMA200 ($91.63). The daily RSI sits at 35.88, confirming a firmly bearish regime across all timeframes.
Why did Mizuho downgrade CRCL?
Mizuho downgraded CRCL to Underperform on July 14, citing growing competitive pressures that could weigh on long-term revenue. The downgrade landed just before Visa’s Open USD announcement, compounding negative sentiment.
What is the main competitive threat to Circle Stock?
Visa’s launch of the Open USD stablecoin platform poses the primary competitive threat. The platform allows banks, fintechs, and crypto firms to issue, store, transfer, and redeem stablecoins through managed infrastructure, directly overlapping with Circle’s USDC franchise.
Is there any bullish case for CRCL?
Yes. William Blair argued on July 15 that CRCL has “outsized” Bitcoin recovery leverage and that existing risks are already reflected in market expectations. Additionally, Circle’s OCC banking approval from July 10 provides a regulatory moat that could differentiate the company over the long term.
Disclaimer: This article is for informational purposes only and does not constitute financial advice, an investment recommendation, or a solicitation to buy or sell any financial instrument or cryptocurrency. The analysis provided is not indicative of future results. Investing in crypto assets and financial markets carries a high risk of capital loss. Always do your own research (DYOR) and consult a qualified financial advisor before making any decision.
Article produced with the assistance of artificial intelligence and reviewed by the editorial team.
