




UNI trades at $3.68 with the daily RSI at 75.55, a level that demands caution. The UNI/USDT Analysis: Daily RSI at 75 Flashes Caution as Price Hugs the Upper Band captures the tension between bullish momentum and overbought risk. With Fear & Greed at 26, the setup is precarious.
Summary
Key takeaways
- UNI/USDT trades at $3.68, sitting above the daily upper Bollinger Band at $3.66
- Daily RSI at 75.55 signals overbought conditions historically linked to sharp reversals
- Uniswap V3 fees surged +330% over 30 days, providing genuine fundamental support
- Fear & Greed Index at 26 and BTC dominance at 56.24% create a risk-off macro backdrop
- A break above $3.72 or below $3.60 will likely determine the next directional move
Market Poised at the Edge — UNI/USDT in Focus
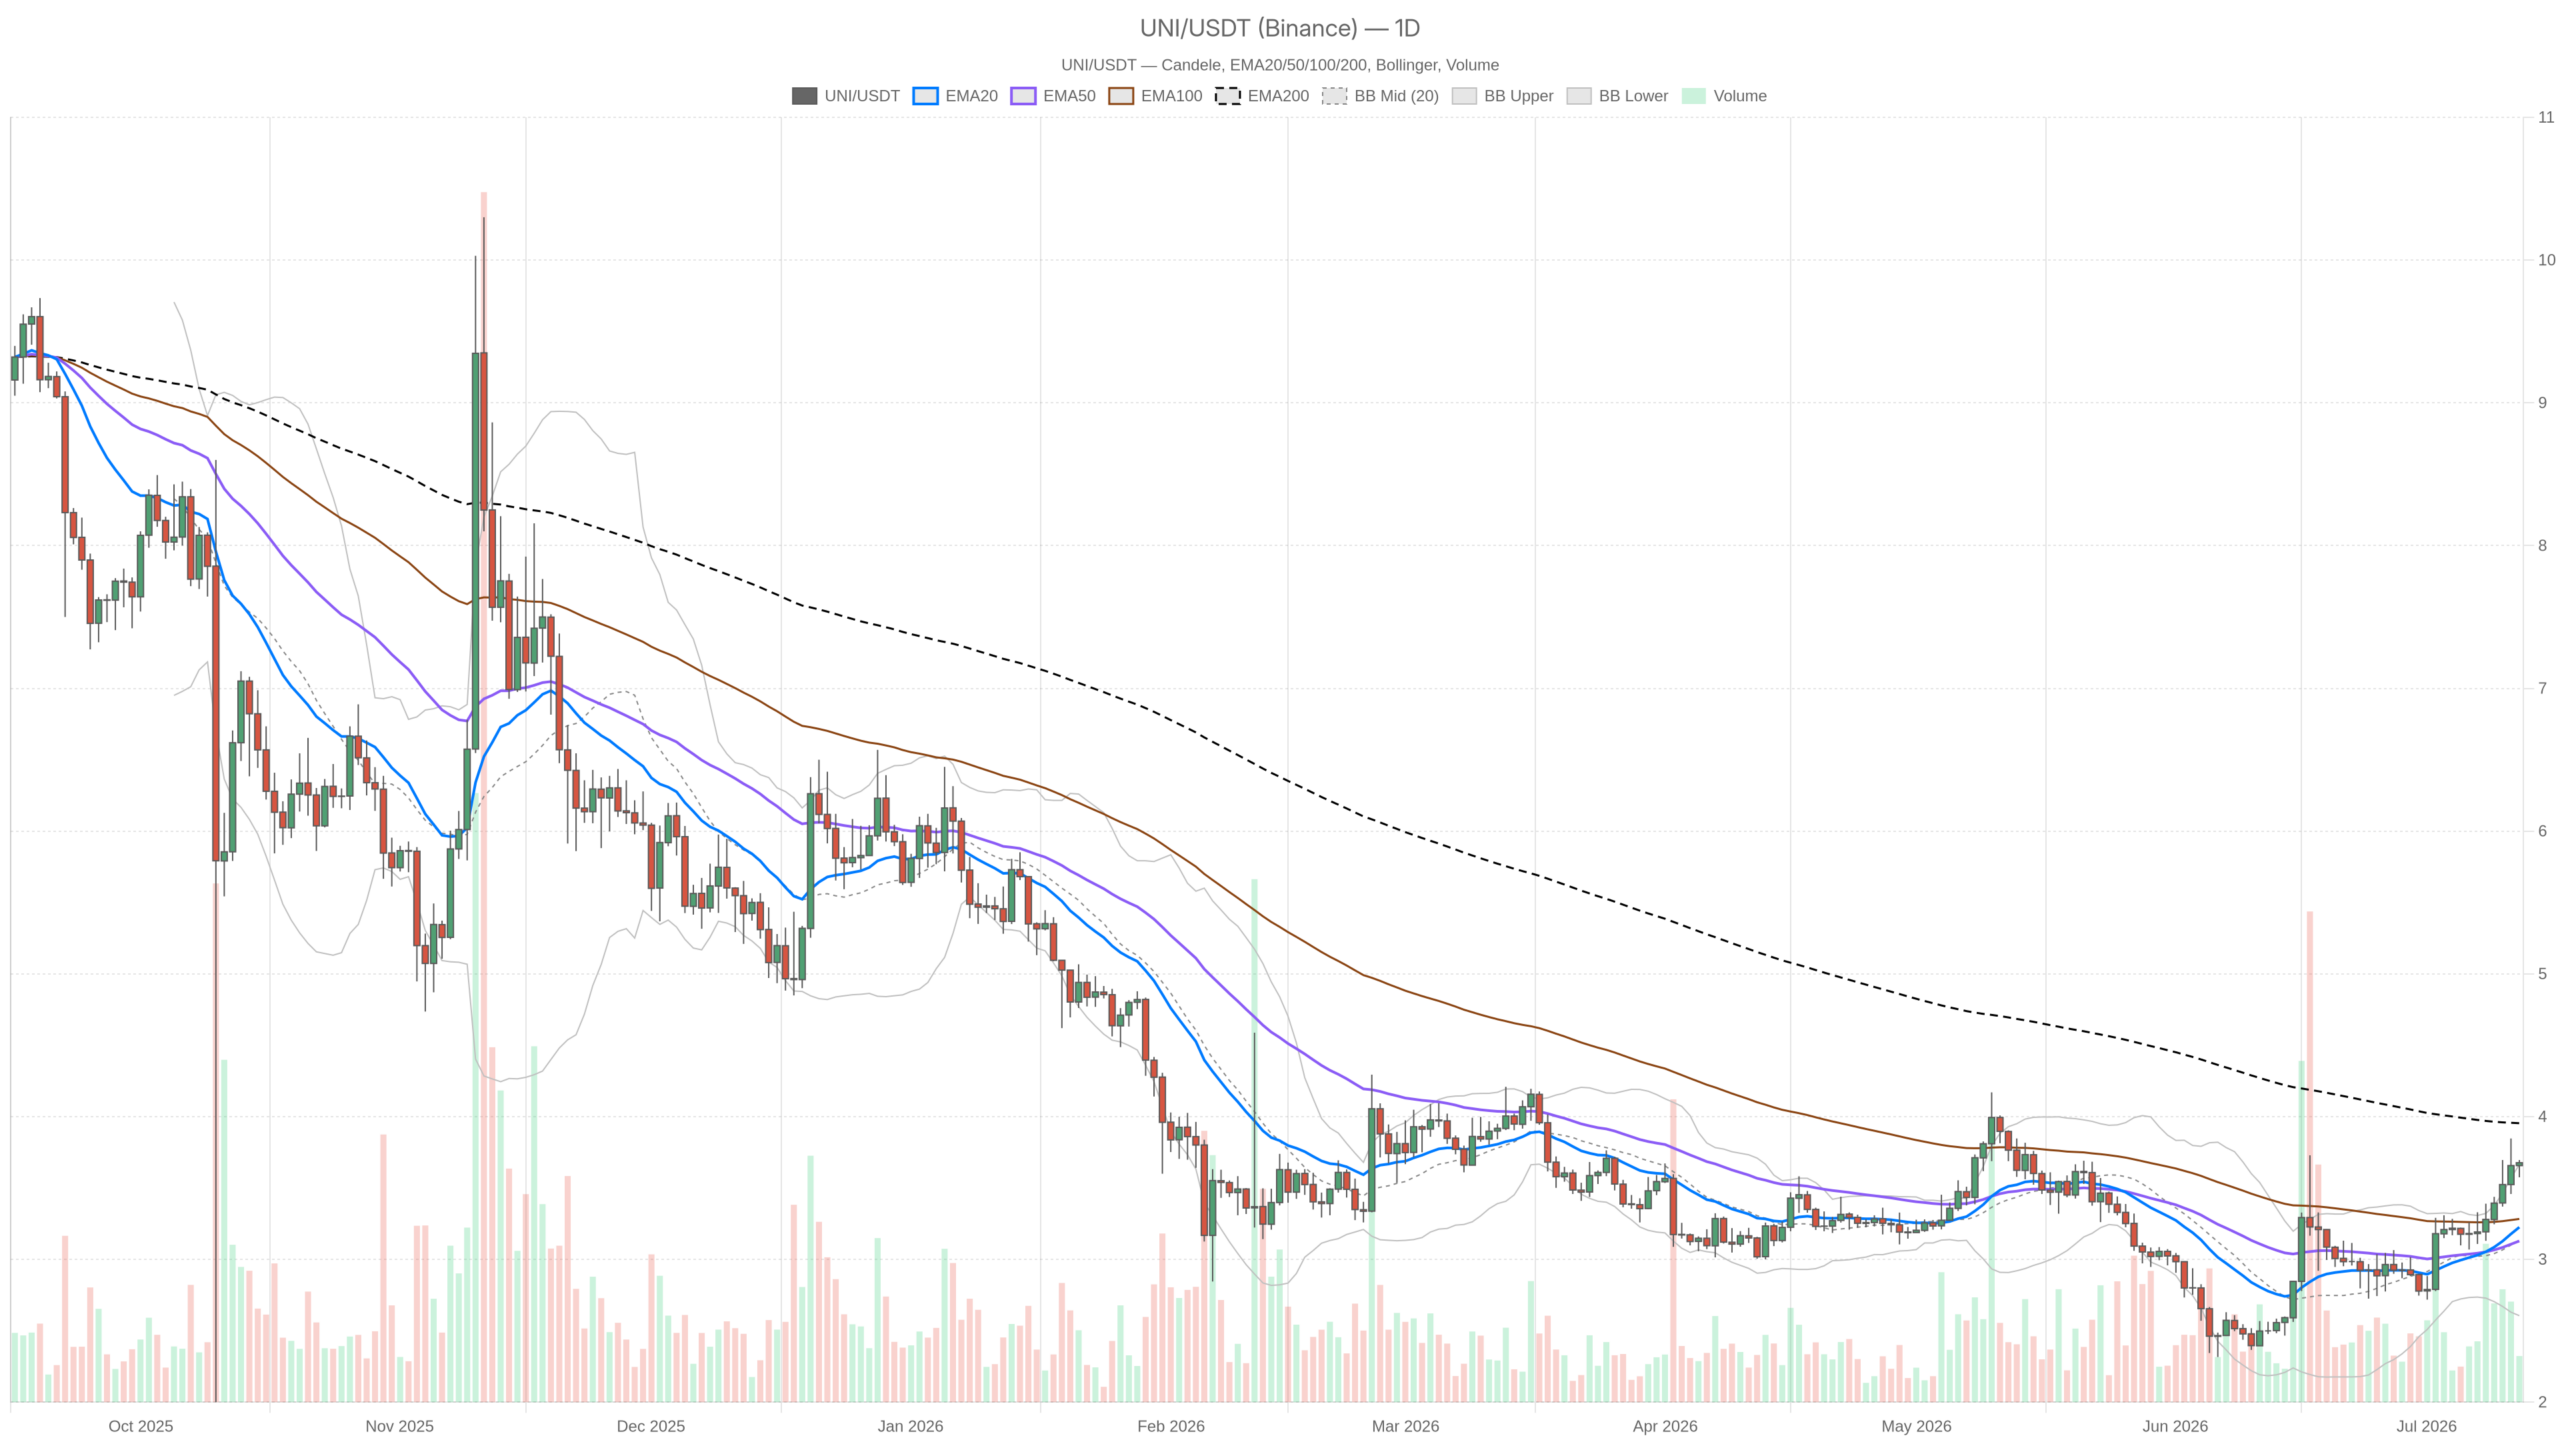
As of July 12, 2026, UNI/USDT is trading at $3.68 — a level that sounds unassuming until you layer the daily chart underneath it. The price sits almost exactly at the upper Bollinger Band on the D1 timeframe. Meanwhile, the daily RSI has pushed to 75.55 and the broader crypto market registers a Fear & Greed index of just 26. That combination is not a contradiction; it is a tension worth understanding. UNI is technically extended on the daily while macro sentiment remains defensive.
The broader market backdrop adds important context. Total crypto market cap sits at approximately $2.29 trillion, down a modest 0.29% over the prior 24 hours, with Bitcoin dominance at 56.24%. That level of BTC dominance tells you altcoins are not leading this market. For UNI to sustain a move higher, it would need to do so against the gravitational pull of risk-off flows rotating back toward BTC.
On the DEX side, however, Uniswap V3 fees show a striking +330% 30-day change and a +36.91% 7-day surge according to DefiLlama figures. This represents a genuine fundamental tailwind that gives the current price extension at least some structural justification.
Daily Timeframe: Bullish Trend, But Stretched
The D1 regime is tagged as neutral by the system — which feels like an understatement given the actual structure. Price at $3.68 sits well above both the EMA20 at $3.23 and the EMA50 at $3.13, with a clean bullish stack. The EMA200 at $3.95, however, sits above price, acting as a long-term overhead anchor. UNI is in a local uptrend but still operating below its long-term mean. Getting to the EMA200 would require a move of roughly 7% from current levels.
The Bollinger Bands on D1 tell a precise story. The upper band is at $3.66, the midline at $3.13, and the lower band at $2.61. Price at $3.68 has technically broken above the upper band — statistically rare and historically associated with either a powerful continuation or an imminent snap back toward the midline. The ATR of 0.22 gives a sense of the daily volatility envelope. A single daily candle could reclaim everything gained intraday.
The daily MACD reinforces upward momentum: line at 0.16, signal at 0.10, histogram at 0.07. It is positive and expanding — the bulls own the momentum on this timeframe. However, RSI at 75.55 is firmly overbought. Overbought assets can stay overbought during strong trends, but any new buyer here accepts elevated reversal risk without much warning.
Daily pivot levels frame the immediate battleground: PP at $3.65, R1 at $3.72, and S1 at $3.60. Price oscillates just above the pivot point, which currently acts as the floor. A clean close below $3.60 on the daily would mark the first technical deterioration worth paying attention to.
Hourly and 15-Minute: Calm Structure, No Fresh Catalyst
Dropping to the 1H chart, the aggression visible on the daily almost disappears. The 1H regime is tagged bullish, with price at $3.68 and the EMA20 just below at $3.66. The hourly EMA200 at $3.40 sits well below price, confirming a constructive intraday trend. However, the hourly MACD histogram is effectively zero — line and signal both at 0.01, with no divergence. The hourly RSI at 55.82 is mid-range and neutral.
The hourly Bollinger Bands are extremely compressed: upper at $3.69, lower at $3.61, a band width of just 0.08. Price coils near the top of that range. Compressed bands almost always precede a directional expansion. Given the daily RSI is already extended, the risk of that expansion being downward is non-trivial.
The 15-minute chart mirrors the 1H almost exactly — RSI at 57.03, MACD flat, price hugging the upper Bollinger Band at $3.69. Both the 15m and 1H show S1 at $3.67, and a breakdown below $3.65 would likely accelerate toward the $3.60 daily support zone.
Bullish Scenario: Uniswap Fee Momentum Drives the Next Leg
The bull case rests on a combination of technical continuation and genuine fundamental momentum. Uniswap V3 fees surging +330% over 30 days reflects real protocol usage that can translate into sustained demand for the UNI token. If price holds above the daily pivot at $3.65 and consolidates in the $3.65–$3.72 range, it would allow the RSI to cool without a price breakdown.
A clean break above R1 at $3.72 on the daily, confirmed on the 1H, opens the path toward the EMA200 at $3.95. That level would be the logical first target in a renewed uptrend. Moreover, this scenario holds as long as Bitcoin dominance does not spike aggressively and the broader market cap stabilizes above current levels.
What invalidates this view: a daily close below $3.60 with volume would signal the rally is rolling over. Below that, the EMA20 at $3.23 becomes the next structural reference — a long way down from current levels.
Bearish Scenario: Overbought Exhaustion in a Risk-Off Market
The bear case is straightforward and technically grounded. An RSI of 75.55 on the daily with price above the upper Bollinger Band, in a broader market where Fear & Greed reads 26 and BTC dominance is above 56%, creates a setup for a sharp pullback. Mean reversion toward the Bollinger midline at $3.13 would represent a roughly 15% move lower. That is entirely consistent with normal volatility given the ATR of 0.22.
The flat hourly MACD and compressed Bollinger Bands suggest the current consolidation could be the last breath before a reversal rather than a launchpad. If hourly RSI starts rolling over from the mid-50s toward 40, that would be the early warning signal to watch.
What invalidates this view: a sustained daily close above $3.72 with RSI holding above 70 and MACD histogram expanding. Overbought can stay overbought in strong trending conditions, and the fee data confirms the protocol is alive and growing.
How to Read the Current Positioning
This is not a market that rewards certainty. UNI/USDT sits at a genuine inflection point: the daily trend is intact and momentum is real, but the risk of being the last buyer at the top of an overextended move is equally real. The macro backdrop — fear sentiment, high BTC dominance, slight market cap decline — is not helping altcoins build broad-based momentum.
The Uniswap fee data is a legitimate positive catalyst, but fee growth does not automatically translate into short-term price appreciation. This is precisely the dilemma the UNI/USDT Analysis: Daily RSI at 75 Flashes Caution as Price Hugs the Upper Band highlights — a tension between momentum and exhaustion that technicals alone cannot resolve.
Volatility here is asymmetric. With the daily ATR at 0.22 and the price compressed in a tight hourly range, the next move is likely to be fast and decisive. The prudent approach is to let price declare itself. A break above $3.72 or a breakdown below $3.60 will answer the question. Position sizing matters more than direction in this setup.
FAQ
What does a daily RSI of 75.55 signal for UNI/USDT?
An RSI above 70 typically signals overbought conditions. At 75.55, UNI/USDT is firmly in overbought territory on the daily timeframe. This does not guarantee an immediate reversal — overbought assets can stay overbought during strong trending phases — but it indicates that buyers entering at current levels accept a higher probability of a sharp pullback without much warning.
Why is the Bollinger Band breakout significant?
Price at $3.68 has broken above the daily upper Bollinger Band at $3.66. Statistically, this is rare and historically precedes either a powerful continuation or a mean-reversion snap back toward the midline at $3.13. Combined with compressed hourly bands, the setup suggests an imminent directional expansion is more likely than further sideways consolidation.
Can the Uniswap V3 fee surge sustain the UNI rally?
The +330% 30-day surge in Uniswap V3 fees provides genuine fundamental support, reflecting real protocol usage and growing DEX activity. However, fee growth does not automatically translate into short-term price appreciation, especially when macro sentiment reads Fear at 26 and BTC dominance sits above 56%. The fundamental tailwind is real, but it competes with a risk-off macro environment.
UNI/USDT sits at a critical juncture where technical momentum and fundamental strength collide with overbought readings and defensive macro conditions. The daily close relative to $3.72 resistance and $3.60 support will likely determine whether the uptrend resumes or a mean-reversion pullback unfolds. In either case, the fee data from Uniswap V3 confirms the protocol’s underlying health remains robust regardless of short-term price action.
Disclaimer: This article is for informational purposes only and does not constitute financial advice, an investment recommendation, or a solicitation to buy or sell any financial instrument or cryptocurrency. The analysis provided is not indicative of future results. Investing in crypto assets and financial markets carries a high risk of capital loss. Always do your own research (DYOR) and consult a qualified financial advisor before making any decision.
Article produced with the assistance of artificial intelligence and reviewed by the editorial team.
