




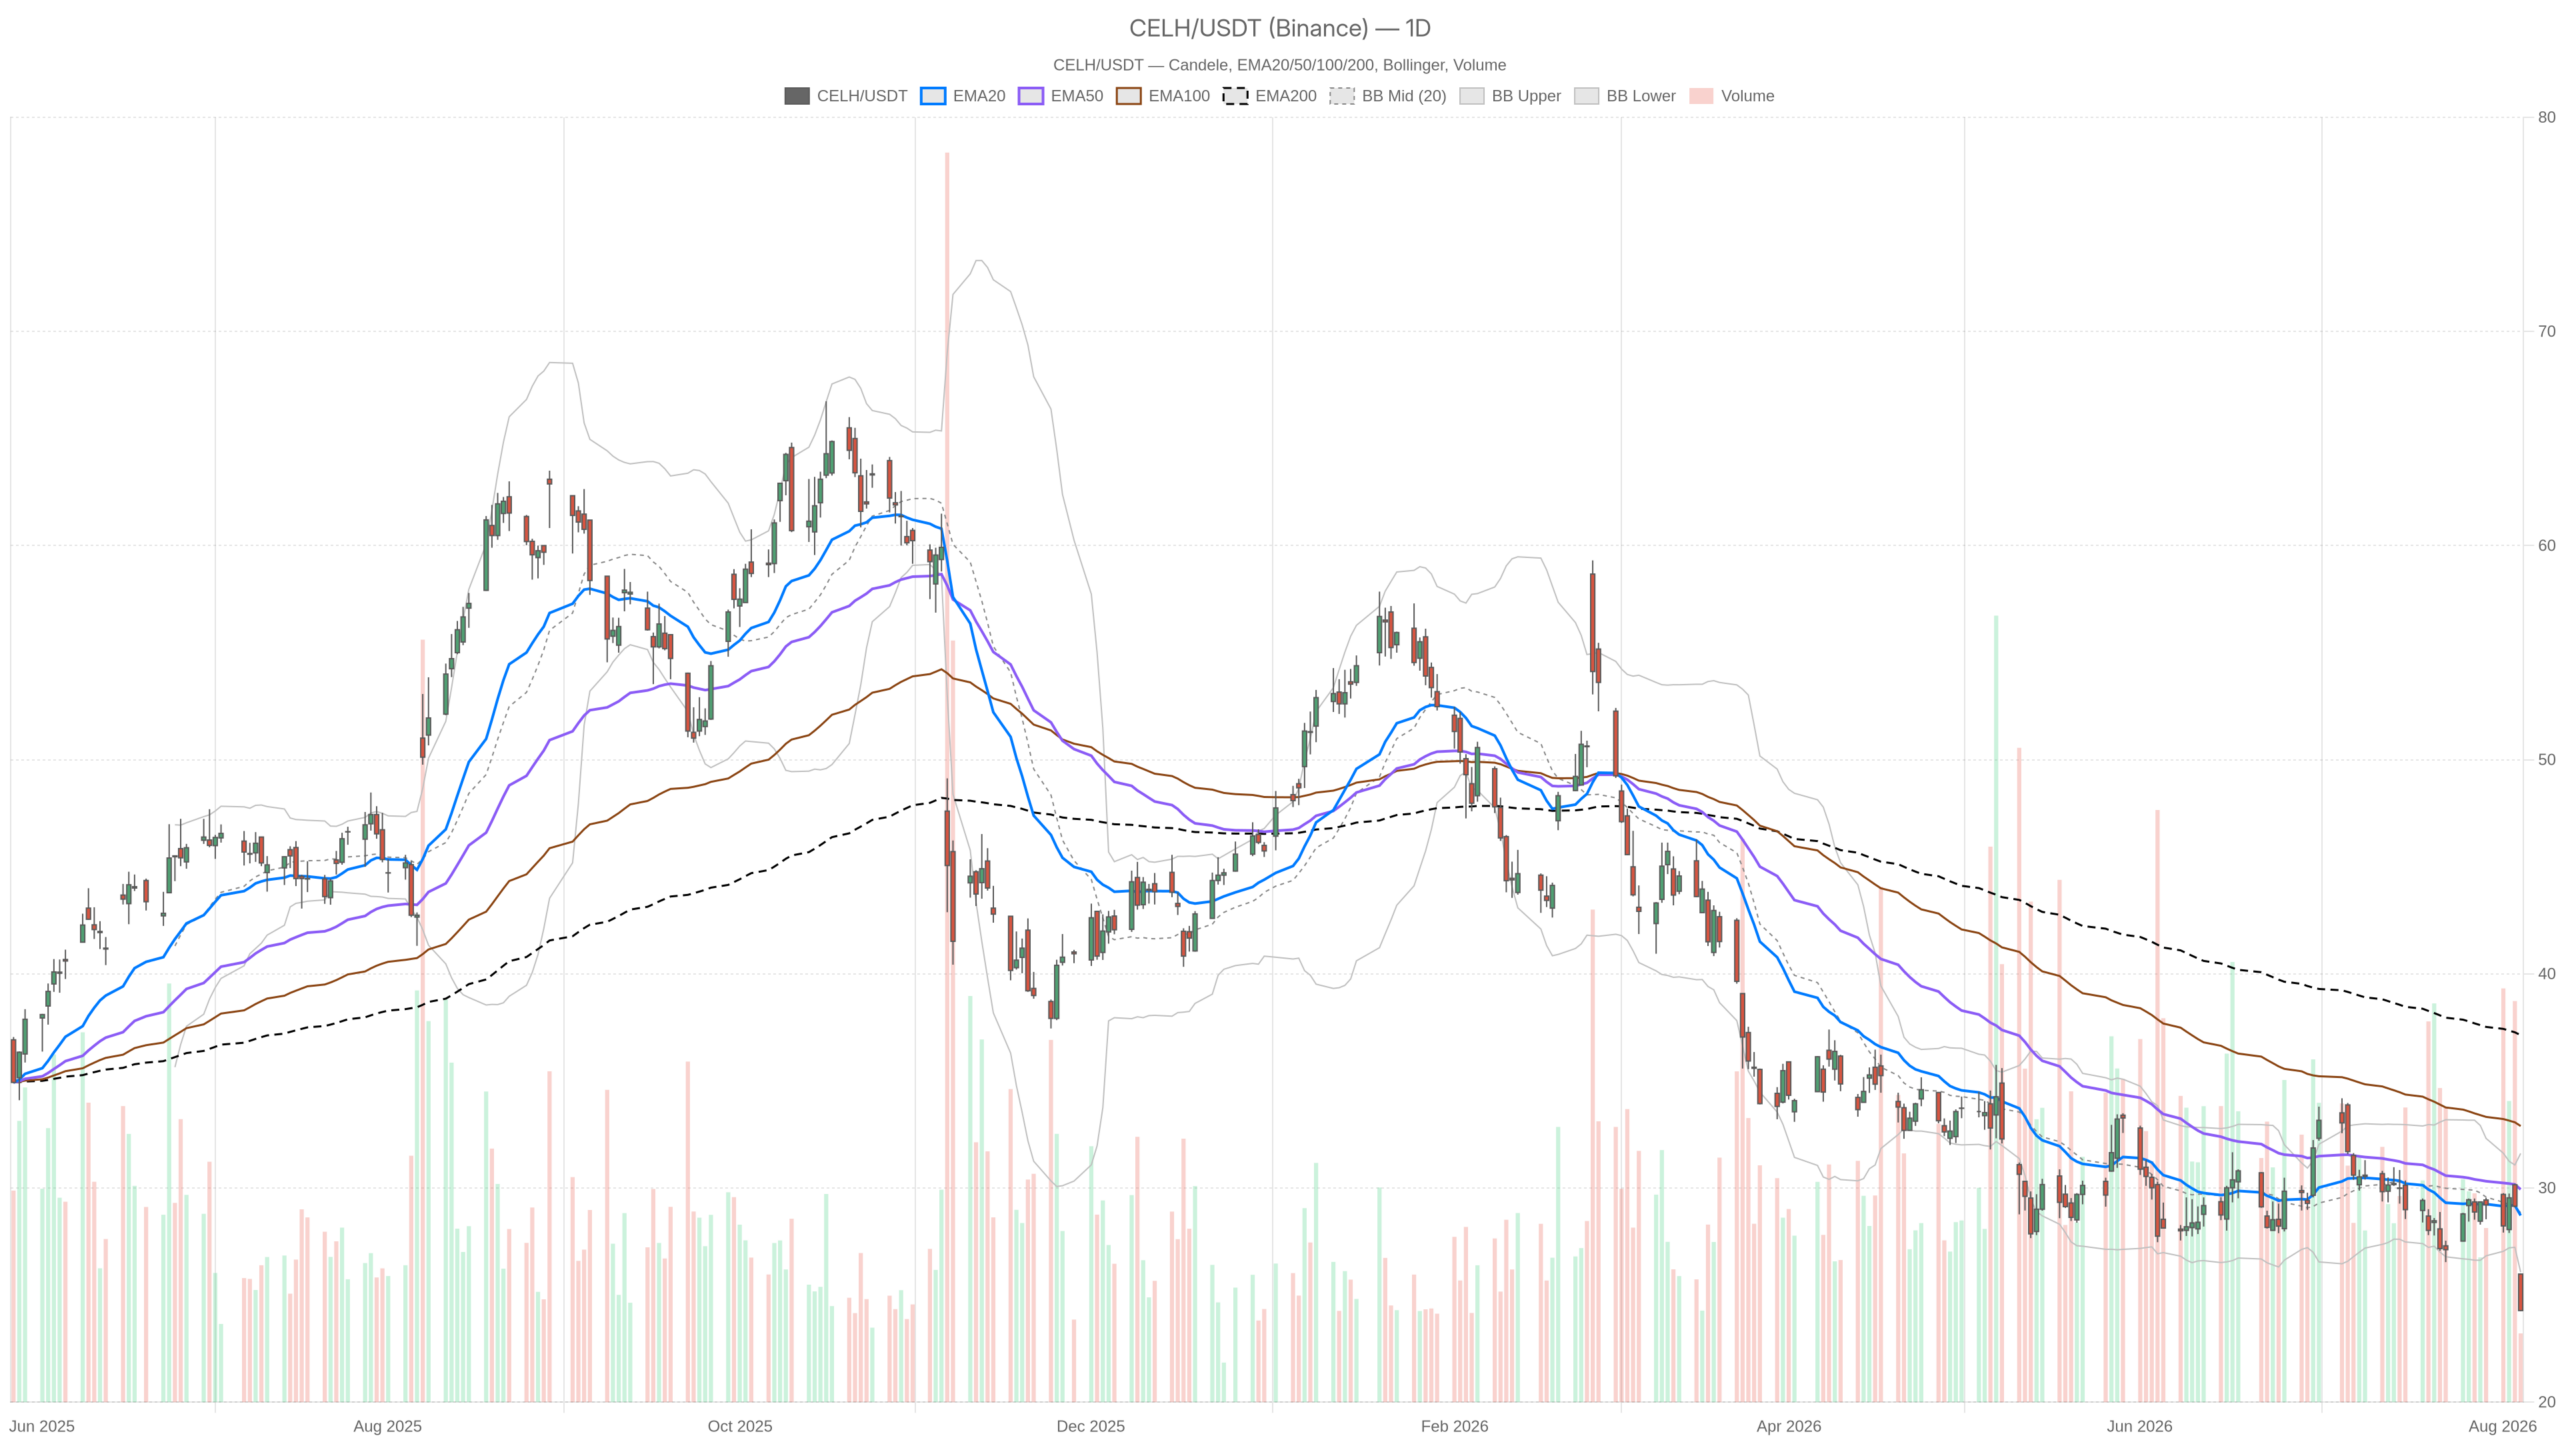
Celsius Holdings, Inc. stock plunged on August 6 after a Q2 earnings miss, closing at $24.27. Every major daily trend indicator now sits above price. The technical structure is decisively bearish. Lower timeframes reinforce this bias while also flashing extreme oversold readings.
Summary
Key takeaways
- CELH closed at $24.27 on August 6, with shares dropping as much as 15.9% after the Q2 earnings release.
- The daily chart shows a clean bearish structure with price below the EMA20, EMA50, and EMA200.
- RSI on the 1H timeframe hit 16.25 and collapsed to 7.56 on the 15-minute chart — extreme oversold territory.
- Non-GAAP EPS of $0.36 missed consensus by 13.9%, while core brand sales turned negative.
- A breakdown below $23.68 daily support would confirm further downside continuation.
Celsius Holdings, Inc. Stock Daily Trend Turns Decisively Bearish
The daily trend structure on Celsius Holdings, Inc. stock is unequivocally bearish across all time horizons. Price sits beneath every major moving average, confirming sellers remain firmly in control.
Price trades below the EMA20 at $28.72, the EMA50 at $29.94, and the EMA200 at $37.14. This clean stacking confirms short, medium, and long-term bearish alignment. The gap to the EMA200 underscores the depth of the decline.
RSI14 on the daily timeframe sits at 32.25. While low, it has not yet reached classic oversold territory below 30. Momentum still has room to deteriorate before the daily chart would signal exhaustion.
MACD confirms the bearish picture. The line sits at -0.65 against a signal of -0.42, producing a histogram of -0.22. However, the daily reading is less extreme than what shows up intraday.
Bollinger Bands add further context. The daily close of $24.27 sits below the lower band at $26.07. Meanwhile, the midline rests at $28.84 and the upper band at $31.61. Price trading outside the lower band typically signals a strong, possibly overextended directional move.
Notably, ATR14 stands at 1.57, which is elevated relative to current price. This points to wide, volatile daily ranges ahead. Pivot levels frame the near-term battle: the daily pivot at $24.84, resistance at $25.43, and support at $23.68. Closing below the pivot keeps sellers in charge. A break of $23.68 would open the door to further downside.
1H Timeframe Confirms the Bearish Bias, With an Oversold Twist
The hourly chart on Celsius Holdings, Inc. stock reinforces the bearish trend while also signaling that selling has become stretched in the short term. Price remains well below all key moving averages, yet RSI has plunged into deeply oversold territory.
The EMA20 at $28.37, EMA50 at $28.68, and EMA200 at $29.12 all sit above the current price of $24.29. This keeps the intraday trend firmly bearish. In contrast, the hourly RSI14 has dropped to 16.25 — a reading that suggests the selloff may be overextended.
MACD on the 1H shows the line at -0.57 versus a signal of -0.04, with a histogram of -0.53. That histogram is wider than the daily reading. Therefore, downside momentum is actually accelerating on the hourly timeframe, even as the daily picture looks comparatively tamer.
Bollinger Bands echo the daily setup. Price trades below the lower band of $25.58. At the same time, the hourly pivot sits at $24.34, with resistance at $24.43 and support at $24.20. This tight range shows price consolidating around the pivot after the initial drop.
15-Minute Execution: Capitulation-Style Readings
The 15-minute chart on Celsius Holdings, Inc. stock displays readings consistent with short-term capitulation. RSI has collapsed to single digits, often a precursor to a relief bounce once selling pressure exhausts itself.
RSI14 on this timeframe has dropped to 7.56 — an extremely stretched reading. MACD reinforces the picture, with a line of -1.26 against a signal of -0.65 and a histogram of -0.61. Still, these are the kinds of readings that can precede a sharp snapback.
Price trades at $24.29, just above the lower Bollinger Band of $23.98. The pivot structure mirrors the hourly: pivot at $24.34, resistance at $24.43, and support at $24.20. For traders using this timeframe for execution, the $24.20–$24.43 band is the key zone to monitor for stabilization.
What’s Driving Celsius Holdings, Inc. Stock: The Q2 Earnings Miss
The technical breakdown in Celsius Holdings, Inc. stock aligns directly with disappointing Q2 results. Revenue growth failed to satisfy Wall Street, and core brand sales turned negative.
Celsius reported second-quarter revenue of $818 million, with one source citing growth of roughly 11% year-over-year and another putting the increase at 10.6% to $817.9 million. However, the top-line growth was not enough. The stock fell sharply as a result.
More concerning for the narrative is that sales for the core Celsius brand turned negative, according to Seeking Alpha. Growth at Alani Nu helped offset the decline. Meanwhile, Chairman and CEO John Fieldly noted the completed integration of Rockstar on the earnings call.
Non-GAAP earnings per share came in at $0.36, which was 13.9% below analysts’ consensus estimate. Shares dropped as much as 15.9% following the report, tumbling in premarket trading as the miss became clear.
Notably, this selloff comes just two days after a separate piece highlighted Celsius Holdings’ 21% share of the U.S. energy drink market, trailing only Red Bull and Monster Beverage. That analysis framed the stock as a defensive, value, and growth pick. The bullish thesis now sits in direct tension with the post-earnings reaction. The market’s verdict, at least in the short term, has clearly favored the bears.
Bullish Scenario for Celsius Holdings, Inc. Stock
A bullish reversal in Celsius Holdings, Inc. stock would require stabilization above the daily pivot and a reclaim of key resistance. The extreme oversold readings make a relief bounce technically plausible, though significant hurdles remain.
A bullish case would start with price stabilizing above the daily pivot at $24.84 and reclaiming the $25.43 resistance level. The deeply oversold readings — RSI at 16.25 on the 1H and 7.56 on the 15m — suggest a relief bounce is technically plausible. However, for that bounce to gain traction, price would need to push above the EMA20 levels on shorter timeframes. Those sit at $28.37 on the 1H and $27.55 on the 15m, far above current levels.
On the fundamental side, continued growth from Alani Nu and the completed Rockstar integration could eventually help offset the core brand’s decline. Still, until the technical structure improves meaningfully, this remains a scenario built on oversold mechanics rather than confirmed trend reversal.
Bearish Scenario for Celsius Holdings, Inc. Stock
The bearish scenario remains the path of least resistance for Celsius Holdings, Inc. stock. A break below daily support would confirm continuation of the dominant downtrend.
A breakdown below the daily support at $23.68 would confirm further downside. The EMA200 sitting far above at $37.14 illustrates how dominant the longer-term downtrend remains. Elevated ATR14 at 1.57 on the daily chart suggests volatile moves are likely in either direction. The trend context, however, favors continued weakness.
In contrast to the oversold bounce argument, the daily RSI at 32.25 still has room to fall before reaching classic oversold territory. This means there is technical space for the daily chart to weaken further without triggering an extreme reading. If the core Celsius brand’s sales decline persists in coming quarters, that would also undercut any near-term bullish attempt.
Closing Take
Celsius Holdings, Inc. stock sits at a technically tense point where the dominant bearish trend coexists with extreme short-term oversold conditions. This creates genuine two-way risk around current levels.
The daily trend is unambiguously bearish, and the 1H timeframe confirms that bias. At the same time, deeply oversold readings on shorter timeframes argue for the possibility of a sharp technical bounce. Therefore, positioning around current levels carries real two-way risk.
The earnings miss and the core brand’s negative sales trend add fundamental weight to the bearish case. Meanwhile, a separate bullish narrative around market share persists elsewhere. Overall, volatility remains elevated across timeframes. Uncertainty around the next move is high until price reclaims key pivot and resistance levels or breaks decisively through support.
FAQ
Why did Celsius Holdings, Inc. stock drop?
Celsius Holdings, Inc. stock fell sharply after reporting Q2 revenue of approximately $818 million and non-GAAP EPS of $0.36, which missed analysts’ consensus by 13.9%. Core brand sales turned negative, and shares dropped as much as 15.9% following the release.
Is Celsius Holdings, Inc. stock oversold?
On shorter timeframes, yes. The 1H RSI14 sits at 16.25 and the 15-minute RSI14 has collapsed to 7.56, both in deeply oversold territory. However, the daily RSI14 at 32.25 has not yet reached the classic oversold threshold below 30, suggesting the daily trend still has room to weaken further.
What are the key support and resistance levels for CELH?
The daily pivot sits at $24.84, with immediate resistance at $25.43 and key support at $23.68. A break below $23.68 would confirm further downside continuation, while reclaiming $24.84 and $25.43 would be the first steps toward stabilization.
What is the long-term outlook for Celsius Holdings, Inc. stock?
The daily chart shows a clean bearish structure with price well below the EMA200 at $37.14. The gap underscores the depth of the longer-term downtrend. While the company holds a 21% share of the U.S. energy drink market, the core brand’s negative sales trend and the Q2 earnings miss weigh on the near-term outlook.
Disclaimer: This article is for informational purposes only and does not constitute financial advice, an investment recommendation, or a solicitation to buy or sell any financial instrument or cryptocurrency. The analysis provided is not indicative of future results. Investing in crypto assets and financial markets carries a high risk of capital loss. Always do your own research (DYOR) and consult a qualified financial advisor before making any decision.
Article produced with the assistance of artificial intelligence and reviewed by the editorial team.
