



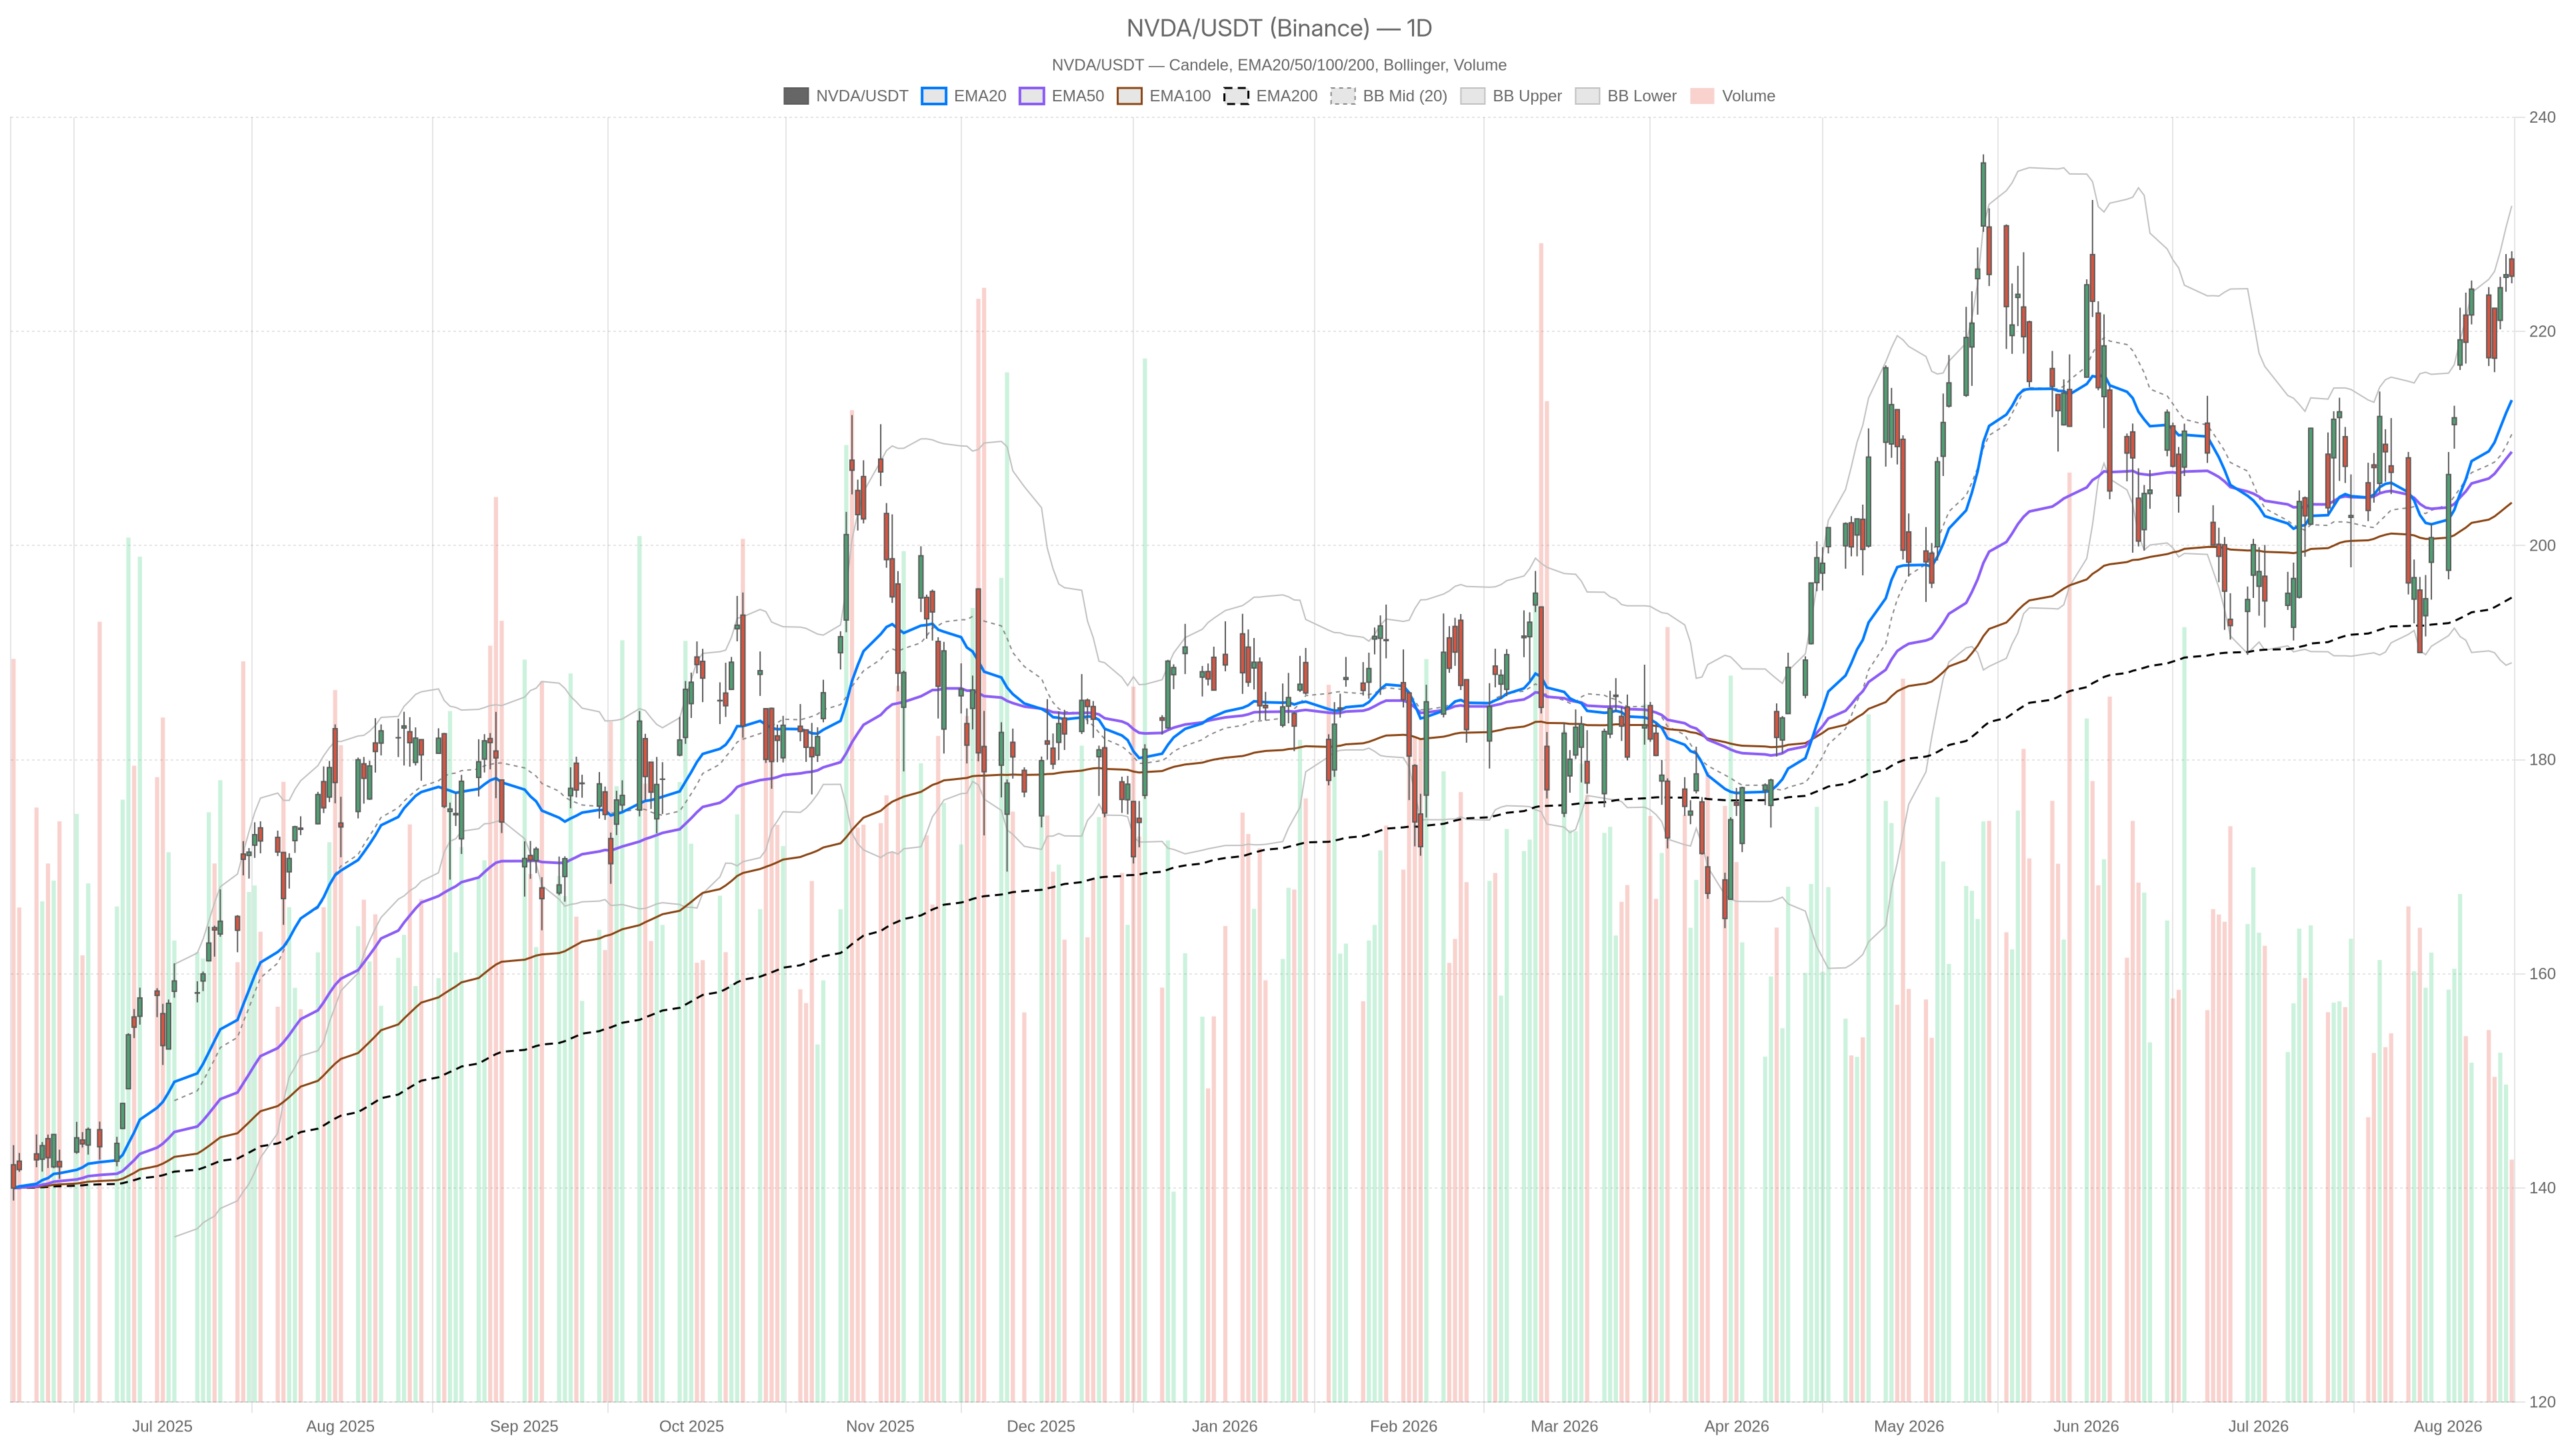
Nvidia stock remains anchored in a bullish daily trend, closing at $225.16 after touching a high of $227.49. Price holds above the 20, 50 and 200-day EMAs. Yet shorter timeframes show momentum fading ahead of a critical earnings date.
Summary
Key takeaways
- Nvidia stock closed at $225.16, holding above the 20, 50 and 200-day EMAs at 213.59, 208.76 and 195.15.
- The daily RSI14 reads 63.03, while the MACD line at 5.28 stays above its signal line at 3.23.
- The 1-hour MACD histogram is negative at -0.24, signaling fading short-term momentum.
- A widely cited Motley Fool piece predicts a drop after the Q2 earnings report on August 26.
- The daily ATR14 sits at 6.84, keeping near-term volatility elevated.
Nvidia Stock Price Structure and Trend
Nvidia stock (NVDA) is still in a clear bullish trend on the daily chart. The close at $225.16 sits well above the 20, 50 and 200-day exponential moving averages. Those levels stand at 213.59, 208.76 and 195.15. That stacked alignment is the signature of a trend that has not lost its footing. The daily regime is therefore classified as bullish.
On the daily chart, the RSI14 reads 63.03. That is comfortably bullish without tipping into overbought extremes. There is still room for continuation before momentum becomes stretched. The MACD line at 5.28 remains well above its signal line at 3.23, producing a positive histogram of 2.05. This confirms upward momentum that is still building rather than fading. Meanwhile, daily Bollinger Bands show price trading close to the upper band at 231.73. The mid-band sits at 210.39 and the lower band at 189.06.
At the same time, the daily ATR14 stands at 6.84. This is a reminder that Nvidia stock continues to trade with real day-to-day volatility. Pivot levels for the session sit at 225.72 for the pivot point, 226.93 for R1 and 223.94 for S1. Friday’s close lands almost exactly at the pivot. That is balanced short-term positioning, neither extended above resistance nor breaking toward support.
Momentum Signals Diverge Across Timeframes
The broader bullish tilt holds structurally, but momentum signals are starting to diverge across timeframes.
Hourly Momentum Cools
The 1-hour chart still confirms the broader bullish tilt structurally. Price at $225.16 trades above the 20, 50 and 200-period EMAs at 224.27, 220.90 and 211.55. The regime is labeled bullish. Yet the momentum readings tell a slightly different story. The 1H RSI14 has cooled to 58.45, a step down from the daily reading. The 1H MACD has already crossed negative. Its line at 1.26 sits below the signal at 1.50, with a histogram of -0.24.
In contrast to the daily setup, this points to fading short-term momentum even as the broader trend structure holds. That is the central conflict in this setup. The daily trend is intact and momentum there is still expanding. The hourly chart is showing early signs of exhaustion. The 1H Bollinger Bands reinforce this. Price at $225.16 sits almost exactly between the mid-band at 224.84 and the upper band at 226.50. It is well inside a narrow range rather than pushing decisively higher. The 1H ATR14 of 1.55 also suggests intraday volatility has compressed relative to the broader daily range.
15-Minute Execution Context
Meanwhile, on the 15-minute chart, used strictly for execution context, the picture turns essentially neutral. RSI14 at 49.33 is dead center. MACD is flat with a marginally negative histogram of -0.04. Price at $225.16 is trading right on top of its own EMA20 at 225.21 and the Bollinger mid-band at 225.22. The 15m ATR14 of just 0.59 confirms short-term volatility has genuinely dried up. Overall, this is a market pausing near the pivot rather than making an immediate directional decision.
Bullish Scenario for Nvidia Stock
The bullish case rests on the daily trend reasserting control. A hold above the daily pivot at 225.72 and a push through R1 at 226.93 would realign short-term price action with the daily setup. That setup still shows an expanding MACD and an RSI14 near 63. A move that reclaims positive territory on the 1H MACD would also help confirm the hourly pullback was just a pause. That would rule out a reversal.
Notably, the news backdrop provides a fundamental complement to this technical setup. Reports describe continued strength in AI-driven spending trends across chipmakers. Nvidia was named alongside Intel, Oracle, AMD and SanDisk as part of last week’s “AI money moves” spotlight. Additional coverage on Nvidia’s financing platform frames it as supportive infrastructure for the broader AI investment boom. Still, critics like Michael Burry have publicly questioned the structure, calling it a “Wall Street stunt.”
Bearish Risks Ahead of Earnings
The bearish argument centers on both technical exhaustion and a looming catalyst. Price is already trading close to the upper daily Bollinger Band at 231.73. One widely cited Motley Fool piece explicitly predicts that Nvidia stock will fall after its Q2 earnings report on August 26. It cites two specific reasons for caution. Separately, other analysis suggests the stock is now trading near fair value rather than clearly undervalued. That view rests on discounted cash flow and market multiple comparisons following a very large five-year gain.
Therefore, a failure to hold the 224.68 daily S1 level would suggest short-term sellers are gaining the edge. This is especially true given the already-negative 1H MACD histogram. If that hourly weakness spreads, price could break below the 15m EMA cluster near 224.87–225.21. That would invalidate the idea that the bullish daily trend is simply pausing. It would instead point toward a more meaningful near-term pullback.
Closing Take
Overall, Nvidia stock enters this stretch with a daily trend that remains constructive. The daily setup is supported by trending EMAs, a still-rising MACD, and RSI readings that leave room. Overbought conditions are not yet a concern. At the same time, the 1-hour and 15-minute timeframes show momentum cooling and volatility compressing. This is consistent with a market waiting for its next catalyst rather than committing to a fresh breakout. With the August 26 earnings report approaching and analyst opinions genuinely split, positioning around current levels calls for discipline. Volatility, as measured by the daily ATR14 near 6.84, remains elevated. Price swings around the pivot and R1/S1 levels could accelerate quickly once the market picks a direction. This article does not constitute financial advice.
FAQ
What is the current trend for Nvidia stock?
Nvidia stock remains in a bullish daily trend. The close at $225.16 sits above the 20, 50 and 200-day EMAs at 213.59, 208.76 and 195.15.
Is short-term momentum weakening?
Yes, shorter timeframes show cooling momentum. The 1H RSI14 is 58.45 and the 1H MACD histogram is -0.24, pointing to fading short-term strength.
What levels should traders watch?
The daily pivot is 225.72, with R1 at 226.93 and S1 at 223.94. The upper daily Bollinger Band sits at 231.73.
What is the next major catalyst for Nvidia stock?
The Q2 earnings report on August 26 is the key catalyst. A widely cited Motley Fool piece predicts the stock will fall after that report.
Disclaimer: This article is for informational purposes only and does not constitute financial advice, an investment recommendation, or a solicitation to buy or sell any financial instrument or cryptocurrency. The analysis provided is not indicative of future results. Investing in crypto assets and financial markets carries a high risk of capital loss. Always do your own research (DYOR) and consult a qualified financial advisor before making any decision.
Article produced with the assistance of artificial intelligence and reviewed by the editorial team.
