



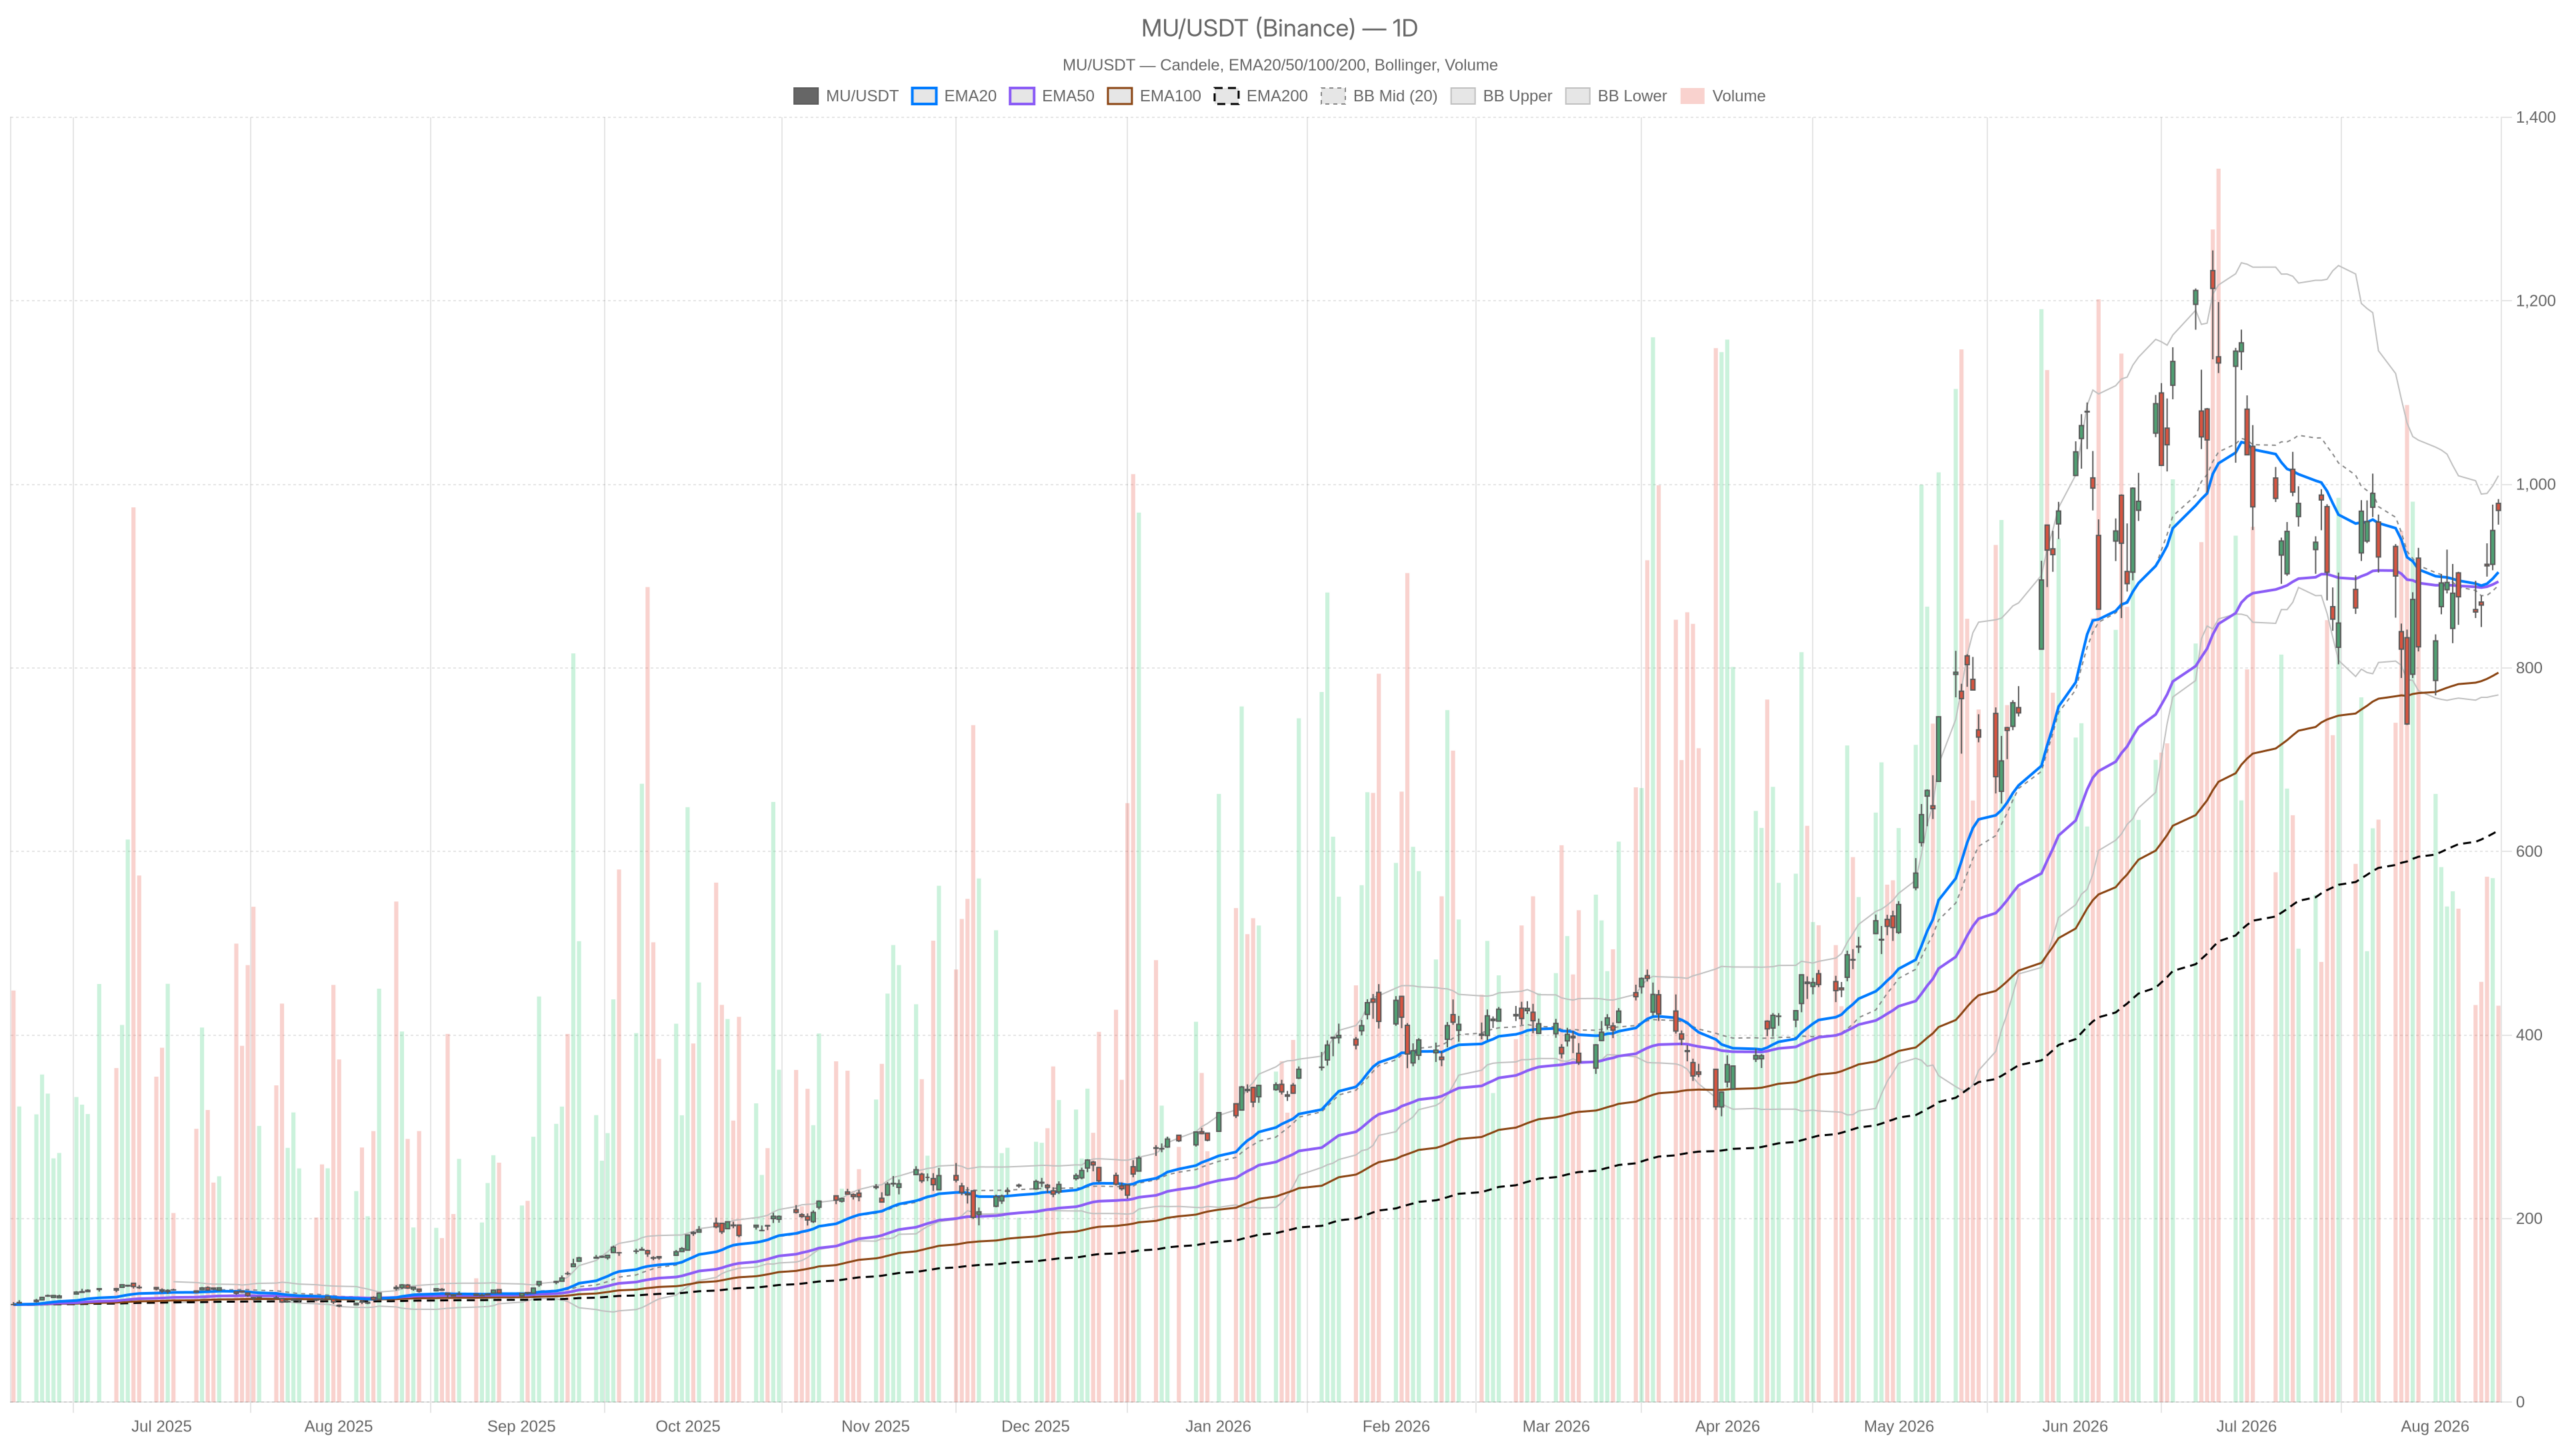
Micron stock is trading just below the psychological $1,000 mark, closing at $971.66 after an intraday high of $984. The daily chart still points higher, but the pace is slowing. That tension between a firm primary trend and fading short-term momentum is the central story.
Summary
Key takeaways
- Micron stock closed at $971.66, just below the $1,000 level, after an intraday high of $984.
- The daily trend remains bullish, with price above the 20-day EMA (904.39), 50-day EMA (894.11), and 200-day EMA (622.89).
- Daily RSI14 at 56.3 is constructive, while hourly RSI14 at 66.92 flags short-term overbought conditions.
- The daily pivot at 970.62, resistance at 985.04, and support at 957.24 frame the near-term battle.
- The bullish case targets $1,000; a close below 970.62 and a break of 957.24 would raise momentum-driven downside risk.
Daily Structure Still Favors the Bulls
On the daily timeframe, the structure still favors the bulls. Micron stock at $971.66 sits well above the 20-day EMA (904.39), 50-day EMA (894.11), and 200-day EMA (622.89). That separation between short-term and long-term averages is typical of a strong, extended uptrend, not a market that is merely consolidating.
Momentum Is Constructive, Not Overheated
Daily RSI14 at 56.3 is a constructive but not overheated reading. Notably, this is not a market flashing overbought warnings. There is still room to run before momentum indicators would argue for exhaustion.
Meanwhile, the MACD tells a more nuanced story. The line is at -4.79 versus a signal of -18.89, producing a positive histogram of 14.09. In other words, MACD is still below zero on an absolute basis, but the gap between line and signal is closing fast. That pattern usually reflects a market recovering momentum after a pullback, rather than one accelerating into a blow-off top.
Volatility Bands and Pivot Levels
At the same time, the daily Bollinger Bands frame the picture well. Price is trading near the upper half of the band structure, with the mid-band at 890.05 and the upper band at 1,009.49. Micron stock has not yet tagged the upper band, leaving some technical room before volatility bands would start to cap further upside.
The daily ATR14 at 75.05 confirms this is a name with real range. Swings of $75 or more per session are not unusual. That matters for anyone sizing positions around current levels.
Overall, daily pivot levels reinforce the near-term battle. The pivot point sits at 970.62, essentially where price closed, with resistance at 985.04 and support at 957.24. That places Micron stock right on top of its own pivot, a classic sign of a market deciding its next directional move.
Hourly Momentum Shows Early Signs of Fatigue
Hourly momentum shows early signs of fatigue even though the intraday trend structure remains intact. The 1-hour regime reads neutral, not bullish, and that distinction matters. Price at 972.78 remains above the hourly EMA20 (947.5), EMA50 (918.7), and EMA200 (924.44).
However, RSI14 on the hourly has pushed up to 66.92, a level that starts to flag short-term overbought conditions. The hourly MACD adds to that caution. Its line sits at 19.38 against a signal of 20.14, and the histogram has turned slightly negative at -0.76.
That is a subtle but real divergence. Even as price pressed toward new highs near $984, hourly momentum has already started to roll over. This is the kind of conflict that matters. The daily trend remains bullish, but the hourly tape is telling a story of consolidation, or at minimum a pause, after the recent push.
Hourly Bollinger Bands show the mid at 951.4 with the upper band at 992.5. Price is trading in the upper portion of that range without having broken through it. The hourly ATR14 of 16.13 suggests intraday moves remain sizable, but contained relative to the daily range.
Hourly pivot levels put Micron stock in a tight intraday band. The pivot sits at 970.22, resistance at 976.56, and support at 966.43. That band sits just under recent highs.
15-Minute Tape Confirms Short-Term Bullish Bias, For Now
The 15-minute tape confirms a short-term bullish bias for now, with price action constructive for near-term execution. Price at 972.78 trades above the 15m EMA20 (964.83), EMA50 (956.53), and EMA200 (915.17). That keeps the short-term structure aligned with the broader daily trend.
RSI14 at 65.13 and a positive MACD histogram of 0.46 both support continued upside in the immediate term, without yet reaching extreme readings.
Still, the 15-minute Bollinger Bands are notably tight, with the mid at 964.02, upper at 969.83, and lower at 958.21. That is a compressed range, and compressed ranges often precede a directional move. With price at 972.78 already trading above the upper band on this shorter frame, that can signal short-term exhaustion just as easily as continuation.
This level deserves close attention for anyone trading around the pivot at 971.65, resistance at 975.13, and support at 969.3.
The Bullish Case for Micron Stock
The bullish case for Micron stock rests on the daily trend holding firm. Ideally, the stock works off its short-term overbought hourly condition through time rather than through a sharp price decline.
Therefore, if Micron stock can hold above the daily pivot near 970.62 and push through resistance at 985.04, the path toward $1,000 becomes far more credible. That level has been repeatedly referenced in recent coverage as the next psychological milestone.
Supporting this case, Micron’s business fundamentals have been highlighted as record-setting. Guidance points to further records ahead. At the same time, the stock’s current valuation is still described as sitting roughly 23% below its 52-week high. That is despite the company’s $1.1 trillion valuation.
Additional upside catalysts have also been mentioned. These include potential spillover demand tied to Apple and gains in the KOSPI, both flagged as possible near-term drivers for Micron shares.
The Bearish Risk and What Would Invalidate the Uptrend
The bearish risk is not a trend reversal yet. It is a momentum-driven pullback within an otherwise intact uptrend. The clearest warning sign would be a daily close back below the pivot at 970.62, followed by a break of support at 957.24. That combination would suggest the hourly momentum fade is starting to bleed into the higher timeframe.
A break of the 15-minute support at 969.3, combined with continued hourly MACD deterioration, would be an early tactical sign. It would suggest buyers are losing control of the short-term tape.
More broadly, the memory sector’s cyclical nature has been raised as a structural risk. Peer SK Hynix trades at a notably low multiple despite triple-digit revenue growth. That signals markets are already pricing in some degree of cyclical caution across the group, Micron included.
Micron Stock Positioning and Volatility Into the Next Leg
Micron stock remains in a daily uptrend that has not been technically broken. Even so, hourly and 15-minute momentum show early signs of cooling near current highs. The daily ATR14 of 75.05 versus the hourly ATR14 of 16.13 underscores how much range remains available in either direction. That volatility cuts both ways as price hovers just under the $1,000 threshold.
The signals are conflicting. A bullish daily regime, a neutral hourly regime, and a bullish-but-stretched 15-minute picture suggest a market in transition. There is no clean directional resolution yet.
Traders watching Micron stock (MU) into the next sessions will want to see whether the daily pivot and $985 resistance can be reclaimed decisively. Alternatively, the hourly momentum fade could drag price back toward the $957 support zone first.
FAQ
Where did Micron stock close in the last session?
Micron stock closed at $971.66 after touching an intraday high of $984.
Is the daily trend still bullish for Micron stock?
Yes. The daily regime remains bullish, with price well above the 20-day EMA (904.39), 50-day EMA (894.11), and 200-day EMA (622.89).
What would invalidate the bullish uptrend for Micron stock?
A daily close back below the pivot at 970.62, followed by a break of support at 957.24, would suggest the hourly momentum fade is starting to bleed into the higher timeframe.
What is the next major price target for Micron stock?
The next psychological milestone is $1,000, which becomes more credible if the stock holds above 970.62 and pushes through resistance at 985.04.
Disclaimer: This article is for informational purposes only and does not constitute financial advice, an investment recommendation, or a solicitation to buy or sell any financial instrument or cryptocurrency. The analysis provided is not indicative of future results. Investing in crypto assets and financial markets carries a high risk of capital loss. Always do your own research (DYOR) and consult a qualified financial advisor before making any decision.
Article produced with the assistance of artificial intelligence and reviewed by the editorial team.
