



Micron Technology, Inc. stock faces a genuine inflection point after an 8% intraday collapse on July 15. MU closed at $913.27, well below its $975.80 open, driven by renewed fears over Chinese memory chip competition. The daily chart is deteriorating, and the weight of evidence across timeframes leans cautious.
Summary
Key takeaways
- MU dropped 8% intraday on July 15, closing at $913.27 — well below the $975.80 session open
- The daily MACD histogram sits at -26.01, signaling deeply negative momentum despite a structurally intact long-term trend
- RSI14 at 44.91 sits below the 50 midline, confirming weak buyer conviction without reaching oversold territory
- EMA50 at $902.62 is the critical medium-term support — a daily close below it would decisively shift the bias bearish
- Renewed fears over Chinese memory chip competition triggered the sell-off, dragging Intel, AMD, and Marvell lower alongside MU
Daily Bias: Neutral but Slipping
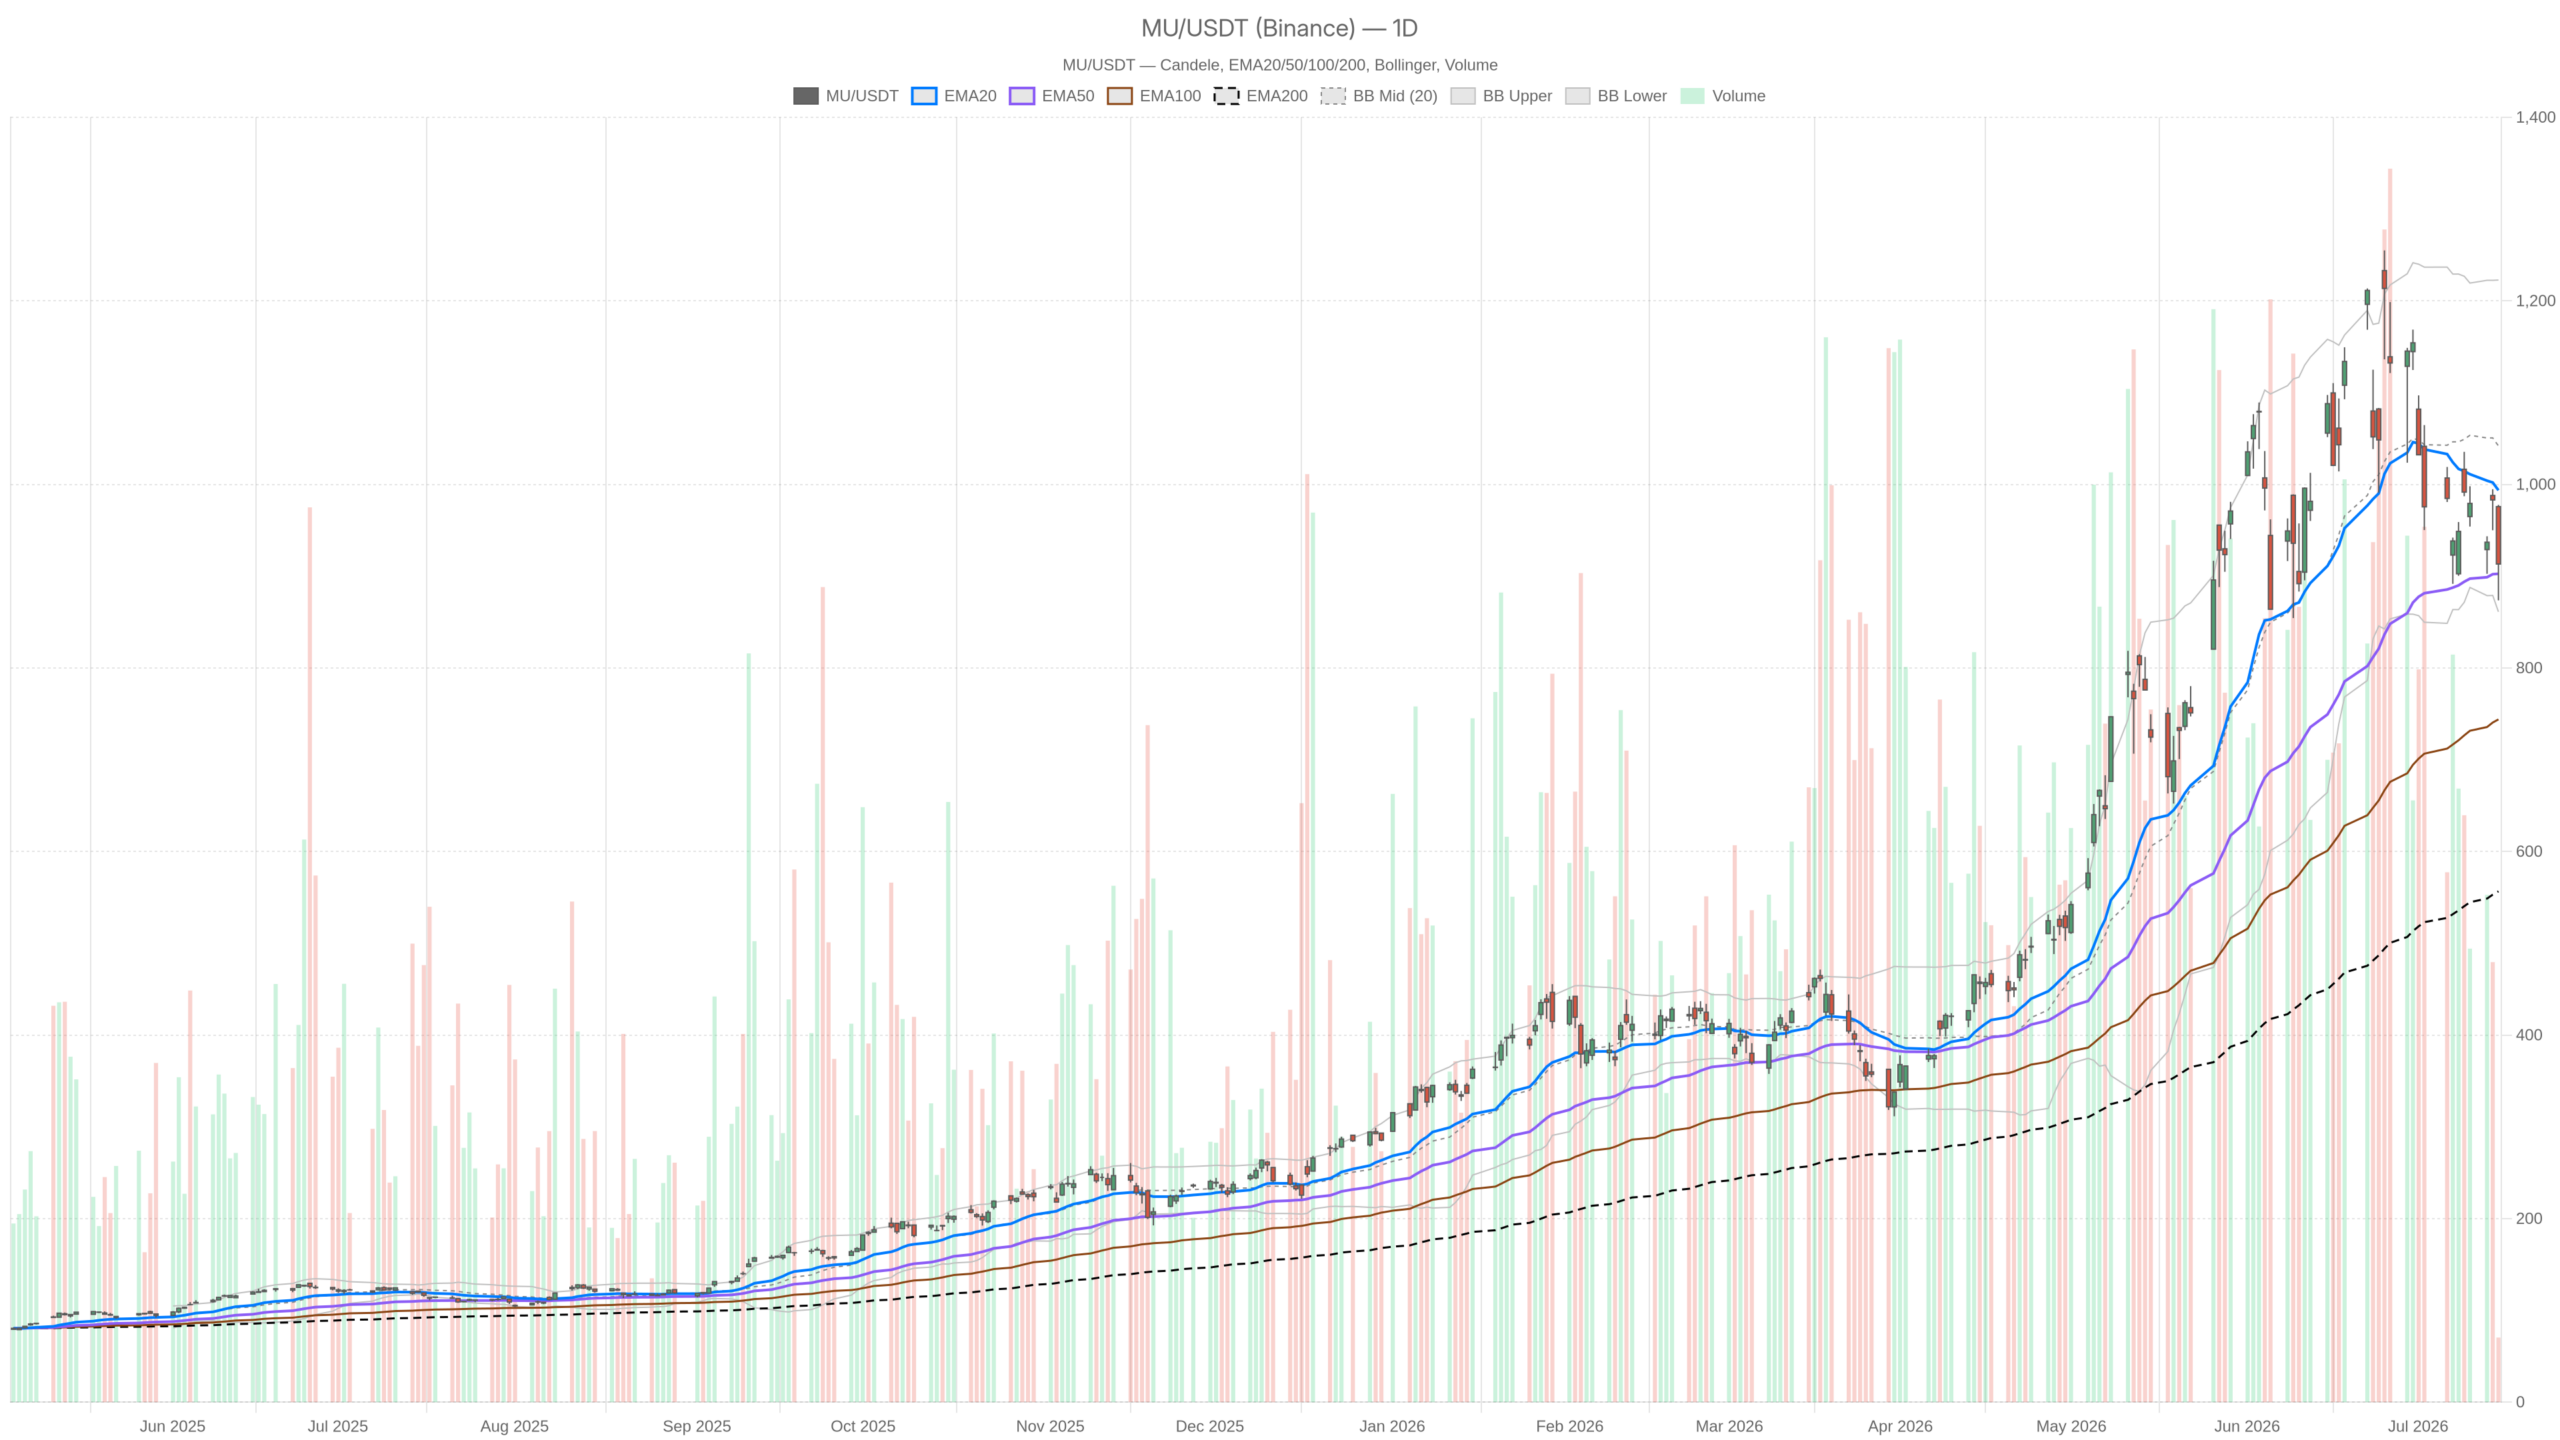
Micron Technology, Inc. stock remains technically neutral on the daily timeframe, but momentum is deteriorating rapidly beneath the surface. Price closed at $913.27, sitting below the EMA20 at $993.62 and above the EMA50 at $902.62. That gap reveals an important story: MU has lost its short-term trend anchor but has not yet surrendered the medium-term one. The EMA200 at $556.59 remains far below current price, confirming the multi-year structural uptrend is intact.
Momentum Indicators Flash Warning
However, the daily MACD is the real warning sign. The MACD line sits at just 1.90, while the signal line stands at 27.91. This produces a deeply negative histogram reading of -26.01. Such divergence indicates momentum has deteriorated sharply even if price hasn’t collapsed entirely.
The RSI14 on the daily at 44.91 adds further context. It sits below the 50 midline, which typically confirms that buyers lack conviction. Still, it is not yet in oversold territory. There is room to fall further before a technical bounce becomes statistically compelling.
Key Technical Levels in Focus
The Bollinger Bands on D1 are wide, with the upper band at $1,222.71 and the lower at $861.21. Today’s close of $913.27 sits in the lower third of that range. The midline at $1,041.96 represents a meaningful distance to the upside. Meanwhile, the ATR14 of $90.99 reflects elevated daily volatility. A $90 average true range means traders should expect large swings in either direction.
The daily pivot structure places the pivot point at $921.55, with S1 at $865.41 and R1 at $969.42. MU closed below its own daily pivot. That marks a mild bearish signal for the session structure.
Hourly Timeframe Confirms the Pressure
The 1H chart for Micron Technology, Inc. stock is explicitly bearish, and the indicators back that up without ambiguity. Price at $913.27 trades below all three key EMAs on the hourly chart. The EMA20 sits at $945.02, the EMA50 at $969.46, and the EMA200 at $989.70. A full EMA stack in descending order with price beneath all three is a textbook distribution pattern.
The hourly MACD reinforces the concern. The MACD line is at -15.66 against a signal of -9.33, yielding a histogram of -6.33. Momentum is negative and the signal line has not yet crossed back up. There is no hourly recovery signal in place.
The hourly RSI at 39.77 is approaching oversold territory without quite touching it. That matters because it suggests further downside is still possible before the tape exhausts sellers. In contrast, a reading closer to 30 would attract more aggressive dip buyers.
On the 1H Bollinger Bands, MU trades in the lower portion of the range. The band lower sits at $882.58 — roughly $30 below current price. If selling accelerates, that level becomes a natural gravitational target. The hourly ATR of $23.54 implies modest but meaningful intraday swings.
15-Minute View: A Small Attempt at Stabilization
At the execution level, the 15-minute chart offers the only mildly constructive reading across all three timeframes. The regime remains bearish, and price sits below the EMA50 at $936.83 and EMA200 at $969.77. Nevertheless, the MACD histogram on the 15m has turned fractionally positive at +2.39. The MACD line, however, remains deeply negative at -15.07. That histogram flip is a micro-signal — not a trend reversal. Instead, it hints that the most intense selling pressure of the session may have eased near the close.
The 15m RSI at 43.66 is similarly inconclusive. It is off the lows but lacks any real upward momentum. The 15m pivot at $911.46 was essentially tested and held by the close at $913.27. That offers minor support confirmation. This is execution context, not a thesis. Short-term traders may note stabilization, but the broader picture hasn’t changed.
The News Catalyst: China Competition as a Structural Risk
The fundamental trigger for Micron Technology, Inc. stock’s sell-off was a report on Chinese memory chip makers. The news sent MU dropping approximately 8% and dragged Intel, AMD, and Marvell lower alongside it. The market is now weighing a key question: is this a sector-wide buying opportunity or the start of something more structural?
Just a day earlier, KeyBanc raised its price target on MU. The firm cited tighter supply and higher prices for DRAM, NAND, and high-bandwidth memory. The AI chip trade narrative — particularly around HBM — had been providing fundamental support. That support hasn’t disappeared overnight. However, it is now competing against renewed geopolitical risk perception.
Notably, Seeking Alpha published a piece titled “The Top Is In For Micron.” It argued the memory cycle may have peaked. That view, combined with Barron’s earlier reference to a technical bear market, creates an increasingly cautious narrative backdrop. The bulls still have an AI-driven structural story. The bears have a cycle-peak argument and a China risk overhang.
Bullish Scenario for Micron Technology, Inc. Stock
For Micron Technology, Inc. stock to recover its footing, two conditions must be met. First, MU must reclaim the daily pivot at $921.55. Second, it must sustain trade above the EMA50 at $902.62. A failure to hold $902 on a daily close would remove the last nearby technical support ahead of the Bollinger lower band at $861.21.
Beyond price structure, a bullish recovery would need the hourly EMA stack to begin flattening and converging. The DRAM and HBM supply tightness thesis from KeyBanc remains intact as a fundamental driver. If the China competition report proves less disruptive than feared, sentiment could shift quickly. Upcoming earnings commentary reaffirming HBM pricing power would also help. The AI memory trade has surprised to the upside before.
Bearish Scenario for Micron Technology, Inc. Stock
The bear case for Micron Technology, Inc. stock is already gaining structural support. A daily close below EMA50 at $902.62 would signal that medium-term trend support has failed. From there, the next meaningful daily reference is S1 at $865.41. That level clusters closely with the Bollinger lower band at $861.21, forming a key decision zone.
Furthermore, if the daily MACD continues to deepen its negative histogram, the probability of a sustained bounce diminishes. The memory cycle peak narrative would remove the fundamental floor that has kept longer-term buyers engaged. This risk strengthens if DRAM or NAND spot prices decline further. A sector rotation out of memory chips and into other AI infrastructure plays would amplify the pressure.
Positioning, Volatility, and Uncertainty
Overall, Micron Technology, Inc. stock is in a structurally challenged position on the short and medium-term timeframes. The long-term trend remains technically intact. The daily regime is neutral but trending toward bearish. The hourly regime is already there. Volatility is elevated, with a daily ATR near $91. Position sizing demands respect in this environment.
The next few sessions will be decisive. Bulls need a pivot reclaim above $921 and momentum stabilization on the hourly. Bears need a clean EMA50 break below $902 to press the thesis. Neither outcome is certain. That tension, in a high-ATR environment with competing fundamental narratives, is what makes MU one of the most live trading situations in tech right now.
FAQ
Is Micron Technology, Inc. stock in a bear market?
Not officially on the daily timeframe, which remains classified as neutral. However, the hourly chart is explicitly bearish, and the daily MACD histogram at -26.01 signals deeply negative momentum. Barron’s noted earlier in July that MU had entered a technical bear market, though the multi-year structural uptrend remains intact above the EMA200 at $556.59.
What is the key support level for MU stock?
The most critical support is the EMA50 at $902.62 on the daily chart. A daily close below this level would signal medium-term trend failure. Below that, S1 at $865.41 and the Bollinger lower band at $861.21 form the next key decision zone where buyers would need to step in aggressively.
What triggered the July 15 sell-off in Micron Technology, Inc. stock?
A report on Chinese memory chip makers triggered the 8% intraday collapse on July 15. The news raised fears of increased competition and dragged other semiconductor names including Intel, AMD, and Marvell lower alongside MU. The sell-off pushed the stock from a $975.80 open to a $913.27 close.
Is the long-term trend for MU still intact?
Yes. The EMA200 sits far below current price at $556.59, confirming the multi-year structural uptrend remains intact. The AI-driven demand for high-bandwidth memory (HBM) continues to provide a fundamental underpinning, though near-term risks from Chinese competition and memory cycle concerns have increased materially.
Disclaimer: This article is for informational purposes only and does not constitute financial advice, an investment recommendation, or a solicitation to buy or sell any financial instrument or cryptocurrency. The analysis provided is not indicative of future results. Investing in crypto assets and financial markets carries a high risk of capital loss. Always do your own research (DYOR) and consult a qualified financial advisor before making any decision.
Article produced with the assistance of artificial intelligence and reviewed by the editorial team.
