




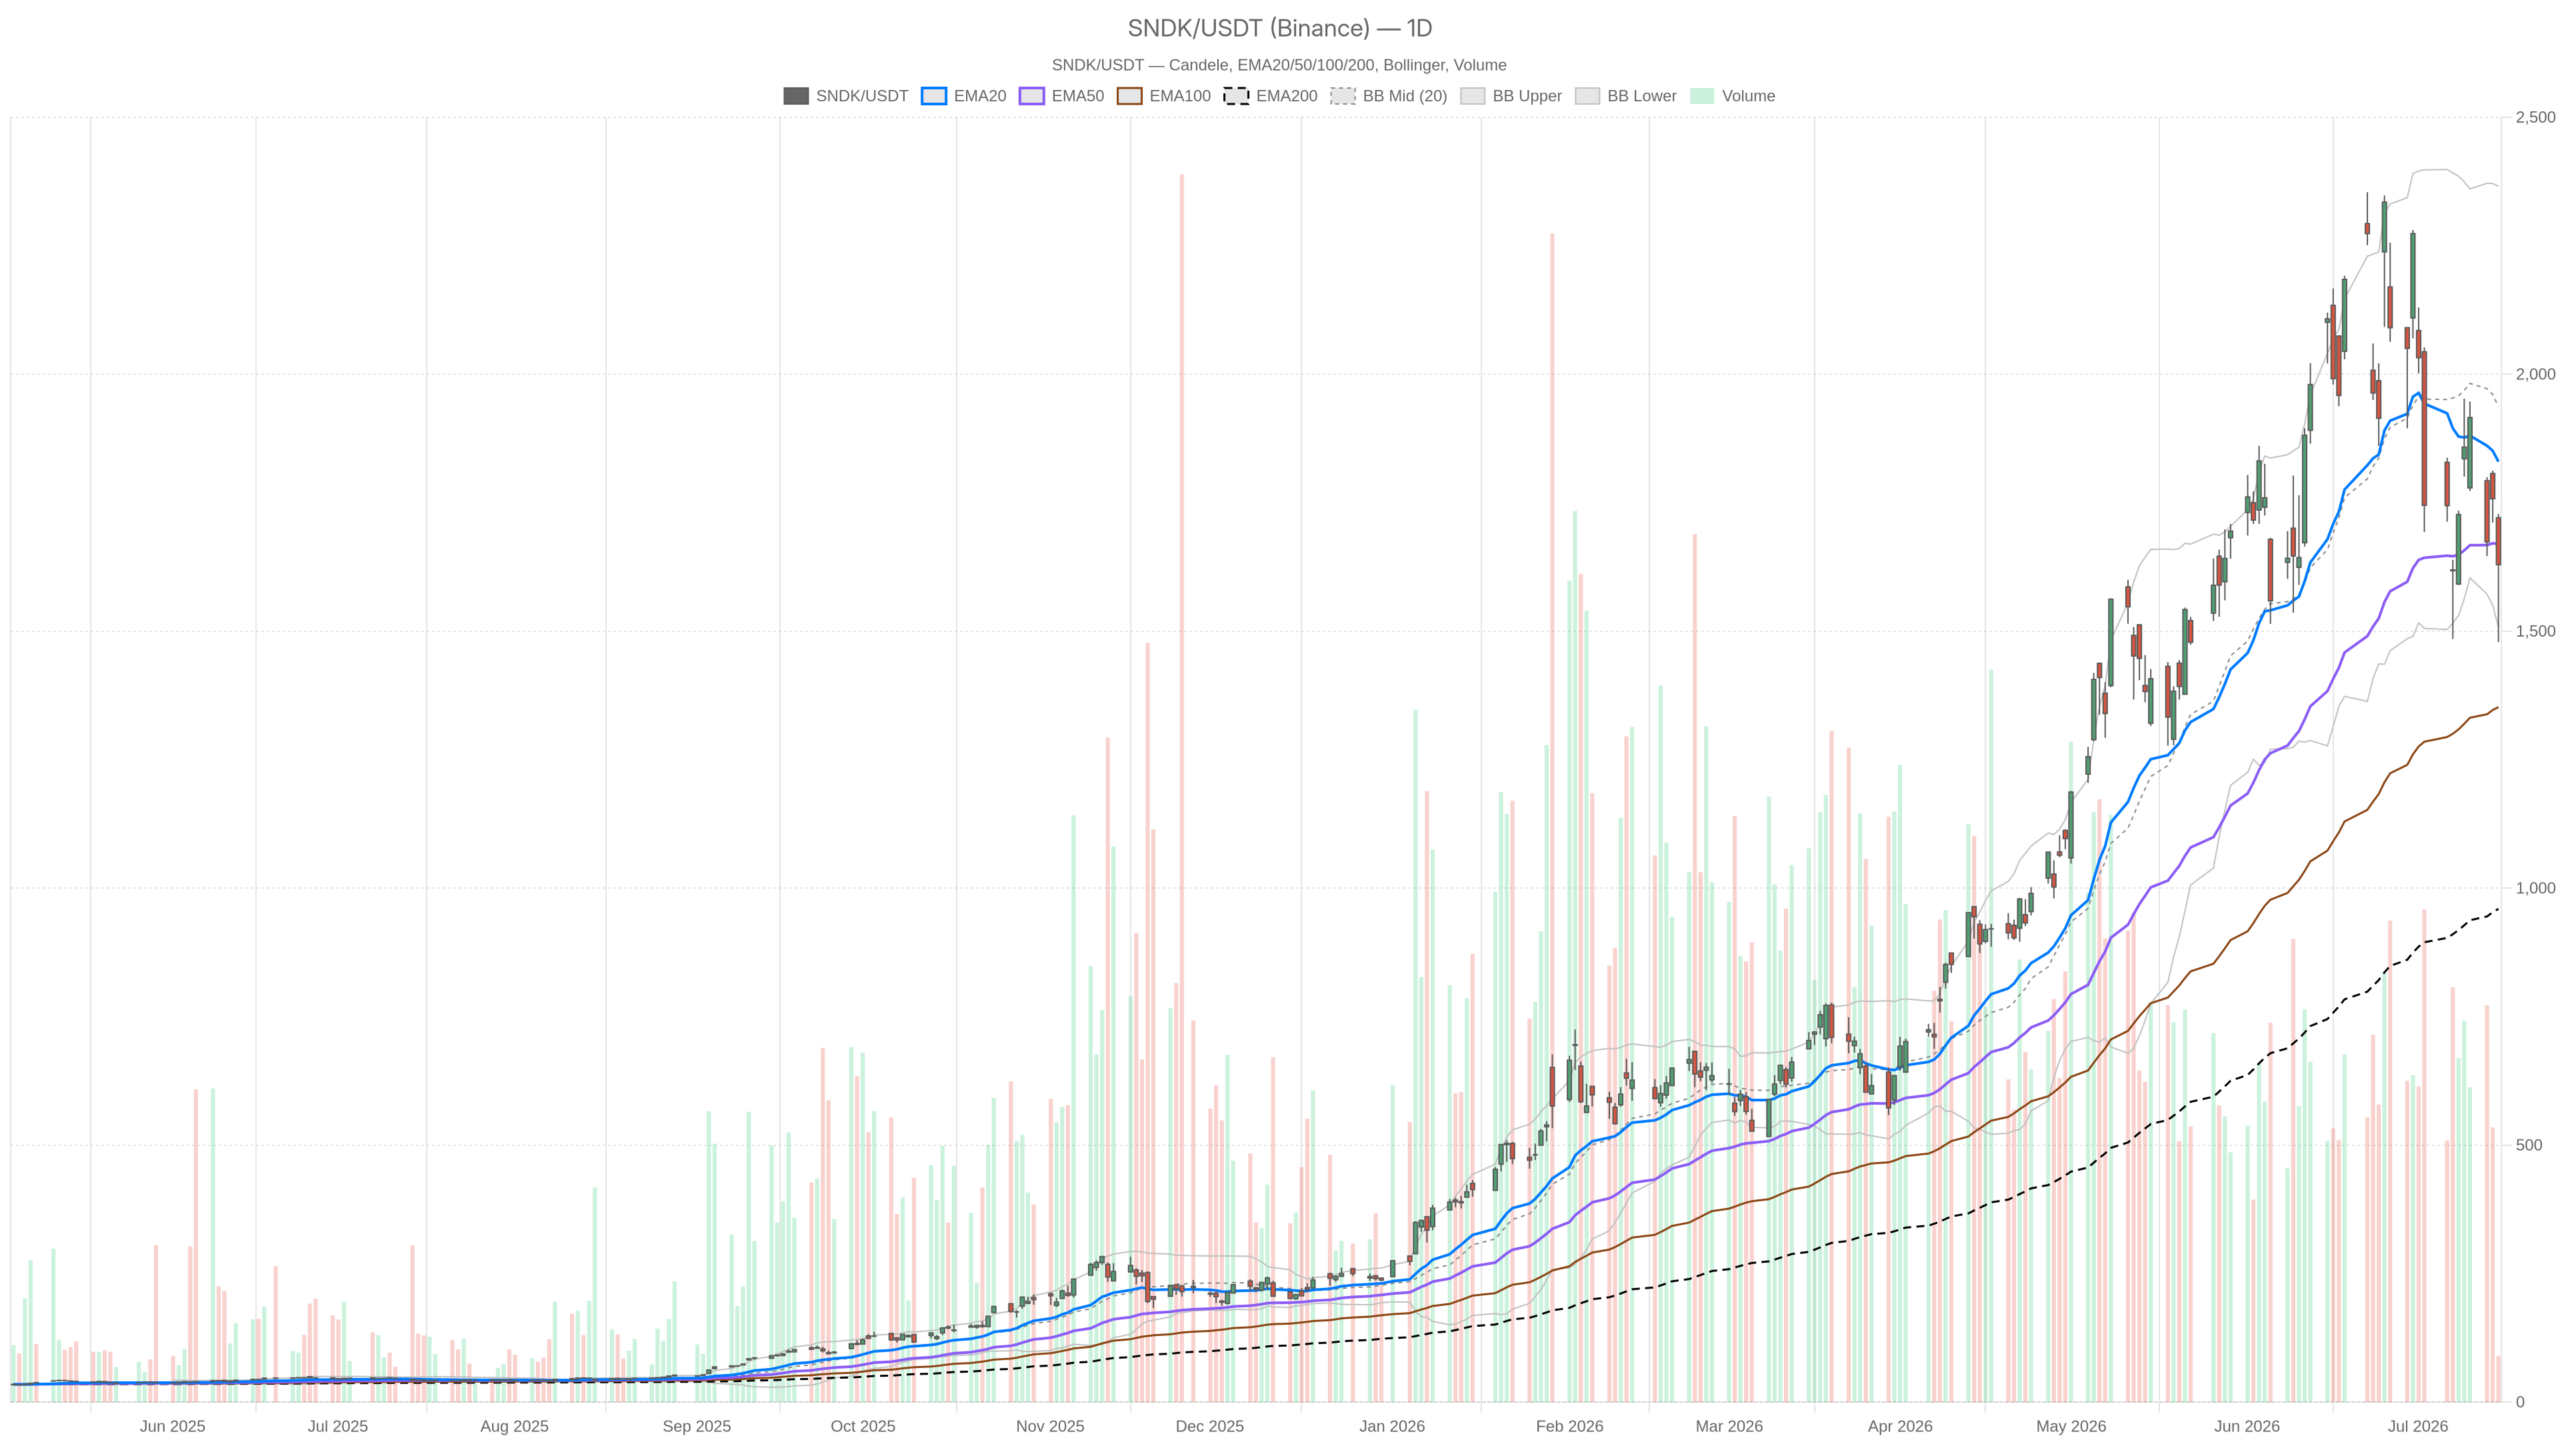
Sandisk Corporation stock faces a critical juncture. After a historic rally — shares reportedly up roughly 4,000% at their peak — the July 15 session revealed growing exhaustion. Price closed at 1,629.54, spanning an intraday range from 1,478.95 to 1,728.19. Uncertainty, not consolidation, now dominates.
Summary
Key takeaways
- SNDK closed at 1,629.54 on July 15, down sharply from an intraday high of 1,728.19.
- The daily MACD histogram sits at -55.47, signaling meaningful downside momentum on the daily chart.
- The 1H timeframe is explicitly bearish, with price trading below all three key EMAs.
- A daily ATR of 241.28 reflects extreme volatility — single-day moves can exceed 200 points.
- Fiscal Q4 2026 earnings on August 5 represent a binary event that could override current technical signals.
Daily Bias: Neutral in Label, Bearish in Character
Sandisk Corporation stock displays a nominally neutral daily regime — yet nearly every indicator beneath the surface points to distribution pressure. The EMA alignment, MACD momentum, and RSI posture all lean bearish despite the neutral label.
The daily EMA stack tells a nuanced story. SNDK trades below its EMA20 at 1,830.01 and presses against its EMA50 at 1,669.58 from below. The EMA200 sits far lower at 959.89, a reminder of the longer-term structural uptrend. However, the immediate trend has clearly rolled over. Closing below the EMA20 after a prolonged rally is rarely a bullish signal.
The daily MACD reinforces the concern. The MACD line sits at -9.05, well below the signal line at 46.42. This produces a histogram reading of -55.47. The reading reflects meaningful downside momentum — not a mild divergence. The momentum that drove the rally has not merely stalled. It has reversed with some force.
Meanwhile, the daily RSI at 44.8 approaches oversold territory without having reached it. Sellers remain in control, yet a capitulation flush has not occurred. Momentum could still deteriorate before any meaningful floor emerges.
Bollinger Bands and Pivot Levels Confirm the Pressure
Bollinger Bands on the daily frame place the midline at 1,936.94, well above the current price. The lower band sits at 1,508.18. Price is therefore trading in the lower half of the daily envelope — a hallmark of stocks under distributional pressure. The ATR14 of 241.28 underscores just how volatile SNDK remains. A single daily move can easily exceed 200 points in either direction.
The daily pivot point at 1,612.23 serves as the immediate reference level. R1 at 1,745.50 marks the first meaningful overhead target. S1 at 1,496.26 is the key support level below — and it closely aligns with the Bollinger lower band. A breach of that zone would be technically significant.
Sandisk Corporation Stock Under Pressure on the Hourly Chart
The 1H timeframe offers no relief to the bullish case. The regime is explicitly tagged as bearish, and the EMA alignment confirms a textbook bearish configuration. All three EMAs stack in descending order above the current price.
Price trades below the 1H EMA20 at 1,691.05, the EMA50 at 1,760.87, and the EMA200 at 1,823.77. This descending EMA stack leaves no ambiguity about the near-term trend direction. Sellers control the intraday structure.
The 1H MACD line at -54.82 sits below the signal at -38.12, with the histogram at -16.71. The histogram is negative but less deeply negative than prior readings. This hints at a slight deceleration in selling pressure. In contrast, it does not constitute a reversal signal. The decline may be pausing — it is not ending.
Resistance Levels and Short-Term Volatility
The 1H RSI at 42.09 echoes the daily reading. Momentum is weak but not yet deeply oversold. The 1H Bollinger midline at 1,700.25 is the resistance level to watch. Price would need to reclaim that level before any meaningful intraday recovery could be argued. The 1H ATR at 67.67 indicates moderately elevated short-term volatility.
The 1H pivot at 1,611.68 closely mirrors the daily pivot, creating a confluence zone. R1 on the hourly at 1,649.58 represents the first overhead test. S1 at 1,591.64 would serve as initial support in a continued decline.
Short-Term Execution Context: A Brief Reprieve on the 15-Minute Chart
The 15-minute frame provides the only mildly constructive signal across all timeframes. The regime is neutral, and the RSI at 53.77 sits just above the midpoint. The MACD histogram has turned positive at 15.00. Price closed the 14:00 candle at 1,633.07 — above the 15m EMA20 at 1,599.30.
However, the 15m EMA50 at 1,659.51 and EMA200 at 1,758.07 remain firmly above price. This is execution-level noise within a larger bearish context, not a structural shift. Traders seeking short-term entries might reference the 15m pivot at 1,626.62 and R1 at 1,639.52 as immediate targets. These levels exist within a much weaker higher-timeframe trend.
Fundamental Backdrop for Sandisk Corporation Stock
Sandisk Corporation stock faces a widening gap between technical exhaustion and fundamental optimism. Two conflicting narratives now compete ahead of the August 5 earnings release.
The technical deterioration coincides with a shifting tone in the analyst community. Two separate Seeking Alpha pieces published on July 15 argue that the best of the SNDK rally may be behind it. One explicitly downgrades the stock to sell. The downgrade cites stretched valuations, pullback risk, and uncertainty around hyperscaler capital expenditure.
On the other hand, Street consensus remains constructive heading into the fiscal Q4 2026 report. The 12-month average analyst price target implies more than 23% upside from recent levels, according to Yahoo Finance. Jim Cramer has also been cited as supportive of the stock. A clear divergence exists between near-term technical exhaustion and longer-term fundamental optimism.
Bullish Scenario: Earnings Could Reignite the Trend
For SNDK bulls to reclaim control, the stock would first need to hold the S1/Bollinger lower band confluence zone around 1,496–1,508 on a closing basis. A recovery above the daily EMA50 at 1,669.58 would mark the first sign of stabilization.
At the same time, a move back toward the 1,745–1,830 zone — between R1 and the EMA20 — would suggest the pullback was corrective rather than distributive. The August 5 earnings date is the most obvious potential catalyst. Strong results and guidance around NAND demand or AI-related storage tailwinds could override current technical weakness. Such a catalyst could push SNDK back into a sustained uptrend.
Bearish Scenario: Valuation Gravity and Technical Deterioration
The bearish case for SNDK is currently better supported by the charts. A failure to reclaim the daily EMA50 at 1,669.58 would leave the path of least resistance pointing lower. A close below S1 at 1,496.26 would open a deeper corrective phase. Limited technical support exists below that threshold.
Notably, the daily MACD’s deeply negative histogram suggests the momentum reversal is already underway. If the 1H bearish regime persists and the 15m bounce fades near R1 at 1,639.52, intraday sellers will likely maintain the advantage. A Seeking Alpha downgrade to sell — combined with hyperscaler capex uncertainty — adds a fundamental layer to the technical pressure.
Sandisk Corporation Stock Positioning: Handle With Caution
Overall, Sandisk Corporation stock is in a technically fragile state. The daily regime is nominally neutral, but nearly every underlying indicator points to distribution. The 1H timeframe is explicitly bearish. The 15m bounce offers a brief reprieve that, in isolation, means very little.
Volatility remains extreme — a daily ATR above 240 points demands significant risk management discipline. The August 5 earnings release introduces binary event risk that could overwhelm technical setups entirely. Analyst consensus may prove correct over a 12-month horizon. Still, the near-term technical structure suggests the path to those targets will not be smooth. Caution and respect for prevailing momentum are warranted.
FAQ
What is the current technical outlook for Sandisk Corporation stock?
The daily regime is nominally neutral, but underlying indicators — including a deeply negative MACD histogram at -55.47 and an RSI at 44.8 — point to distribution pressure. The 1H timeframe is explicitly bearish, with price trading below all three key EMAs. Only the 15-minute chart shows mild constructive signals within a broader decline.
What are the key support and resistance levels for SNDK?
Key support sits at S1 of 1,496.26, which aligns closely with the daily Bollinger lower band at 1,508.18. A breach of this confluence zone would be technically significant. On the upside, the daily EMA50 at 1,669.58 is the first stabilization level. R1 at 1,745.50 and the EMA20 at 1,830.01 represent stronger overhead resistance.
When is Sandisk Corporation’s next earnings report?
Sandisk Corporation is scheduled to report fiscal Q4 2026 earnings on August 5. This event represents a binary catalyst that could override current technical signals. The 12-month average analyst price target implies more than 23% upside from recent levels.
Is the SNDK rally over?
The technical evidence suggests the rally is under significant pressure. The daily MACD has reversed with force, and price has closed below the EMA20 after a prolonged uptrend. However, a recovery above the daily EMA50 and strong fiscal Q4 earnings could reignite bullish momentum. The outcome hinges heavily on the August 5 report.
Disclaimer: This article is for informational purposes only and does not constitute financial advice, an investment recommendation, or a solicitation to buy or sell any financial instrument or cryptocurrency. The analysis provided is not indicative of future results. Investing in crypto assets and financial markets carries a high risk of capital loss. Always do your own research (DYOR) and consult a qualified financial advisor before making any decision.
Article produced with the assistance of artificial intelligence and reviewed by the editorial team.
