



Micron stock faces a critical juncture. After a 304% surge in H1 2026, driven by AI memory demand, a 4.6% intraday drop on July 13 signals profit-taking has arrived. The technical picture across multiple timeframes confirms the market is reassessing fair value.
Summary
Key takeaways
- MU surged 304% in the first half of 2026, fueled by AI-related memory demand
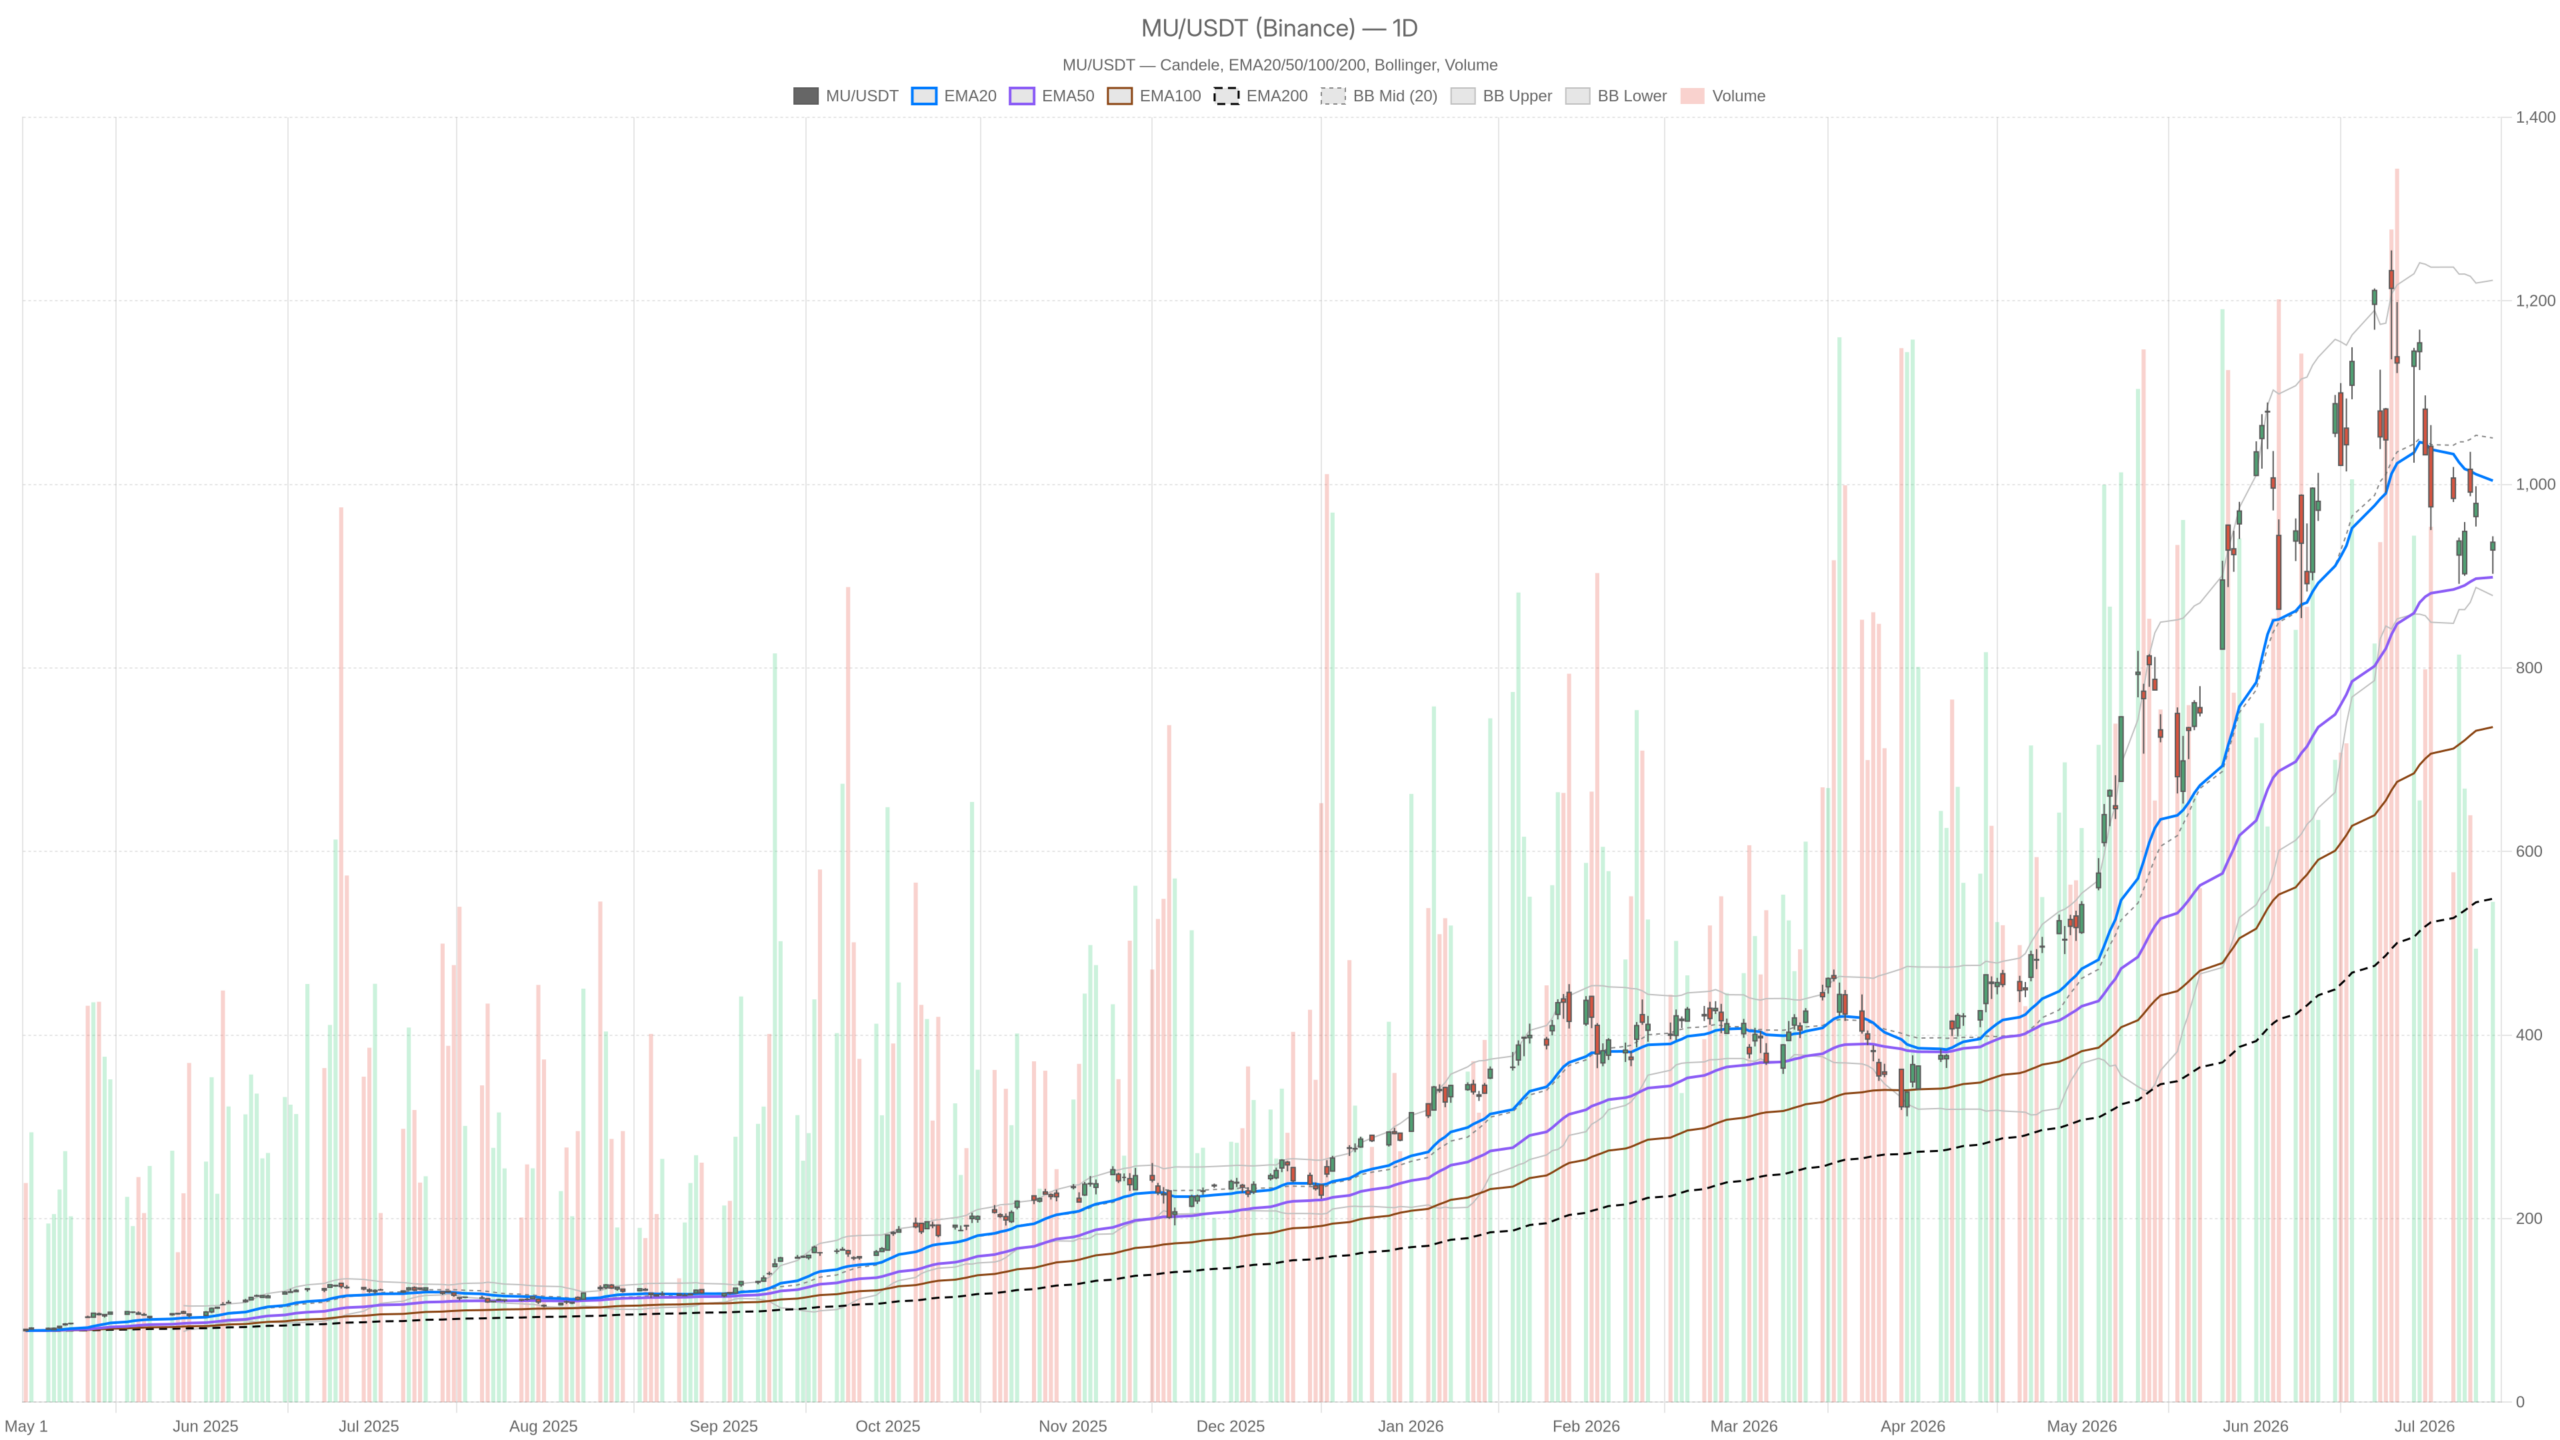
- A 4.6% drop on July 13 pushed the stock below its daily EMA20 at 1,004
- The daily RSI at 46.19 remains neutral, while the hourly regime has turned explicitly bearish
- Key support sits at the daily EMA50 near 898, with the Bollinger lower band at 878
- Daily ATR near 98 points demands that position sizing account for extreme intraday volatility
Daily Bias: Neutral With a Bearish Undertow
Micron stock’s daily chart paints a neutral but deteriorating picture. Price sits below short-term moving average support yet remains above the medium-term trend.
Meanwhile, MU closed at 937 on July 13, below its EMA20 at 1,004 and just above its EMA50 at 898. That positioning is telling. The stock has already surrendered its short-term moving average. However, it has not yet breached the medium-term trend. Technically, it is suspended between two competing forces.
At the same time, the daily RSI at 46.19 is neutral but trending in the wrong direction. It is not yet oversold, meaning there is statistical room for further downside before momentum exhaustion kicks in.
The MACD adds more concern. The line sits at 11.83, while the signal is at 40.66. This produces a histogram of -28.83. That negative depth reflects a momentum crossover that is far from mild. It signals a clear deterioration in upward momentum, even though the line itself remains positive.
The Bollinger Band picture reinforces the tension. The midline sits at 1,050, well above current price. MU trades in the lower half of its daily range, approaching but not yet touching the lower band at 878.
That lower band is close enough to act as meaningful support. Yet being this far from the midline underscores how extended the pullback has become. Meanwhile, daily ATR at 97.99 is significant. On a stock near 937, that represents roughly 10% of price in average daily range. Any directional move will likely be large and fast.
Hourly Timeframe: The Bearish Confirmation
The hourly chart challenges the daily neutral label directly. The 1H regime for Micron stock is explicitly bearish, with all three key EMAs now acting as overhead resistance.
Currently, price at 937 sits below the EMA20 at 958, EMA50 at 984, and EMA200 at 995. This stacked bearish alignment confirms the intraday trend structure has fully inverted. There is no meaningful hourly support from moving averages. All three are acting as resistance zones above current price.
Momentum and Pivot Structure
Meanwhile, hourly RSI at 40.15 approaches oversold levels but has not arrived there yet. It confirms the bearish lean without signaling capitulation. The MACD is more decisive. The line at -14.1 sits below the signal at -8.94, producing a histogram of -5.16. Bearish momentum on this timeframe is active and not yet reversing.
The hourly pivot structure offers a concise roadmap. The pivot point is 935.54. Resistance sits at 943.55, and support at 928.99. MU closed the last hourly candle right at 937. It is pinned between R1 and S1, showing genuine indecision at the session close.
15-Minute Context: Short-Term Stabilization Attempt
The 15-minute view offers a slightly more constructive read for Micron stock. However, it is insufficient to override the higher timeframe signals, with the regime remaining neutral.
Notably, RSI at 47.83 sits near the midpoint, and the 15m MACD histogram has turned positive at 2.64. The line at -6.65 is beginning to cross toward its signal at -9.29. This suggests a minor stabilization attempt within the session. It reads as a short-term bounce effort rather than a meaningful trend reversal.
Still, price closed at 937, above the EMA20 at 935.16 — a marginal positive. Yet it remains below the EMA50 at 950 and well below the EMA200 at 993. The 15m pivot places resistance at 942.24 and support at 931.60. In execution terms, the 937–942 zone is the immediate battle. A clean reclaim of 942 could suggest a bounce toward 950. A break below 931 would reopen the path toward the 907 hourly support.
The Bullish Case: AI Fundamentals and Structural Support
The bullish argument for Micron stock rests on fundamentals that have not changed. One analyst recently doubled down on MU, citing expanding memory capacity and a secured supply chain for AI infrastructure growth.
Notably, that narrative drove the 304% gain in H1 2026, and it remains structurally intact. On the technical side, the daily EMA50 at 898 is the key line in the sand. A test and hold of that level would confirm the pullback as a normal correction within a larger uptrend.
Meanwhile, the daily EMA200 at 548 sits far below. This stark gap underscores how much ground MU has already covered. For longer-horizon bulls, the 878–899 zone represents a potential high-conviction entry window if reached. A recovery above the daily EMA20 at 1,004 would signal resumption of the primary trend.
The Bearish Case: Sentiment Headwinds and Valuation Pressure
The bearish risks for Micron stock are not trivial. President Trump has reportedly been a net seller of MU and a net buyer of Nvidia this year. While individual selling carries limited systemic weight, the optics can reinforce existing profit-taking impulses.
Furthermore, SK Hynix — a direct competitor — may be closing a longstanding valuation discount to Micron. If that gap narrows, MU’s relative premium becomes harder to justify without continued earnings outperformance. The July 13 selloff itself was attributed to profit-taking after the sector’s strong H1 rally and escalating Middle East tensions.
Moreover, if macro risk appetite deteriorates further, high-beta names like MU tend to sell off faster and deeper than the broader market. In this scenario, a failure to hold the EMA50 near 898 on the daily would be a serious technical warning. Below that, the Bollinger lower band at 878 is the last meaningful daily support. A close below both would likely trigger accelerated selling and shift the daily regime firmly bearish.
Positioning in a High-Volatility Environment
Overall, Micron stock sits at a technically and narratively complex inflection point. The daily structure remains neutral and the long-term trend is unquestionably bullish. Yet the hourly bearish regime and stalled momentum suggest the path of least resistance in the near term is lower.
In short, the stock is caught between an AI growth story that has not faded and a market that has simply run hard enough to need a pause. Given daily ATR near 98 points, position sizing must account for extreme intraday volatility.
Therefore, traders watching for entries should focus on the 928–898 support corridor as the key zone. The 943–952 resistance area is the level bulls must reclaim to shift short-term momentum. Until price resolves this range with conviction, uncertainty remains elevated on both sides.
FAQ
What caused Micron stock’s 4.6% drop on July 13?
The selloff was attributed to profit-taking after the semiconductor sector’s strong H1 2026 rally and escalating Middle East tensions weighing on risk appetite.
Where is the key support level for MU right now?
The daily EMA50 near 898 is the critical support. Below that, the Bollinger lower band at 878 provides the next meaningful floor. The 928–898 corridor is the zone to watch.
Is Micron stock’s long-term bullish trend still intact?
The long-term trend remains structurally bullish, supported by AI memory demand fundamentals. However, a close below the EMA50 at 898 would be a serious technical warning.
What would signal a bullish reversal for MU?
A recovery above the daily EMA20 at 1,004 would signal resumption of the primary uptrend. On the shorter term, a clean reclaim of the 942–952 resistance zone is needed to shift intraday momentum.
Disclaimer: This article is for informational purposes only and does not constitute financial advice, an investment recommendation, or a solicitation to buy or sell any financial instrument or cryptocurrency. The analysis provided is not indicative of future results. Investing in crypto assets and financial markets carries a high risk of capital loss. Always do your own research (DYOR) and consult a qualified financial advisor before making any decision.
Article produced with the assistance of artificial intelligence and reviewed by the editorial team.
