




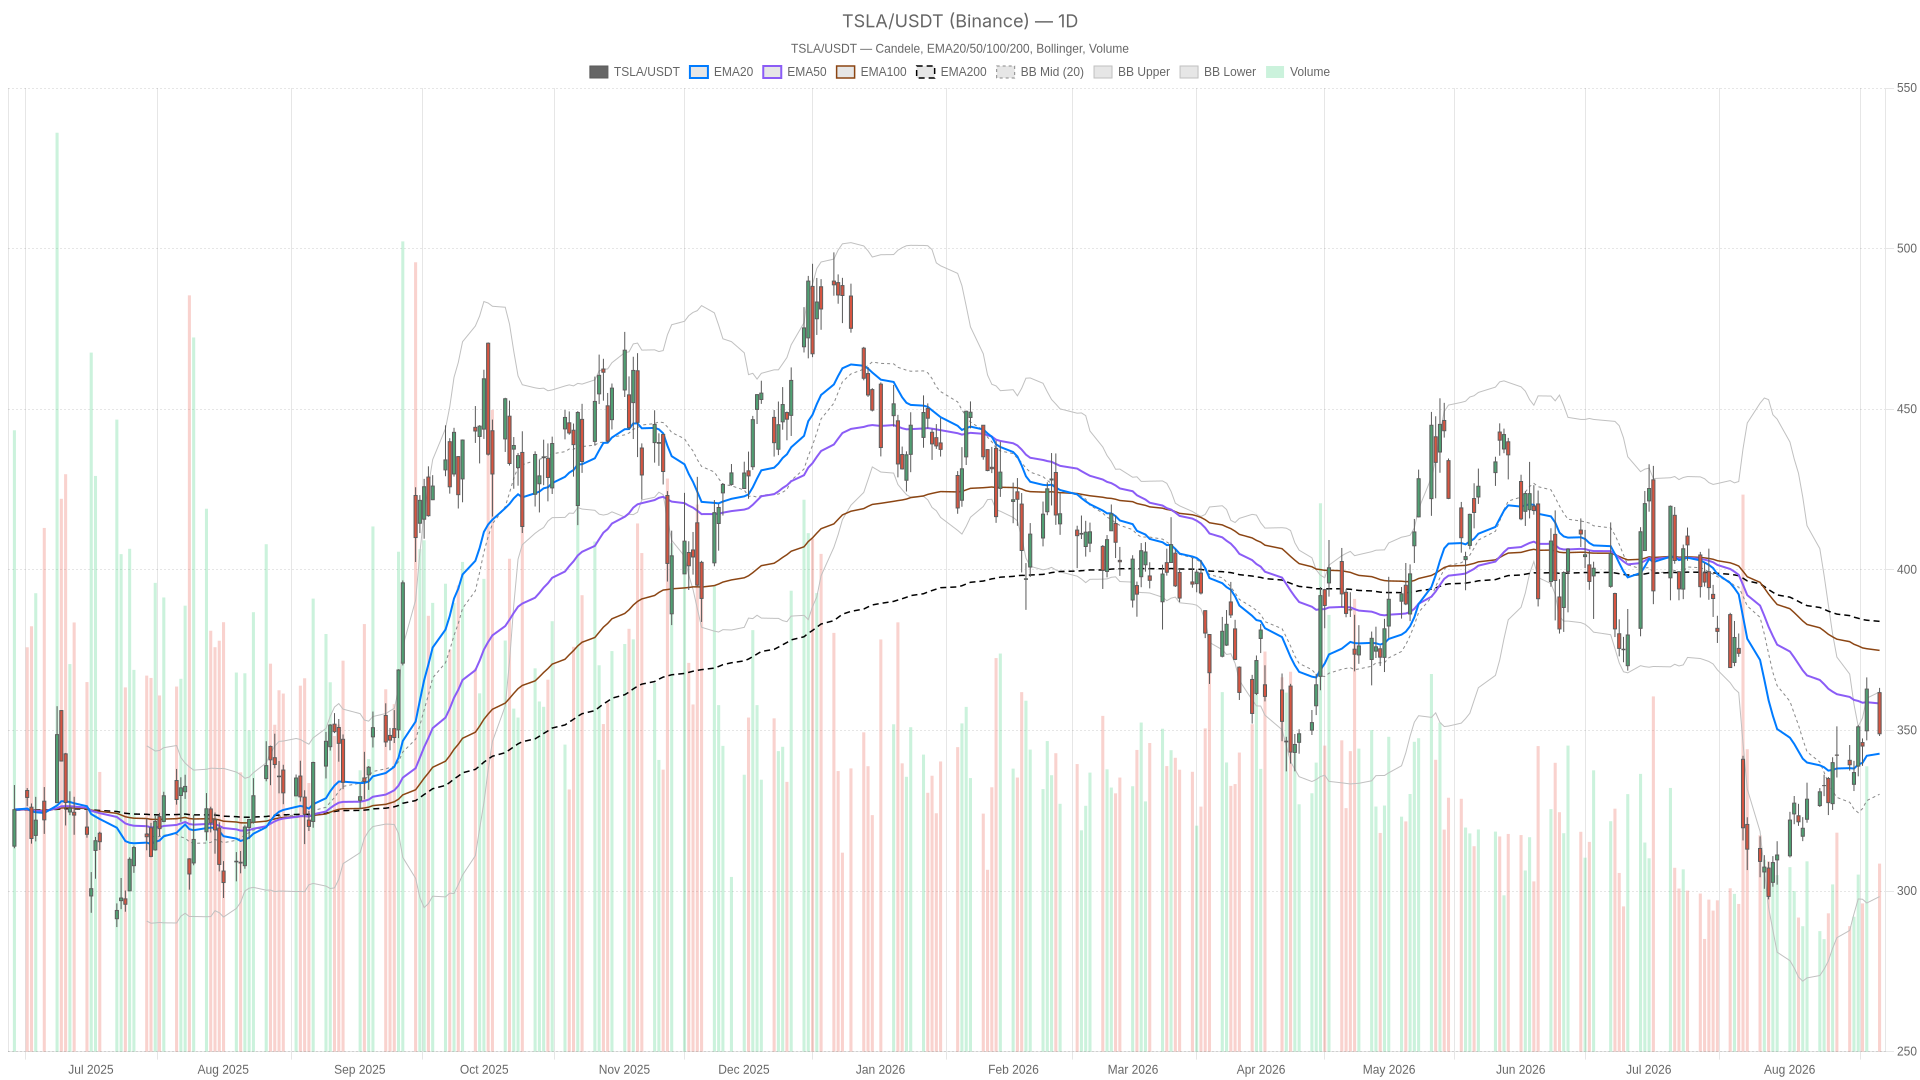
Tesla stock closed Monday at 348.95, sharply off its 363.24 intraday high. A recall affecting nearly 3 million vehicles in China dragged shares down close to 4%. The rejection candle settled near the low of the range, sending a cautious message even as some momentum readings argue otherwise.
Summary
Key takeaways
- Tesla stock closed Monday at 348.95, down close to 4% after a China recall covering nearly 3 million vehicles.
- The daily MACD prints a bullish crossover (histogram 5.64), but the rejection from 363.24 undercuts that signal.
- Price holds above the 20-day EMA (342.75) yet sits roughly 9% below the 200-day EMA (383.95).
- The 1-hour RSI (45.52) and negative MACD histogram (-1.53) confirm fading intraday momentum.
- Key levels: daily pivot 353.48, support at 343.73, resistance at 358.71.
Tesla Stock Price Structure: Caught Between Recovery and Rejection
Tesla stock is caught between recovery and rejection on the daily chart, trading above its 20-day EMA but below its 50-day and 200-day averages. That positioning keeps the broader structure tilted toward a longer-term downtrend rather than a confirmed reversal.
The 200-Day Gap Defines the Broader Trend
On the daily timeframe, Tesla trades above its 20-day EMA at 342.75 but remains below the 50-day EMA at 358.39 and the 200-day EMA at 383.95. Price sits roughly 9% under the 200-day average, reinforcing the longer-term downtrend bias. The daily RSI at 51.35 is essentially neutral, offering no strong directional edge on its own.
MACD Crossover vs. Price Rejection
The daily MACD line sits at -2.51 against a signal of -8.15, producing a positive histogram of 5.64. That is a bullish crossover signature, suggesting momentum is turning up after a stretch of selling. However, the same candle produced a sharp rejection from 363.24 down to a 348.95 close, undercutting the optimism embedded in that crossover. This is a clear conflict: momentum indicators are improving structurally, while price action shows renewed selling pressure at resistance.
Bollinger Bands and the Pivot Battle Zone
The daily Bollinger setup reinforces the sense of indecision. Price at 348.95 sits between the mid-band at 330.13 and the upper band at 362. Meanwhile, ATR14 at 11.95 confirms volatility remains elevated. The daily pivot at 353.48 acts as the key line in the sand; Tesla closed below it. Support at 343.73 and resistance at 358.71 define the near-term battle zone.
1H Timeframe: Momentum Fading Into the Close
The 1-hour chart weakens rather than confirms the daily MACD’s bullish hint, with momentum fading into the close. Price at 348.94 trades below its 20-period EMA at 353.30 but above the 50 and 200-period EMAs at 347.08 and 345.46. That mixed setup reflects a market losing steam into the session’s end.
Meanwhile, the 1H RSI at 45.52 leans soft. The MACD histogram has turned negative at -1.53, with the MACD line at 2.39 crossing under its signal at 3.92. That is a clear loss of intraday momentum.
In other words, the 1H structure aligns more with the daily’s bearish rejection candle than with its bullish MACD crossover. Price hovers just under the hourly pivot at 349.66, with support at 347.68 close by. Therefore, the near-term tape looks fragile. The burden of proof sits with the bulls to reclaim that pivot convincingly.
15-Minute Execution Context
On the 15-minute chart, RSI has dropped to 34.2, approaching oversold territory while price hugs the lower Bollinger band. Price at 348.94 sits almost exactly on the lower Bollinger band at 348.04. The MACD histogram remains negative at -0.59, consistent with ongoing short-term selling.
This combination of oversold RSI plus a touch of the lower band often precedes at least a short-term bounce attempt. Still, it does not by itself change the broader picture. The 15m pivot at 349.27 and support at 348.07 are the levels to watch for any immediate reaction.
What Would Support the Bullish Case for Tesla Stock
For bulls, the path forward starts with reclaiming the daily pivot at 353.48. A close back above that level would go a long way toward validating the positive daily MACD histogram. A subsequent push through the 50-day EMA at 358.39 and the daily R1 at 358.71 would strengthen that case.
On the news side, the upcoming Cybercab launch event in Austin on September 3 is a scheduled catalyst. It ties to Tesla’s robotaxi ambitions and could shift sentiment if the market reads it as evidence of tangible progress on self-driving. A recovery of the 1H EMA20 at 353.30 would add confirmation. If RSI improves and the MACD line crosses back above its signal, the rejection candle would look more like noise than a trend change.
What Would Confirm the Bearish Scenario
A break below the daily S1 at 343.73 would open the door toward the 20-day EMA at 342.75. Further down, the Bollinger mid-band at 330.13 becomes the next reference. That would invalidate the bullish daily MACD crossover. It would also confirm that Monday’s rejection candle was the start of renewed downside pressure rather than a temporary pullback.
News flow adds weight to this risk. The China recall covering nearly 3 million vehicles is a fresh headline overhang. Separate reporting questions Cybertruck demand strength following its $5,000 price hike. The shutdown of the premium Solar Roof product points to another area where Tesla’s growth narrative is being tested. If the 1H and 15m charts continue printing lower highs beneath their respective EMA20 levels, that would reinforce the bearish read.
Closing Take on Tesla Stock
Tesla stock (TSLA) sits at a genuine inflection point. Daily momentum indicators and daily price action are telling different stories, and the 1-hour chart currently sides with the more cautious interpretation. Volatility remains elevated, as shown by the daily ATR14 of 11.95. Swings in either direction should be expected rather than seen as unusual.
At the same time, scheduled catalysts like the September 3 Cybercab event sit alongside fresh negative headlines from the China recall. That keeps the near-term outlook genuinely two-sided. Given this mix of conflicting signals across timeframes, patience around the key pivot and support levels seems more useful than committing to a single direction before price confirms it.
FAQ
Where did Tesla stock close on Monday, and what drove the decline?
Tesla stock closed at 348.95, down close to 4%, after a recall announcement affecting nearly 3 million vehicles in China rattled sentiment. The session’s intraday high was 363.24.
Is Tesla’s daily momentum bullish or bearish right now?
The picture is mixed. The daily MACD shows a bullish crossover with a positive histogram of 5.64, but the sharp rejection from 363.24 to 348.95 undercuts that signal. The 1-hour chart also shows fading momentum.
What are the key levels to watch on Tesla stock?
The daily pivot sits at 353.48, with support at 343.73 and resistance at 358.71. On the 1-hour chart, the pivot is 349.66 with support at 347.68.
What upcoming catalyst could shift sentiment?
The Cybercab launch event in Austin on September 3, tied to Tesla’s robotaxi ambitions, is a scheduled catalyst that could shift sentiment.
Disclaimer: This article is for informational purposes only and does not constitute financial advice, an investment recommendation, or a solicitation to buy or sell any financial instrument or cryptocurrency. The analysis provided is not indicative of future results. Investing in crypto assets and financial markets carries a high risk of capital loss. Always do your own research (DYOR) and consult a qualified financial advisor before making any decision.
Article produced with the assistance of artificial intelligence and reviewed by the editorial team.
