

Nvidia stock maintains a structurally bullish posture as it enters early June, but price action signals that the easy gains may be behind us. After closing at $222.82 on June 2, NVDA trades above all three major daily exponential moving averages, yet momentum is weakening near key resistance around $232.
Summary
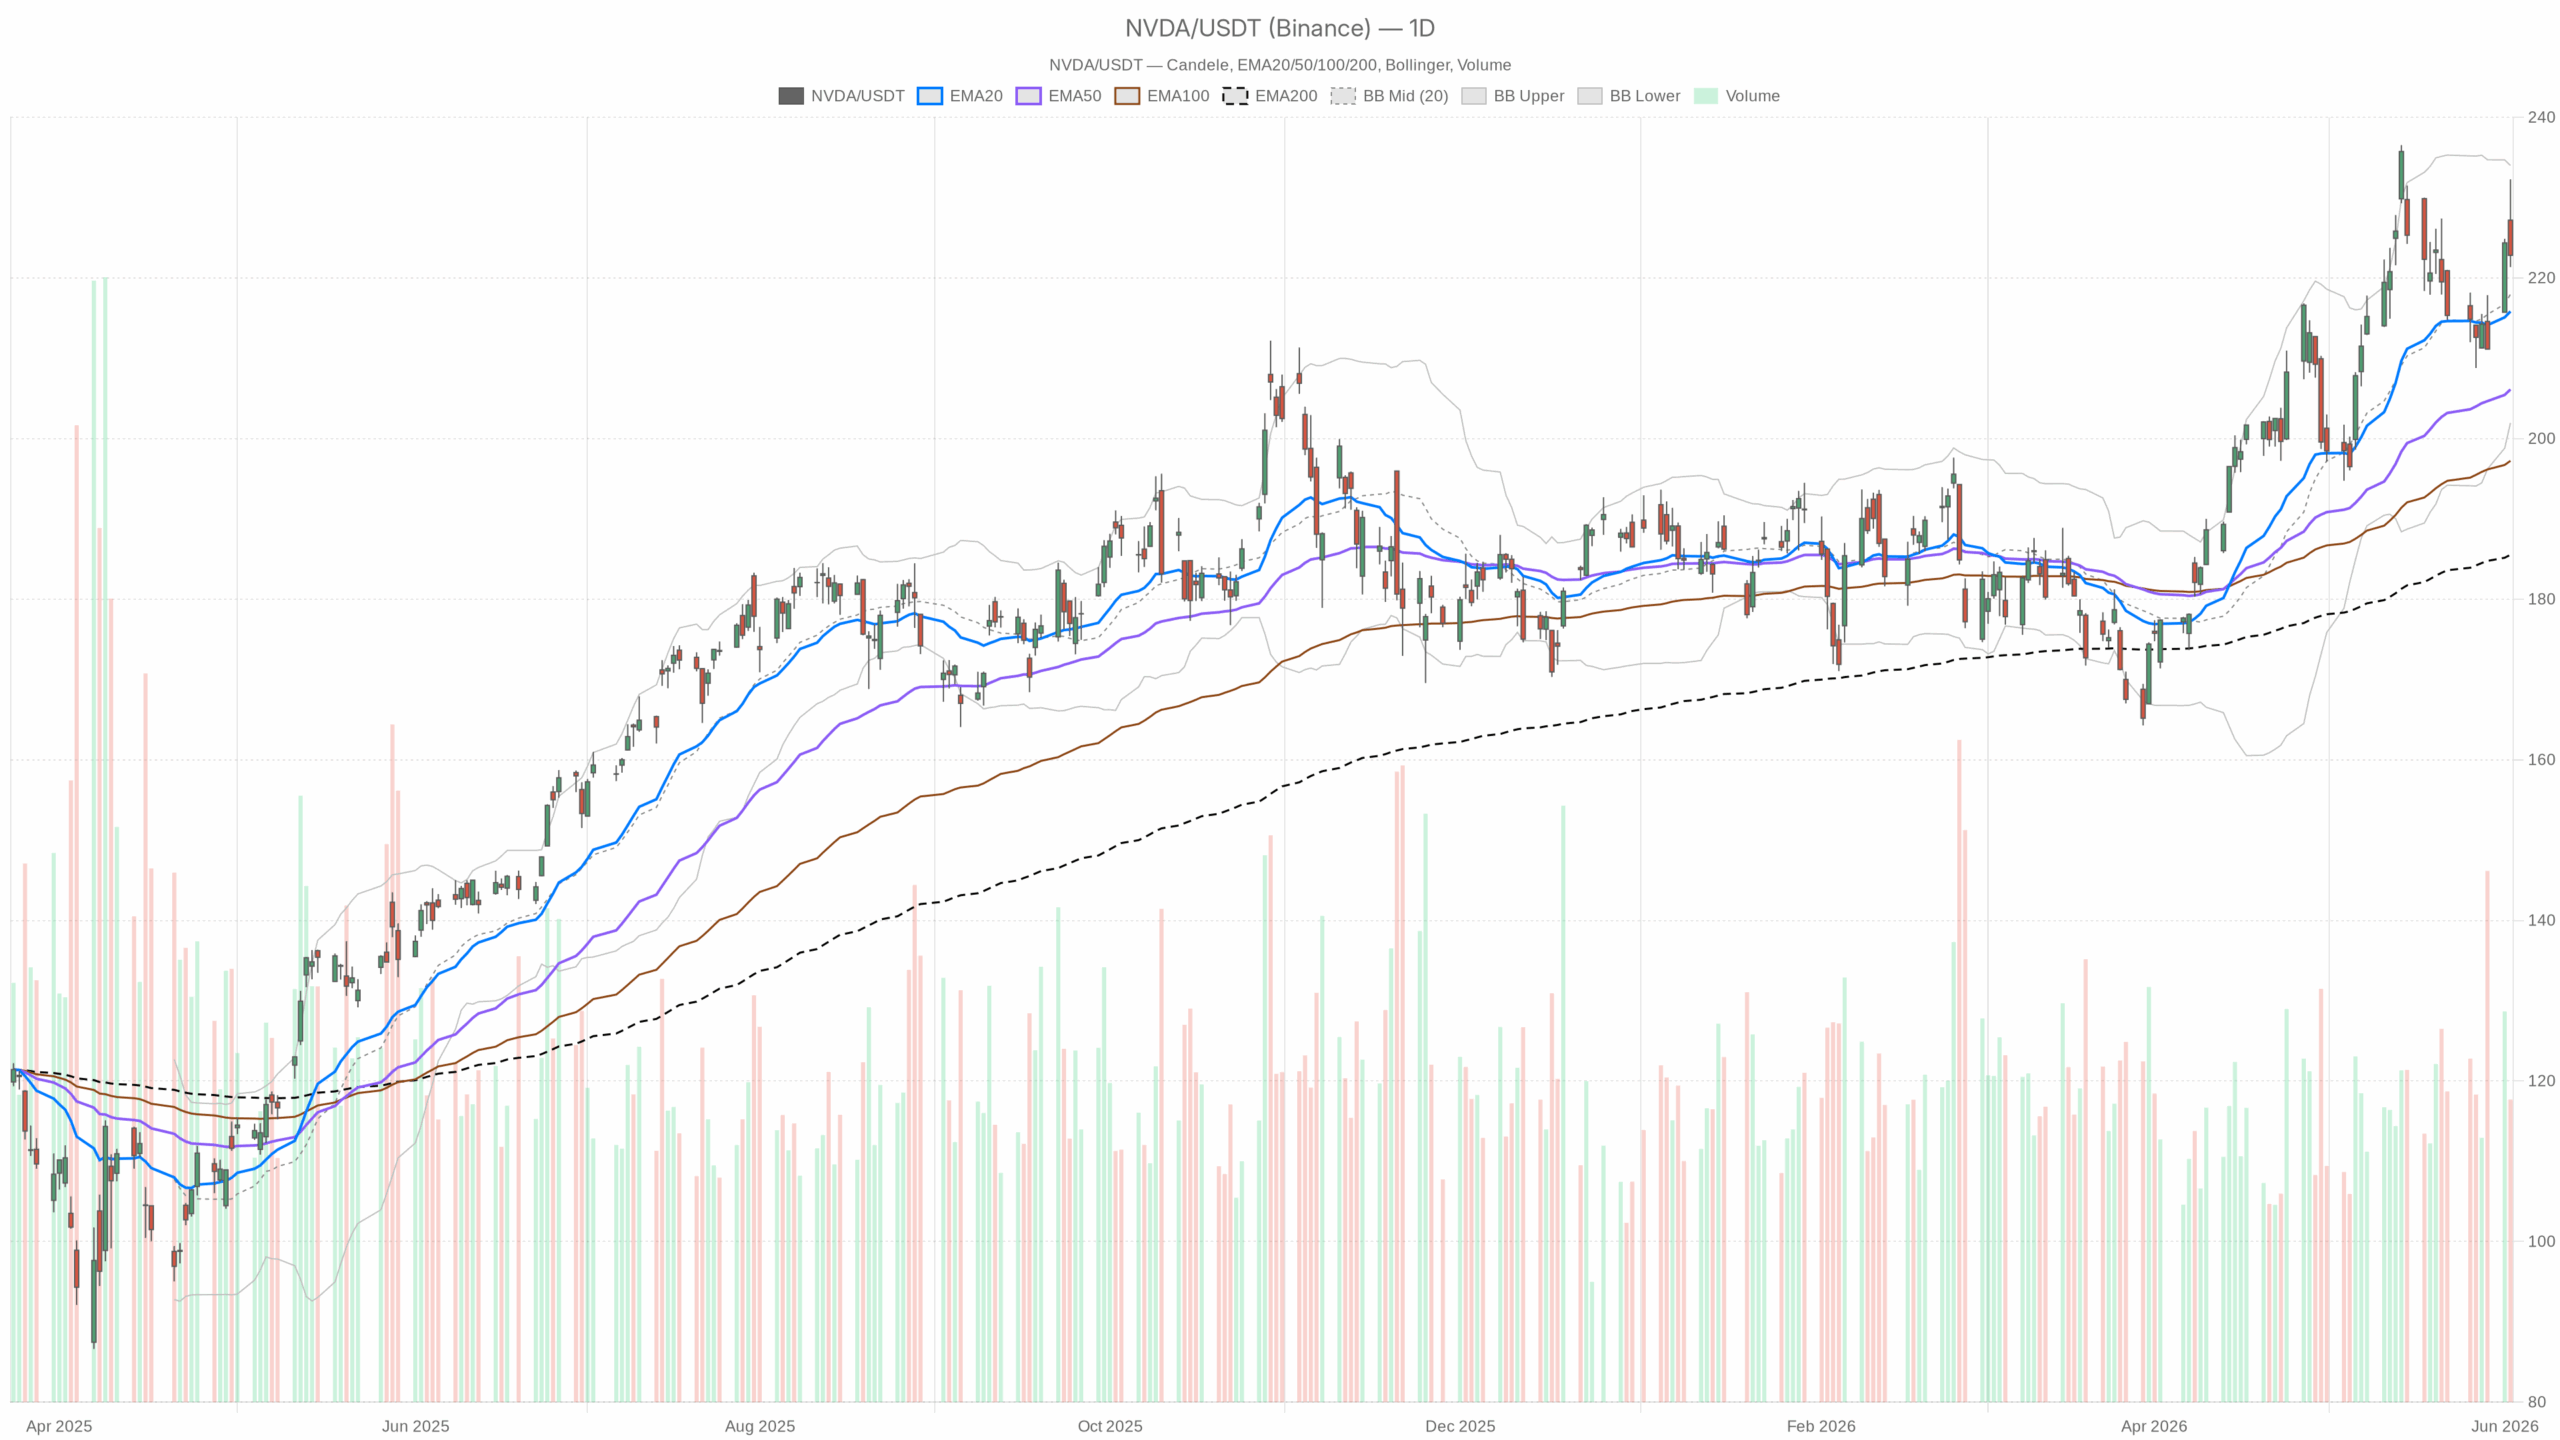
Daily Technical Setup for Nvidia Stock
The daily EMA configuration remains cleanly bullish. The EMA20 at $215.83, EMA50 at $206.12, and EMA200 at $185.53 are all well aligned with price trading comfortably above them. This spacing indicates buyer control has been sustained over an extended period. However, the daily MACD hints at a slowdown: the MACD line at 4.34 sits below the 5.36 signal line, creating a negative histogram of -1.02. This signals momentum deceleration, not yet a reversal.
The daily RSI at 58.79 supports a cautiously optimistic view, as the stock is not overbought, leaving space to move toward 70 before exhaustion risks rise. Meanwhile, the Bollinger Bands daily upper band at $233.99 and lower band at $201.95 frame price action closely. The June 2 high of $232.28 touched the upper band but closed much lower at $222.82, a classic upper-band rejection indicating likely short-term consolidation.
Daily average true range (ATR) of $8.34 confirms NVDA remains a volatile asset where sizable moves can occur quickly in either direction.
Daily Pivot Levels and Short-Term Resistance
Pivot analysis adds nuance to the near-term outlook. The daily pivot point is $225.48, with resistance at $229.62 and support at $218.69. NVDA closed below its pivot point, which weighs mildly on the short-term tone. Regaining and holding $225.48 on a closing basis would notably improve the immediate bullish outlook.
Intraday Momentum and Consolidation Patterns
Hourly Chart Confirms Bullish Bias but Momentum Stalls
On the one-hour chart, the bullish EMA stack remains intact with EMA20 at $221.50, EMA50 at $219.34, and EMA200 at $212.81. Price holds just above the EMA20, but the 1H MACD line’s marginal dip below its signal line and a nearly flat histogram (-0.07) signal stalled intraday momentum rather than a reversal. The 1H RSI at 55.78 is neutral to mildly positive, suggesting consolidation within an overall uptrend.
Shorter-Term Signals Indicate Cautious Pullback
The 15-minute timeframe points to a more cautious microstructure. The 15m MACD is negative, with the line at -0.49 and a worsening histogram at -0.33. RSI here has dipped just below neutral at 45. These readings signal a neutral short-term regime, neither confirming nor negating the daily bullish setup. Currently, price sits below the 15m EMA20 and EMA50, consistent with a small pullback in play.
Fundamental Catalysts Supporting Nvidia Stock
Fundamentally, Nvidia’s backdrop remains supportive. The recent RTX Spark PC processor launch marks a significant market expansion beyond GPUs. Goldman Sachs reiterated bullish views, suggesting further upside potential. Meanwhile, CEO Jensen Huang’s endorsement of Marvell as an AI semiconductor partner strengthens Nvidia’s standing in the AI infrastructure ecosystem, sustaining institutional interest.
However, there is a notable risk factor: a Reuters report disclosed Taiwan prosecutors are investigating suspected chip smuggling involving individuals tied to Nvidia’s supply chain. While not an immediate earnings threat, this geopolitical and regulatory concern requires monitoring, especially given sensitivities around AI chip exports and trade restrictions.
Nvidia Stock Bullish and Bearish Scenarios to Monitor
The base-case bullish scenario calls for NVDA to reclaim and hold $225.48 on a closing basis, then break resistance at $229.62 ideally accompanied by a recovering MACD histogram. A breakout above the daily Bollinger Band upper limit at $233.99 on strong volume would signal sustained trend continuation, supported by fundamental catalysts.
Conversely, failure to regain the $225.48 pivot followed by a breakdown below $218.69 support would open the door to a deeper pullback toward the EMA20 at $215.83. A close below $215 would challenge the bullish structure seriously. The daily MACD crossover acts as a caution signal; if momentum fades further, the correction could deepen beyond typical expectations.
Summary: Nvidia Stock Holds Uptrend Amid Momentum Pause
In summary, Nvidia stock remains in a well-defined uptrend with clear signs of institutional accumulation. Yet near-term momentum signals indicate a pause rather than continuation. Elevated volatility, a long upper wick on the daily candle near the Bollinger Band ceiling, and mixed indicators across timeframes highlight entry risks. Patience is warranted. Waiting for clarity around the $225 daily pivot before increasing directional exposure represents a prudent approach given the current tape action.