



Intel Corporation stock closed at $101.88 on July 15, well below the 20-day and 50-day exponential moving averages. The daily bias leans bearish, yet fundamental catalysts — analyst upgrades and AI manufacturing expansion — are building a competing narrative ahead of the July 23 earnings report.
Summary
Key takeaways
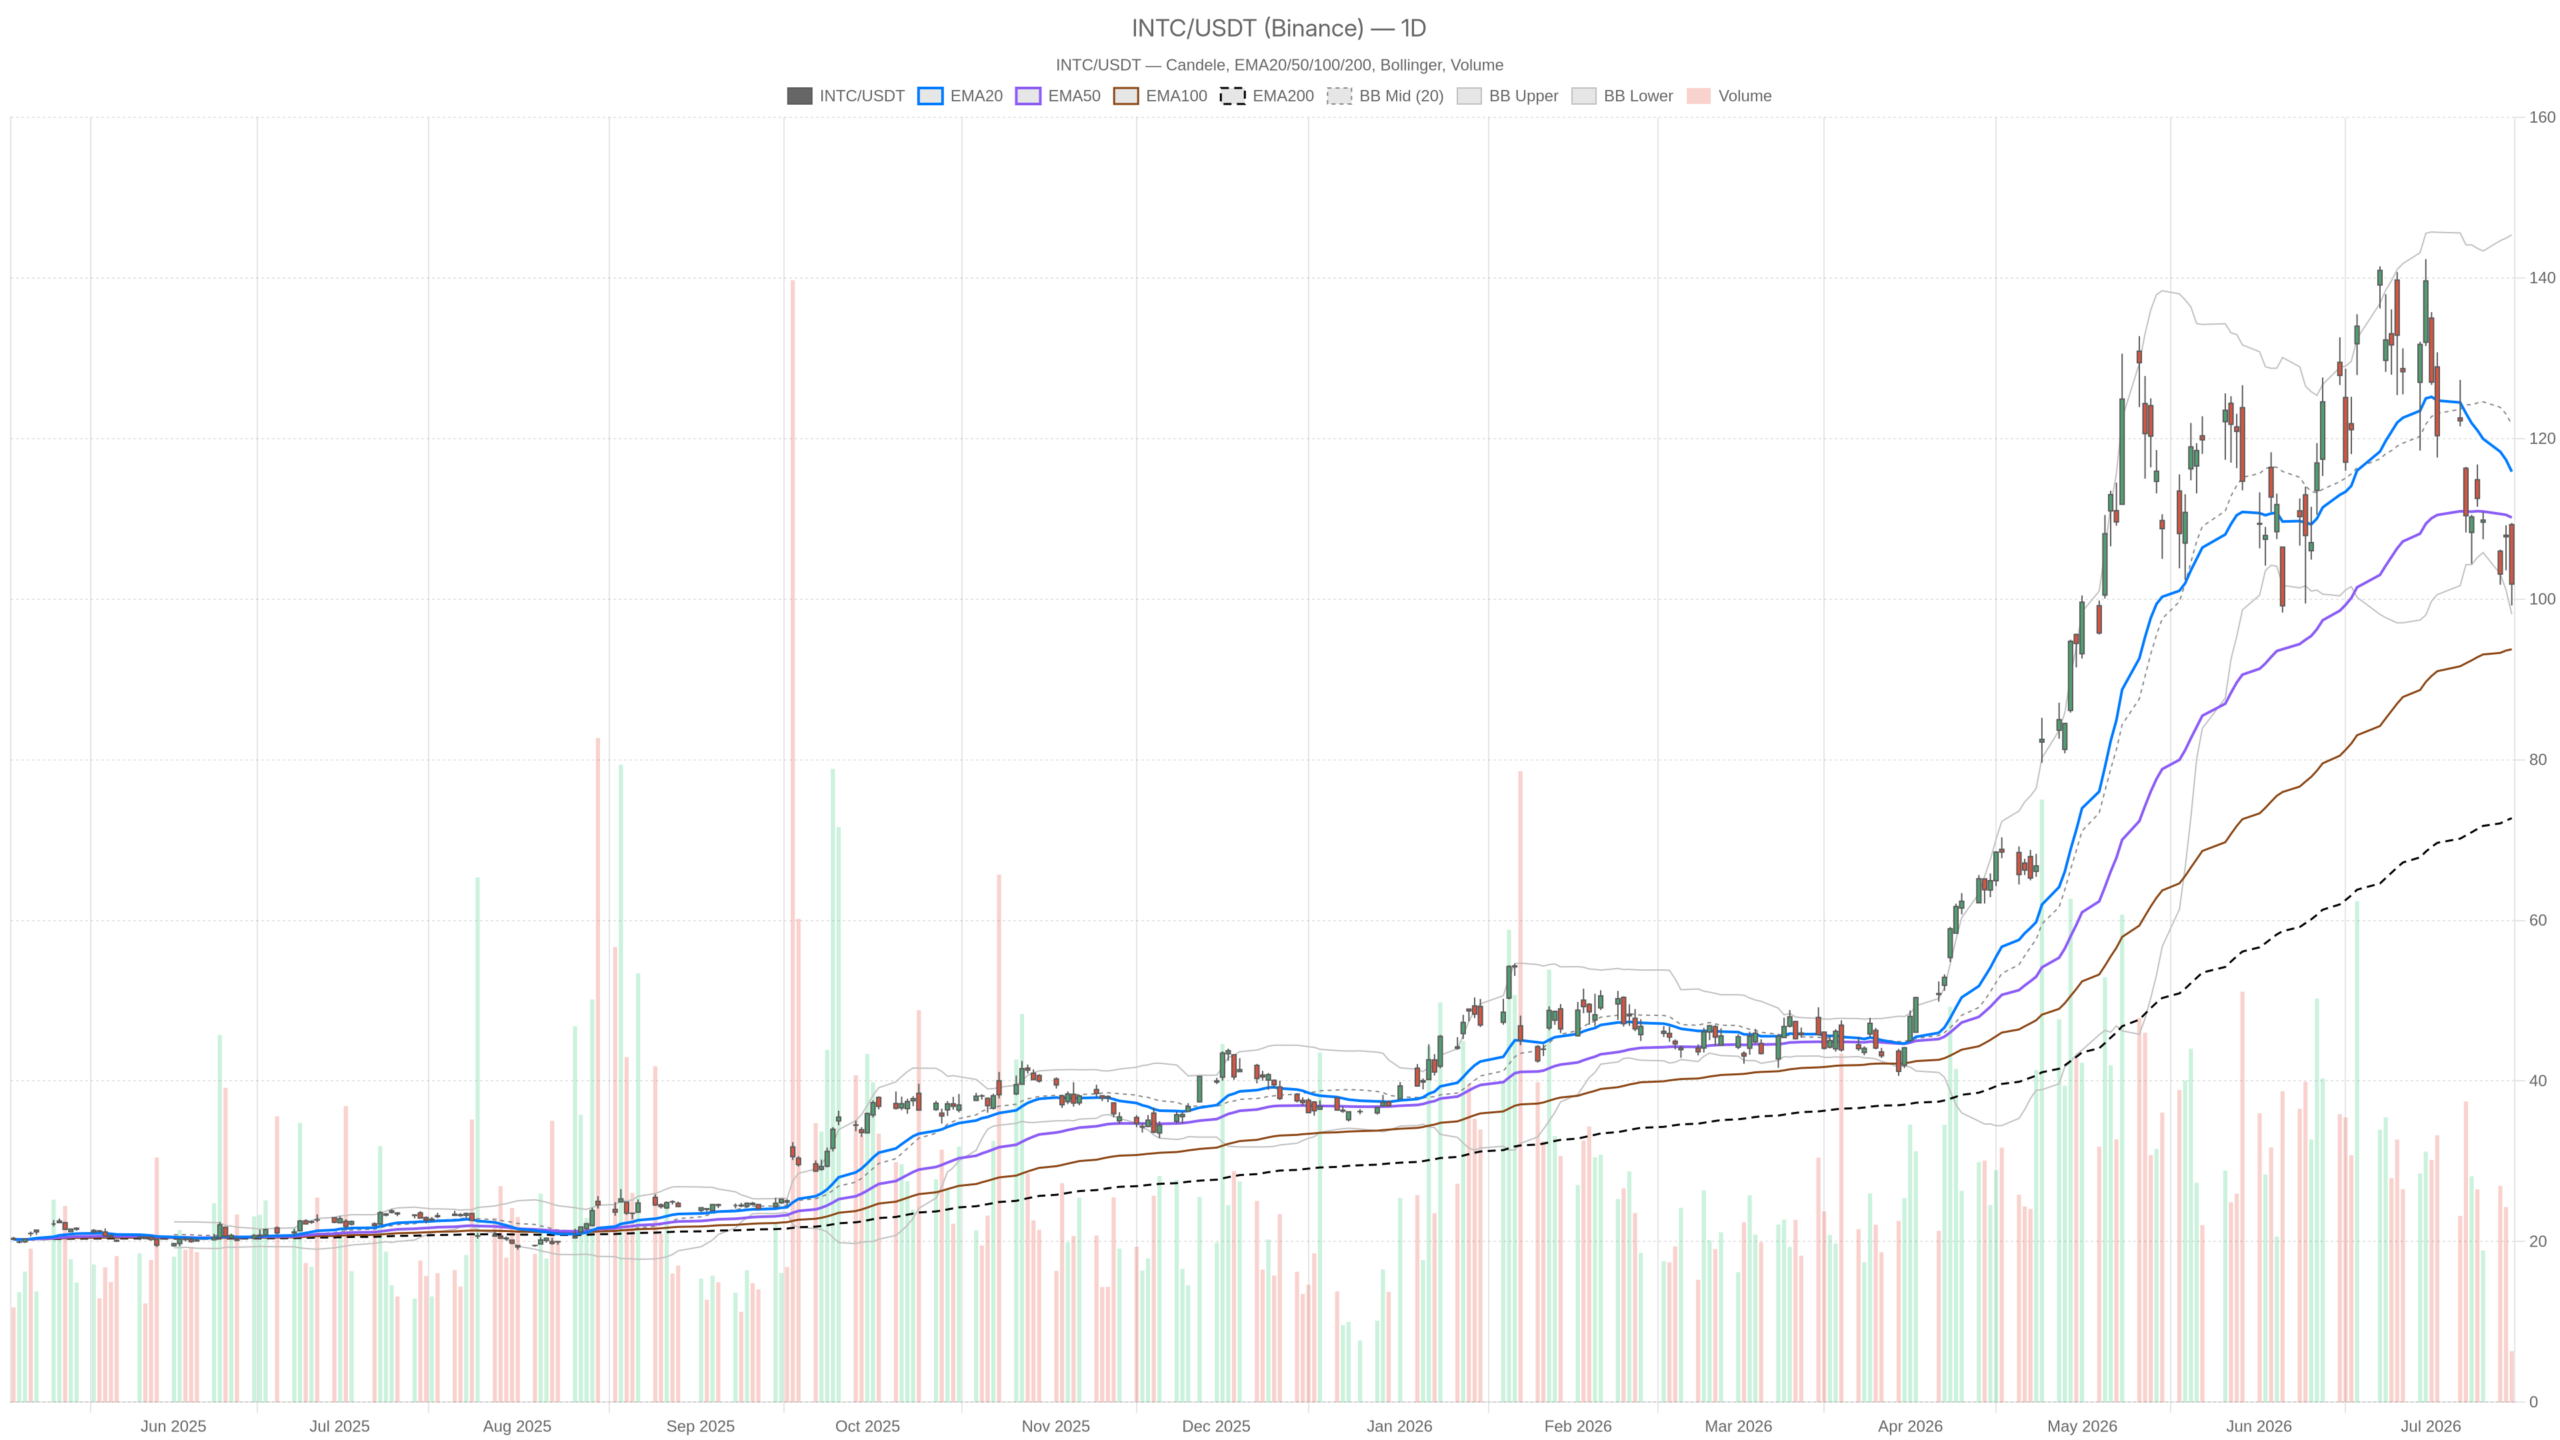
- INTC closed at $101.88, trading below the EMA20 at $115.87 and EMA50 at $110.16.
- The daily MACD histogram at -3.45 signals accelerating downside momentum on Intel Corporation stock.
- HSBC and Stifel have raised price targets; analysts expect roughly 45% EPS growth.
- Intel is investing $5.7 billion in an Ireland AI manufacturing expansion.
- Earnings are scheduled for July 23; the daily ATR of 9.72 points to elevated volatility risk.
Daily Structure Signals Weakness in Intel Corporation Stock
The daily chart for Intel Corporation stock paints an unambiguously bearish picture. Price trades well below both the 20-day and 50-day EMAs, with momentum indicators confirming downward acceleration.
INTC trades at $101.88, meaningfully below the EMA20 at $115.87 and the EMA50 at $110.16. Both moving averages slope downward relative to price. The medium-term trend remains under clear pressure. Still, the only constructive element on the EMA stack is the EMA200 at $72.72. It serves as a reminder of how far Intel Corporation stock has run over the past year despite current softness.
Momentum Indicators Confirm Bearish Pressure
The RSI14 on the daily chart prints at 39.79. That reading sits close to oversold territory without yet triggering it. Momentum is clearly fading, but no confirmed exhaustion signal has emerged. Meanwhile, the daily MACD reinforces the bearish case with conviction. The MACD line stands at -2.90, the signal at 0.55, and the histogram at a deeply negative -3.45. This kind of histogram reading reflects accelerating downside momentum, not a slowdown.
Notably, Bollinger Bands add further context. The daily midline sits at $121.74, far above current price. The lower band rests at $98.12. INTC closed at $101.88 — uncomfortably close to the lower band. A close below $98.12 would represent a band breakdown and a meaningful escalation of bearish pressure. The daily ATR14 of 9.72 highlights just how volatile this stock remains. Single-session swings of nearly $10 are the norm.
Meanwhile, pivot analysis places the daily pivot point at $103.52. INTC closed below that level. Resistance at R1 sits at $107.84, while support at S1 is at $97.55. The proximity of current price to S1 is a near-term concern for bulls. The daily regime is classified as neutral, but the weight of the evidence skews decisively bearish.
Hourly and Intraday Charts Confirm Downtrend
The 1-hour chart deepens the bearish case for Intel Corporation stock. Price trades below all three key EMAs, confirming persistent selling across every meaningful intraday trend horizon.
1-Hour Chart Deepens the Bearish Case
The H1 regime is explicitly flagged as bearish. Price at $101.88 trades below the H1 EMA20 at $105.01, the EMA50 at $109.65, and the EMA200 at $117.69. All three EMAs are stacked in bearish order above price. That alignment signals persistent selling pressure.
The H1 RSI14 at 36.96 is trending toward oversold but has not reversed. The MACD on this timeframe shows the line at -2.08 against a signal of -1.91, producing a small negative histogram of -0.17. That marginal divergence hints that selling momentum may be slowing. However, it is far too early to call a reversal. H1 pivot levels are tightly clustered: PP at $101.86, R1 at $102.44, S1 at $101.29. Price is essentially pinned at the pivot. There is very little room before either a bounce toward R1 or a breakdown toward S1.
15-Minute Chart Offers a Tentative Glimmer
On the 15-minute chart, useful only for execution context, the picture becomes slightly more nuanced. The regime is bearish, but the MACD histogram prints a small positive value of 0.19. The MACD line at -1.07 now sits above the signal at -1.26. This divergence suggests very short-term buying pressure emerging. The 15m RSI at 42.24 is neutral-to-weak, not yet recovering. However, the EMA stack remains bearish: EMA20 at $102.35, EMA50 at $104.01, EMA200 at $109.96 — all above price. Any 15-minute bounce should be treated as noise within the broader bearish structure until proven otherwise.
Fundamental Catalysts Build a Competing Narrative
In contrast to the technical deterioration, fundamental newsflow is moving sharply higher for Intel Corporation stock. Major analyst upgrades and significant capital investments are building a bullish counter-narrative.
HSBC doubled its price target on Intel on July 6 — a rare and emphatic move from a major institution. Stifel has also raised its price target, adding to a growing chorus of analyst optimism. Analysts currently expect EPS growth of roughly 45%, a figure that justifies meaningful attention from growth-oriented investors.
Notably, Intel is doubling down on its AI manufacturing ambitions with a $5.7 billion expansion in Ireland. That investment signals confidence in the company’s long-term manufacturing roadmap and its ability to compete in the AI supply chain. Additionally, Intel ranks among quantum computing stocks due to its work on silicon spin qubits. This bet leverages existing chip manufacturing expertise rather than requiring entirely new infrastructure.
Meanwhile, earnings are scheduled for July 23. Heading into that print, prediction markets, insider activity, and competitor capital are reportedly aligned in the same direction. Intel’s shares are up 371% over the past year and 178% year-to-date. This extraordinary performance also helps explain why profit-taking is now visible on the daily chart. Despite the broader semiconductor sector sell-off, INTC has gained 5.14% over the past month.
Bullish Scenario: What Would Support a Recovery
The bull case for Intel Corporation stock rests on mean reversion and fundamental re-rating. Reclaiming key technical levels, combined with a positive earnings catalyst, could shift the near-term bias.
For bulls to regain control, INTC needs to reclaim the daily pivot at $103.52 with conviction. It must then press through the EMA50 zone near $110.16. A positive earnings surprise on July 23 could act as the trigger. Supported by the 45% EPS growth consensus, such a move would help close the gap toward the EMA20 at $115.87.
Importantly, the stock is holding above the daily Bollinger lower band at $98.12. As long as that level holds, the daily chart technically remains in a consolidation rather than a breakdown. A reclaim of the H1 EMA20 at $105.01 would be an early signal that short-term sellers are losing control. The positive 15-minute MACD histogram is a minor but watchable early indicator in this context.
Bearish Scenario: Key Levels That Would Invalidate the Bull Case
The bearish scenario for Intel Corporation stock is more straightforward given the current technical alignment. A breakdown below critical support levels would accelerate selling pressure.
Specifically, a daily close below $98.12 — the Bollinger lower band — would be a clear breakdown signal. That move would also breach S1 support at $97.55 and likely accelerate selling. The deeply negative daily MACD histogram at -3.45 suggests momentum is still pushing lower, not stabilizing.
On the hourly chart, a failure to hold H1 S1 at $101.29 would expose Intel Corporation stock to further intraday weakness. If the H1 MACD, already borderline, rolls back into deeper negative territory, the marginal stabilization signals from the 15-minute chart would be invalidated. Ahead of earnings, any negative pre-announcement or macro semiconductor shock could accelerate the decline.
Positioning and Volatility Outlook
Overall, Intel Corporation stock presents a difficult near-term setup defined by conflicting signals. The technical picture is bearish, while the fundamental story argues against treating this purely as a short opportunity.
At the same time, the fundamental story — analyst upgrades, a $5.7 billion Ireland expansion, AI ambitions, and a major earnings catalyst on July 23 — supports the longer-term thesis. The daily ATR of 9.72 means volatility is already elevated. Positioning ahead of the July 23 earnings report carries meaningful binary risk in both directions. The prudent approach is to respect both the technical weakness and the fundamental optionality. Short-term price action should not be confused with the longer-term re-rating thesis that analysts are building around this name.
FAQ
What is the current technical outlook for Intel Corporation stock?
The daily chart shows a bearish bias. INTC closed at $101.88, below the EMA20 at $115.87 and EMA50 at $110.16. The daily MACD histogram at -3.45 confirms accelerating downside momentum. The hourly chart reinforces this view, with all three key EMAs stacked above price.
What are the key support levels to watch for INTC?
The critical support is the daily Bollinger lower band at $98.12. Below that, S1 pivot support sits at $97.55. On the hourly chart, H1 S1 at $101.29 is the immediate level to monitor. A close below $98.12 would represent a meaningful breakdown.
When are Intel’s next earnings and what should investors expect?
Intel reports earnings on July 23. Analysts expect roughly 45% EPS growth. The daily ATR of 9.72 indicates elevated volatility, meaning the earnings report carries significant binary risk in both directions.
What fundamental factors are supporting Intel Corporation stock?
HSBC doubled its price target on July 6, and Stifel has also raised its target. Intel is investing $5.7 billion in an AI manufacturing expansion in Ireland. The company is advancing quantum computing through silicon spin qubit research. The stock has gained 5.14% over the past month despite broader semiconductor sector weakness.
Disclaimer: This article is for informational purposes only and does not constitute financial advice, an investment recommendation, or a solicitation to buy or sell any financial instrument or cryptocurrency. The analysis provided is not indicative of future results. Investing in crypto assets and financial markets carries a high risk of capital loss. Always do your own research (DYOR) and consult a qualified financial advisor before making any decision.
Article produced with the assistance of artificial intelligence and reviewed by the editorial team.
