



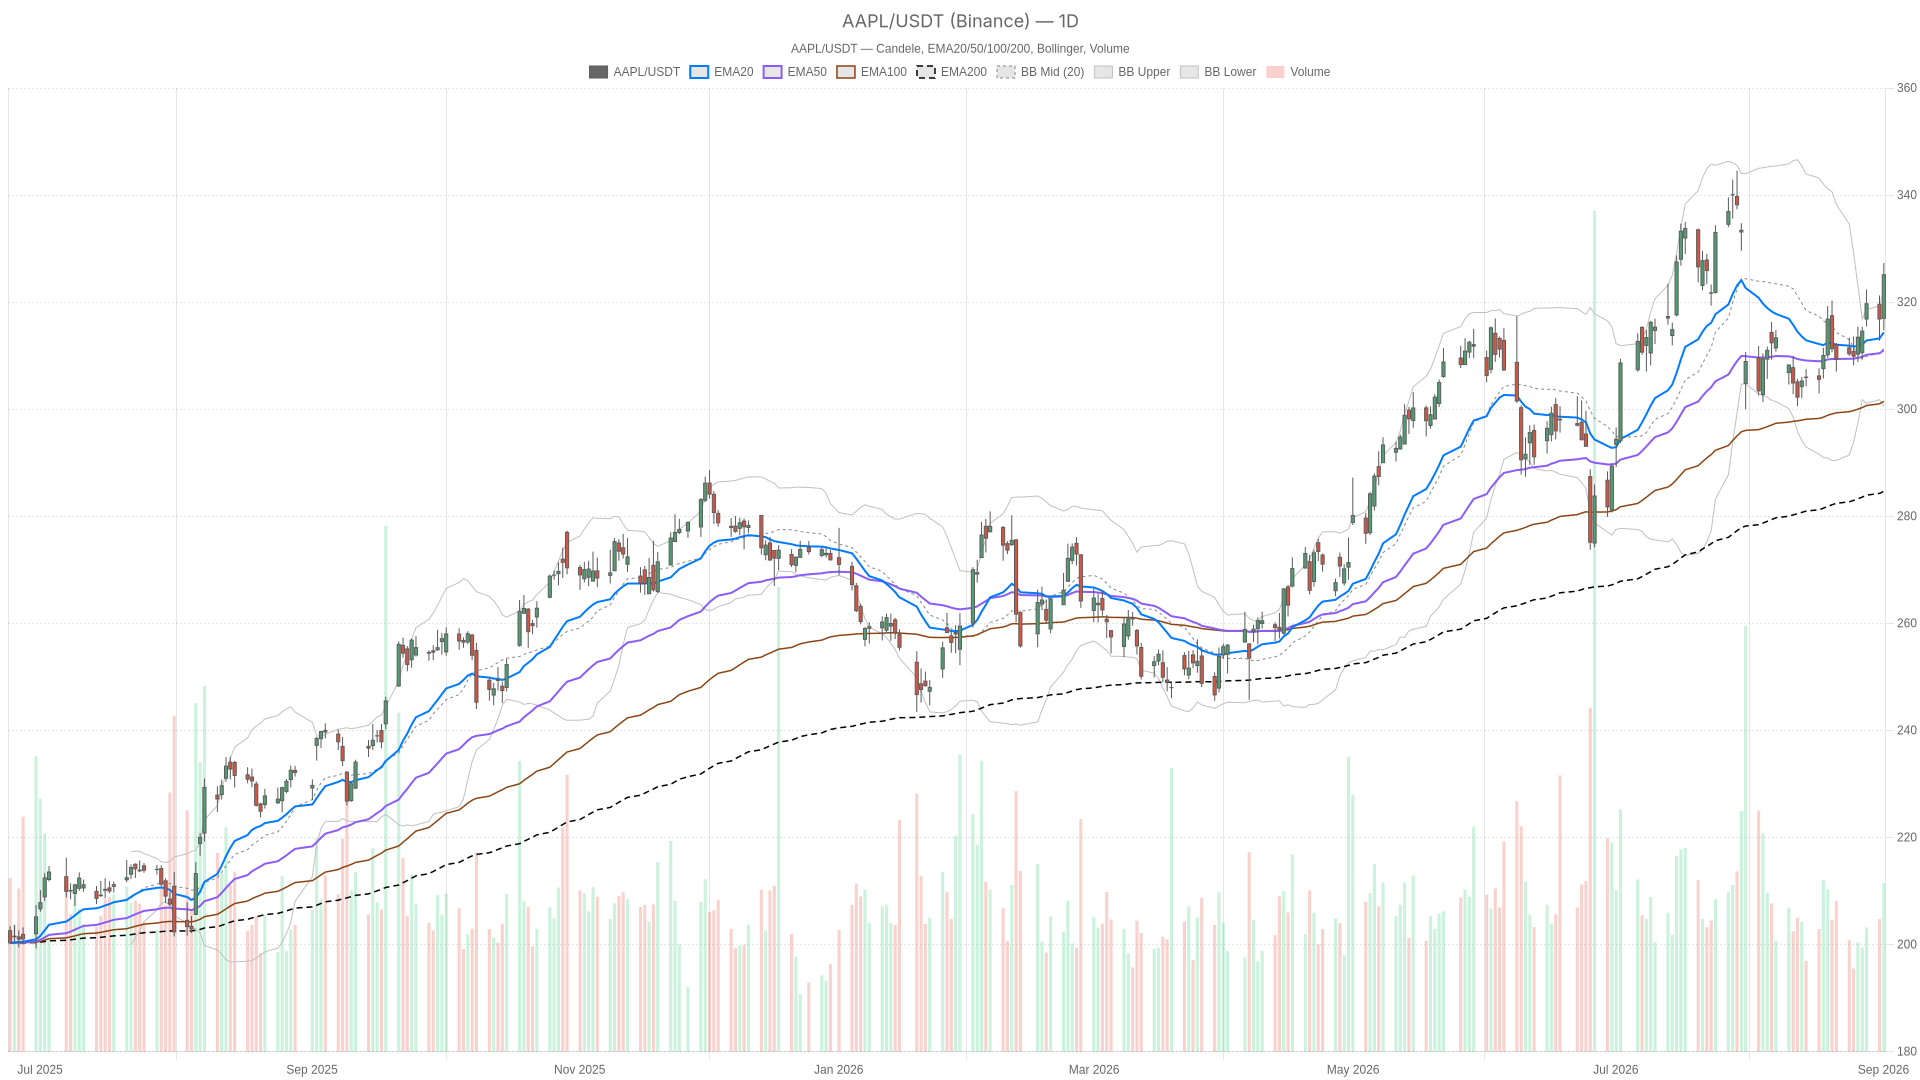
Apple stock closed at $325.13 on September 1, jumping 2.7% as John Ternus took over as CEO. The daily chart shows a clean bullish structure. Price sits above all key EMAs, reinforcing the uptrend. Short-term signals, however, suggest a pause may be near.
Summary
Key takeaways
- Apple stock rallied 2.7% to $325.13 on September 1 as John Ternus succeeded Tim Cook as CEO after a 15-year tenure.
- The daily chart shows a clean bullish structure with price above EMA20 ($314.35), EMA50 ($311.02), and EMA200 ($284.68).
- RSI14 at 61.06 on the daily chart leaves room for further upside before overbought conditions emerge.
- The 15-minute chart shows momentum cooling, with MACD histogram turning negative at -0.32, suggesting near-term consolidation.
- A break above daily R1 at $330.04 would confirm continuation, while a drop below S1 at $317.48 would challenge the bullish thesis.
Momentum and Volatility Driving Apple Stock Higher
The daily chart confirms that Apple stock’s uptrend is well-supported by both momentum and volatility readings. RSI14 at 61.06 signals strength without overbought risks. That leaves room for further upside before momentum becomes a constraint.
The MACD line at 1.21 versus a signal line at -0.3 produces a histogram of 1.51. This widening spread reflects strengthening upward momentum rather than a fading rally. Meanwhile, Bollinger Bands add nuance. The daily mid-band sits at 311.32. The upper band is at 322.11 and the lower band at 300.53.
Notably, Friday’s close at 325.13 pushed price above the upper band itself. This signals strong trending behavior but also a technical stretch. Historically, such stretches invite consolidation before the next leg. ATR14 at 6.66 confirms daily ranges have expanded meaningfully, consistent with a market moving with conviction.
Pivot levels reinforce the bullish structure. The daily pivot point stands at 322.39, with R1 at 330.04 and S1 at 317.48. Price closing above the pivot and pressing toward R1 suggests buyers remain in control. A clean break above 330.04, however, would provide the next real confirmation of continuation.
Apple Stock Hourly Chart: Confirmation With a Cooling Edge
The hourly chart echoes the daily bullish structure for Apple stock but shows short-term momentum running slightly hotter. RSI14 at 65.26 sits above the daily reading. The EMA stack mirrors the daily alignment: EMA20 at 320.69 above EMA50 at 316.94, which in turn sits above EMA200 at 314.24.
The MACD line at 2.87 remains above its signal at 2.25. The histogram reads 0.62 — still positive, though narrower than expected given the rally’s strength. That narrowing histogram is worth watching. It does not contradict the bullish structure. But it suggests hourly momentum is decelerating even as price holds near highs.
The hourly Bollinger mid-band at 320.34 and upper band at 328.75 give price some room to run. At the same time, the hourly pivot at 325.04 — almost exactly where Apple stock closed — marks a decision point between the pivot and R1 at 325.99.
Apple Stock on the 15-Minute Chart: Signs of Consolidation
The 15-minute chart shifts the picture for Apple stock, showing consolidation rather than continuation. Price closed at 325.14, essentially glued to the pivot point of 325.04. It remains trapped between support at 324.20 and resistance at 325.99.
The MACD histogram has turned negative at -0.32. Yet the MACD line at 1.27 remains above zero. This signals short-term momentum has cooled after the rally while the broader bullish structure stays intact. Bollinger Bands on this timeframe are notably tight, with the upper band at 326.62 and the lower band at 323.87.
ATR14 is down to just 0.96. This combination points to a market catching its breath rather than reversing. In practice, this timeframe should be read purely as execution context. It flags a pause, not a change in the underlying daily trend.
Apple Stock Timeframe Analysis: Agreement and Divergence
The daily and hourly timeframes for Apple stock are aligned and mutually confirming across trend structure, EMA stacking, and MACD direction. The 15-minute chart, however, complicates the immediate picture by showing a loss of short-term momentum.
This is not a conflict that undermines the bullish thesis. It is a normal feature of markets that have just posted a strong single-session move. Therefore, traders should treat the short-term stall as a pause within the trend rather than a reversal signal.
Bullish Scenario for Apple Stock
The bullish case for Apple stock requires continuation above daily R1 at $330.04, supported by healthy momentum readings and a well-received leadership transition. A confirmed break there would validate the current trend as durable rather than exhausted. RSI staying below extreme overbought levels and the MACD histogram continuing to expand would support this view.
The leadership transition removes a layer of uncertainty. Ternus, previously Apple’s senior vice president of hardware engineering, steps in while Tim Cook — who oversaw Apple’s rise from roughly $350 billion to about $4.6 trillion — remains involved as executive chairman. In this scenario, dips toward the daily EMA20 near $314.35 or the pivot at $322.39 would likely be bought rather than sold.
Bearish Scenario for Apple Stock
The bearish case for Apple stock would require a break below daily S1 at $317.48, accompanied by deteriorating momentum signals. Price would need to slip under the EMA20 at $314.35 and back toward the Bollinger mid-band at $311.32. A rollover in the daily MACD histogram, paired with RSI drifting lower, would be the clearest signal that momentum has genuinely turned.
On the news side, the escalating legal battle with OpenAI is a risk worth flagging. The broader macro backdrop adds pressure too. Oil prices are climbing for a third straight day amid renewed U.S.-Iran tensions. Yields near 5% can spill into equity volatility regardless of company-specific strength.
Apple Stock Outlook: Closing Thoughts
The structural picture for Apple stock remains bullish across daily and hourly timeframes, but near-term consolidation appears likely before the next directional move. Price is pushing into new highs on the back of a well-received leadership transition. At the same time, the 15-minute chart shows momentum cooling into a tight range.
Given elevated ATR readings on the daily chart and broader macro noise from oil and yields, volatility is likely to stay elevated. Positioning should account for that two-speed dynamic: a strong underlying trend paired with short-term uncertainty over timing.
FAQ
What is driving Apple stock higher?
Apple stock jumped 2.7% to $325.13 on September 1 as John Ternus officially took over as CEO, succeeding Tim Cook. The market viewed the transition positively, reassured by Cook remaining as executive chairman. The daily chart confirms the move is backed by a clean bullish structure, with price above all key EMAs and RSI14 at 61.06 signaling room for further upside.
What are the key support and resistance levels for Apple stock?
The daily pivot point stands at $322.39, with key resistance at R1 of $330.04 and key support at S1 of $317.48. On the downside, the EMA20 at $314.35 and the Bollinger mid-band at $311.32 provide additional support levels. A break above $330.04 would confirm continuation, while a drop below $317.48 would challenge the bullish thesis.
Is Apple stock overbought after the rally?
Not yet. RSI14 on the daily chart reads 61.06, which is firmly in bullish territory but well below the overbought threshold. The hourly RSI14 is higher at 65.26, showing short-term momentum running hotter. The 15-minute chart shows momentum cooling, with MACD histogram turning negative, suggesting the stock is consolidating rather than overheating.
What risks could derail the Apple stock rally?
The escalating legal battle with OpenAI represents a company-specific risk. On the macro side, oil prices climbing for a third straight day amid renewed U.S.-Iran tensions and yields near 5% could spill into equity volatility. Technically, a break below daily S1 at $317.48 accompanied by a rollover in the daily MACD histogram would signal momentum has genuinely turned.
Disclaimer: This article is for informational purposes only and does not constitute financial advice, an investment recommendation, or a solicitation to buy or sell any financial instrument or cryptocurrency. The analysis provided is not indicative of future results. Investing in crypto assets and financial markets carries a high risk of capital loss. Always do your own research (DYOR) and consult a qualified financial advisor before making any decision.
Article produced with the assistance of artificial intelligence and reviewed by the editorial team.
