




MongoDB stock is sending a conflicting signal. The daily chart retains a textbook uptrend, with price well above major moving averages. Yet a sharp reversal candle followed a quarter that beat expectations and raised guidance. That gap between structure and price action is what traders need to unpack.
Summary
Key takeaways
- MongoDB’s daily EMA stack remains bullish: EMA20 at $417.17, EMA50 at $383.03, and EMA200 at $334.47.
- Q2 FY2027 revenue reached $772 million, up 30% year-over-year, with FY2027 guidance raised to $2.99–$3.03 billion.
- Despite strong results, MDB posted a sharp reversal candle, closing near session lows at $434.21.
- MACD histogram turned negative on both daily (-1.59) and hourly (-2.47) timeframes, signaling fading momentum.
- Key battleground sits between the daily pivot at $437.81 and support at $426.93.
According to reporting from Investing.com and The Motley Fool, MongoDB delivered what looked like a clean beat-and-raise quarter, yet shares fell anyway. Seeking Alpha’s coverage adds context: revenue guidance for fiscal 2027 was lifted to a range of $2.99 billion to $3.03 billion, and Atlas growth outlook was raised to roughly 27%. Yahoo Finance data confirms Q2 revenue of $772 million, up 30% year-over-year. Strong numbers, in other words. But the market wanted more, and that mismatch is now showing up directly in the technical picture.
MongoDB Stock Technical Structure: Daily Bias Still Bullish, But Cracking
The daily trend on MongoDB stock remains structurally bullish, but it is showing clear cracks. The EMA stack is intact, yet a sharp reversal candle and fading MACD suggest momentum is weakening at a critical juncture.
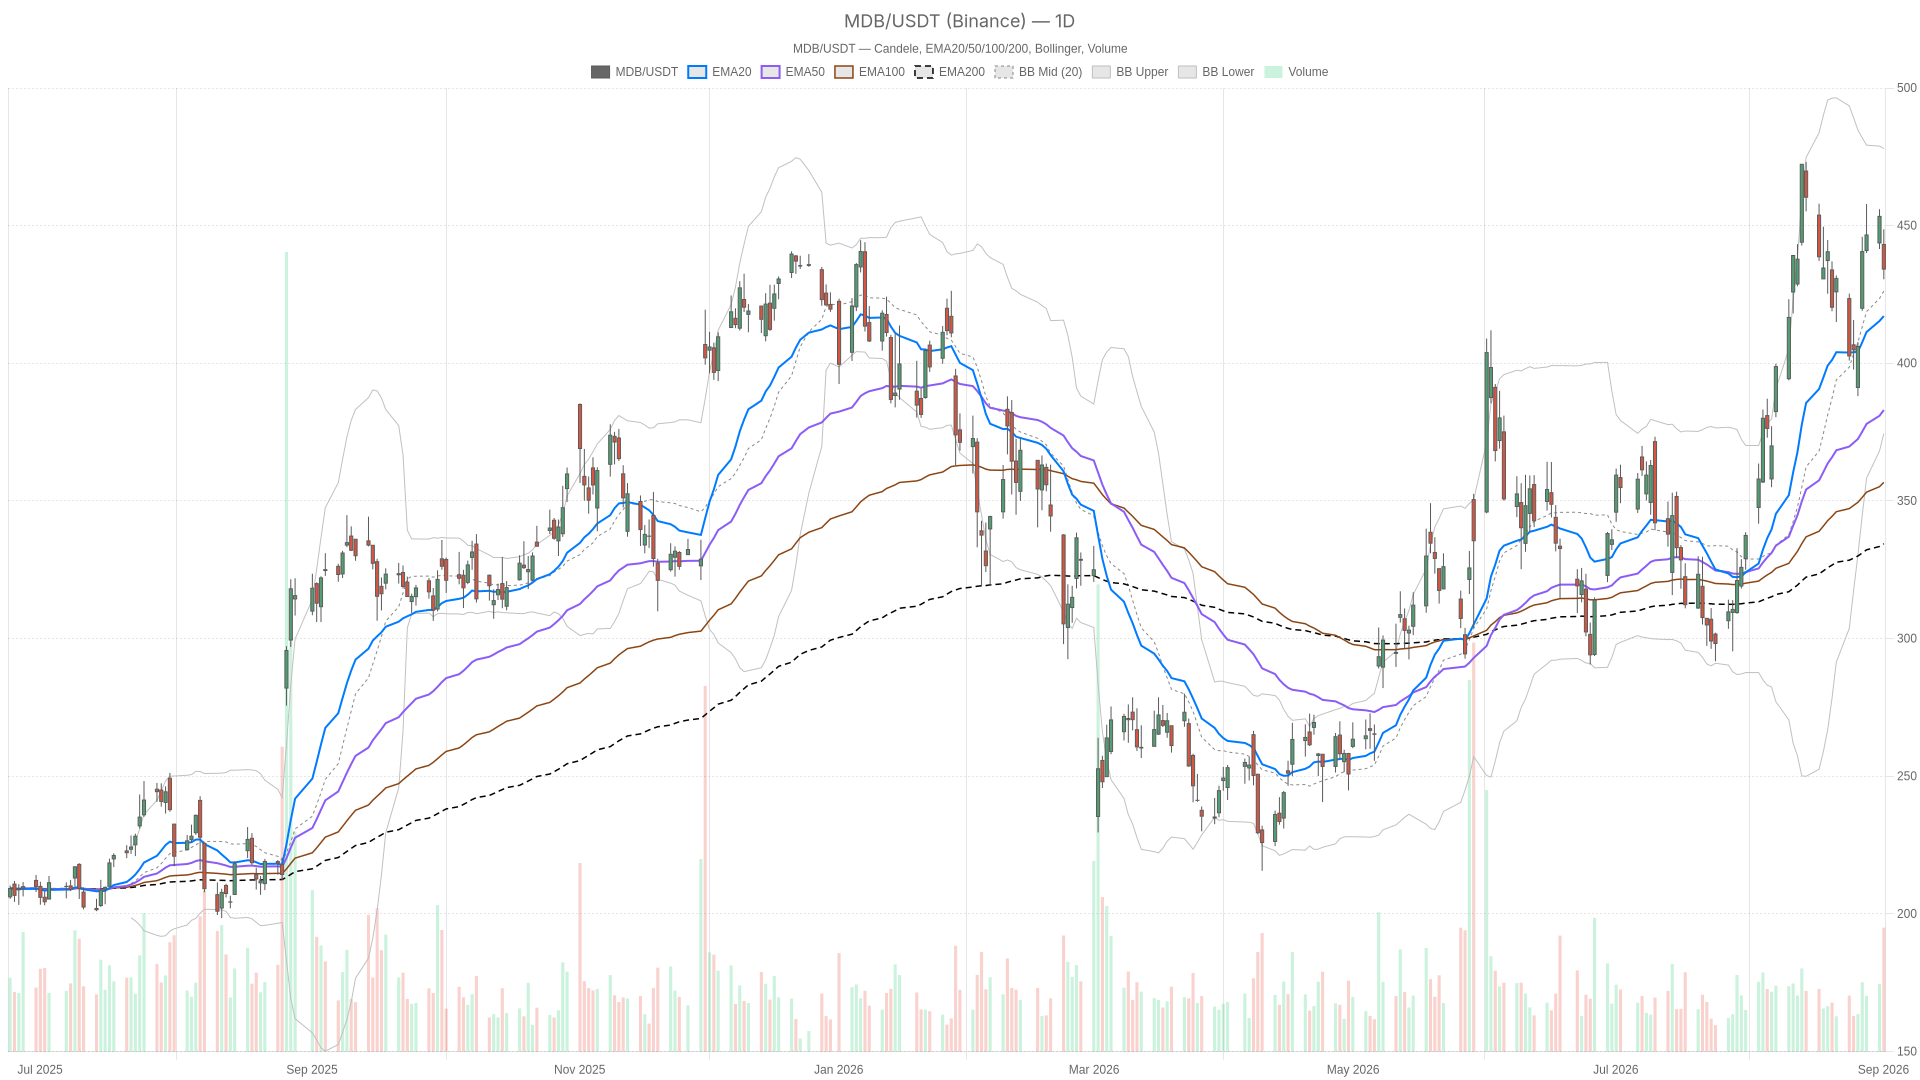
On the daily timeframe, the broader trend remains intact. EMA20 sits at 417.17, EMA50 at 383.03, and EMA200 at 334.47. This is a clean bullish stack that confirms months of sustained uptrend. The regime reading is labeled bullish. Price at 434.21 remains well above all three averages.
However, the latest daily candle tells a different short-term story. MDB opened at 443.19, pushed up to 448.68, then reversed hard to close at 434.21, near the session low. That is a rejection candle, lining up with the earnings reaction. RSI14 at 57.78 remains on the bullish side of neutral. Momentum has not broken down structurally, but it has clearly cooled.
Momentum Indicators Flash Caution
The MACD is the more telling signal here. The line sits at 20.15 against a signal of 21.73, producing a negative histogram of -1.59. In practical terms, momentum is fading even though the trend itself has not turned. Meanwhile, Bollinger Bands show price at 434.21 versus a mid-band of 426.25. The upper band stretches to 478.02 and the lower band to 374.48. That wide range reflects elevated volatility. ATR14 at 22.49 confirms large daily swings.
Pivot levels add useful markers for the days ahead. The daily pivot sits at 437.81, with resistance at 445.09 and support at 426.93. Price closing below the pivot, between it and S1, points to near-term seller control. This is happening within a still-bullish larger trend.
1H Timeframe Confirms a Pause, Not Yet a Reversal
The hourly chart confirms a pause rather than a full reversal on MongoDB stock. Price sits below the 1H EMA20 but still above EMA50, placing it in pullback territory within the broader uptrend.
The hourly chart weakens the bullish case somewhat, without invalidating it. Price at 435.29 sits below the 1H EMA20 of 439.21, but still above EMA50 at 433.64 and well above EMA200 at 405.91. That positioning looks like a pullback inside a longer uptrend rather than a full trend change.
RSI14 on the 1H chart reads 47.16, essentially neutral. MACD tells a similar story to the daily: the line at 1.48 sits below the signal at 3.95. The histogram reads -2.47, confirming short-term downside pressure. Therefore, the regime label has shifted to neutral on this timeframe. The 1H chart is not confirming the daily bullish regime outright. It is complicating it.
At the same time, Bollinger Bands on the hourly frame show price at 435.29 hugging the lower band of 431.84. The mid-band at 443.79 sits well above current levels, suggesting the stock is testing the lower edge of its recent range. ATR14 of 6.41 shows volatility remains active even on this shorter horizon. Hourly pivots place the PP at 434.13, with R1 at 437.01 and S1 at 432.42. This tight band will likely define the next few sessions of price action.
15-Minute Chart: Execution Context Only
The 15-minute chart on MongoDB stock offers execution timing cues only, not a directional thesis. It remains neutral, with price below EMA20 and EMA50 but still above EMA200.
On the 15m timeframe, the picture stays neutral. Price at 435.29 sits below EMA20 at 437.48 and EMA50 at 440.00, but still above EMA200 at 433.98. RSI14 at 43.2 leans soft.
Notably, the MACD histogram here has flipped slightly positive at 0.13. The line at -1.92 remains below the signal at -2.05. That is a small, early sign of stabilization at the lower end of the recent range. However, it is not yet strong enough to change the short-term neutral regime. Bollinger mid sits at 436.59, with the band range between 431.84 and 441.33. ATR14 at 3.23 confirms volatility has compressed sharply compared to the daily and hourly readings.
Bullish Scenario for MongoDB Stock
The bullish case for MongoDB stock rests on the intact daily EMA stack and the raised FY2027 guidance. Reclaiming the daily pivot at 437.81 would be the first step toward reasserting the uptrend.
For this scenario to reassert itself, price would need to reclaim the daily pivot at 437.81 and push through resistance at 445.09. On the hourly chart, that would likely coincide with price reclaiming the EMA20 at 439.21. This would shift the 1H regime back toward bullish alignment with the daily trend.
Fundamentally, the raised FY2027 revenue guidance of $2.99 billion to $3.03 billion supports the long-term bull case. Likewise, the lifted Atlas growth outlook to approximately 27% gives bulls a reason to view the current pullback as a buy-the-dip opportunity. In contrast to the immediate price reaction, the underlying growth story remains intact. Q2 revenue grew 30% year-over-year, according to the earnings call details.
Bearish Scenario and What Would Invalidate the Uptrend
The bearish case for MongoDB stock is building on fading momentum across short timeframes. A daily close below support at 426.93 would open the door to deeper selling pressure.
On the other hand, the bearish case is gaining traction on the shorter timeframes. A daily close below support at 426.93 would open the door toward the Bollinger mid-band at 426.25. If selling accelerates, the lower band at 374.48 becomes the next target. The negative MACD histogram on both the daily and hourly charts supports this risk. Fading momentum often precedes further downside before stabilizing.
Broader market context adds another layer of risk. Investing.com’s coverage flagged oil climbing for a third straight day amid renewed U.S.-Iran tensions. Fed data and 5% yields are moving markets more broadly. Meanwhile, growth-oriented names like MongoDB tend to be more sensitive to rate pressure. A continuation of that macro backdrop could weigh on the stock independent of its own fundamentals.
Overall, the split between a bullish daily structure and a neutral, momentum-fading hourly picture defines the current setup. The daily trend has not broken, but it is clearly being tested. The earnings-day reversal candle is the clearest evidence of that tension.
Closing Take on MDB Positioning
MongoDB stock sits at a genuine inflection point between a structurally bullish daily trend and short-term technical fatigue. The pivot zones around 434 to 438 will likely be the key battleground for the next move.
For now, volatility is elevated across timeframes. ATR readings confirm active price swings rather than quiet consolidation. Given the mixed signals between the daily bullish regime and the neutral hourly and 15-minute readings, positioning here carries real uncertainty. Still, the pivot zones around 434 to 438 will likely be the decisive battleground for the next directional move.
FAQ
What is the current trend for MongoDB stock?
The daily trend on MongoDB stock remains structurally bullish, with EMA20 at 417.17 stacked above EMA50 at 383.03 and EMA200 at 334.47. However, the 1H timeframe has shifted to neutral, and both daily and hourly MACD histograms have turned negative, signaling momentum fatigue within the broader uptrend.
Why did MongoDB stock fall after reporting strong earnings?
MongoDB stock posted a sharp reversal candle despite beating Q2 estimates and raising FY2027 guidance to $2.99–$3.03 billion. The market had priced in even higher expectations. When results failed to exceed them by a wide enough margin, sellers took control, driving price from a session high of 448.68 to a close near 434.21.
What are the key support and resistance levels for MDB?
Key support sits at the daily S1 pivot of 426.93, with the Bollinger mid-band at 426.25 and the lower band at 374.48 below that. On the upside, the daily pivot at 437.81 is the first level to reclaim, followed by resistance at 445.09.
Is the MongoDB stock pullback a buying opportunity?
The bullish daily EMA structure and raised FY2027 guidance support viewing the pullback as a potential buy-the-dip setup. However, the negative MACD on both daily and hourly timeframes suggests waiting for momentum stabilization. A reclaim of the daily pivot at 437.81 would strengthen the bullish case considerably.
Disclaimer: This article is for informational purposes only and does not constitute financial advice, an investment recommendation, or a solicitation to buy or sell any financial instrument or cryptocurrency. The analysis provided is not indicative of future results. Investing in crypto assets and financial markets carries a high risk of capital loss. Always do your own research (DYOR) and consult a qualified financial advisor before making any decision.
Article produced with the assistance of artificial intelligence and reviewed by the editorial team.
