




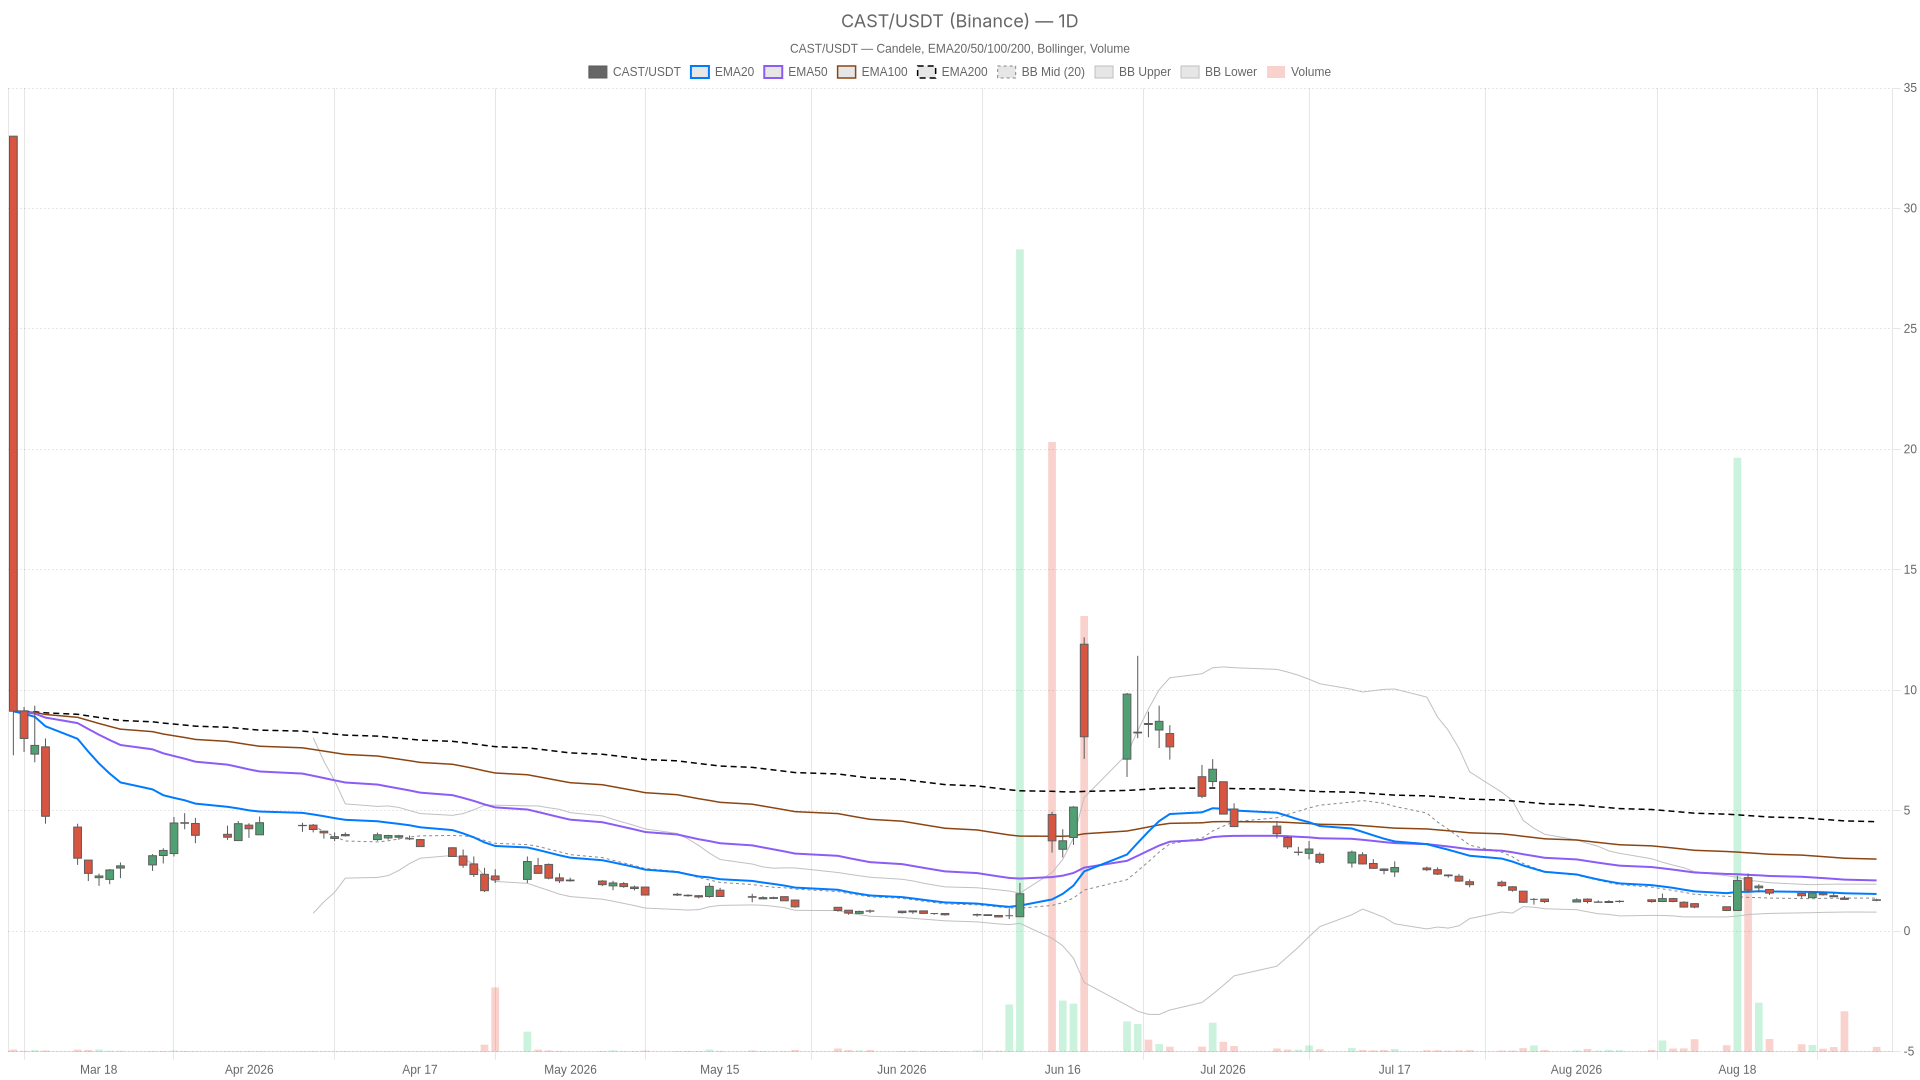
FreeCast stock trades at $1.28, well below every major daily moving average. The broader technical picture remains firmly bearish, and the current consolidation reads more like a pause within a larger decline than a genuine reversal attempt.
Summary
Key takeaways
- CAST closed at $1.28, trading below the 20-day EMA at $1.54, the 50-day at $2.11, and the 200-day at $4.54.
- The daily regime is bearish, with RSI14 at 42.6 and MACD histogram showing tentative momentum stabilization at +0.06.
- Hourly RSI14 sits at 31.28, near oversold territory, while the 1H MACD histogram remains slightly negative at -0.01.
- Daily ATR14 of $0.34 signals elevated volatility, meaning directional moves from current levels could be sharp.
- The $1.23–$1.34 zone defines the near-term battleground, with a break in either direction likely to set the next leg.
Daily Structure: FreeCast Stock Trend Still Pointing Lower
FreeCast stock remains firmly bearish on the daily chart. Price closed at $1.28, well below the 20-day EMA at $1.54, the 50-day at $2.11, and the 200-day at $4.54. This wide separation confirms a structural downtrend, not a short-lived pullback.
RSI14 on the daily sits at 42.6, reflecting a market without strong directional conviction at this exact moment. MACD reads -0.22 on the line versus -0.28 on the signal, producing a histogram of +0.06. That positive histogram print hints at a slight loss of downside momentum. However, both the MACD line and signal remain solidly negative, so this looks more like momentum stabilization than an actual trend shift.
Momentum and Volatility Signals
The daily Bollinger Bands show a mid-line at $1.37, with the upper band at $1.95 and the lower band at $0.79. Price closing below the midline reinforces that sellers still have the upper hand. Meanwhile, ATR14 at $0.34 signals elevated volatility relative to the current share price. Moves in either direction can be sharp, which is typical for a stock repriced so aggressively.
Notably, daily pivot levels are tightly clustered: pivot at $1.29, resistance at $1.34, and support at $1.23. With price essentially sitting on the pivot, this level becomes the near-term battleground for direction.
Hourly Timeframe: Confirming the Bearish Bias
The 1H chart confirms rather than contradicts the daily bearish read. Price closed at $1.28, below the 1H EMA20 at $1.36, the EMA50 at $1.43, and the EMA200 at $1.78. This consistent downward stacking across timeframes strengthens the case for a coordinated trend.
Meanwhile, RSI14 on the hourly chart is notably lower at 31.28, putting it close to oversold territory. The hourly MACD reads -0.07 on the line against -0.06 on the signal, with a histogram of -0.01. Downside momentum remains technically active at this shorter horizon, in contrast to the daily’s slightly improving histogram.
This creates a mild conflict between timeframes. The daily shows early signs of momentum stabilization, while the hourly still leans bearish. When signals diverge like this, it typically points to indecision at current levels rather than a clean setup in either direction.
Timeframe Divergence and Compression
The hourly Bollinger Bands have a midline of $1.38, an upper band of $1.54, and a lower band of $1.21. With price at $1.28, it trades closer to the lower band than the midline, consistent with the oversold RSI reading. Sellers remain in control on this timeframe.
The hourly ATR14 stands at $0.06, and pivots are extremely tight: pivot at $1.28, resistance at $1.30, support at $1.26. This narrow band suggests the market is compressing right around a decision point.
15-Minute View: Execution Context Only
On the 15-minute chart, FreeCast stock is consolidating rather than trending. This makes the timeframe useful purely for timing entries, not for setting the broader directional bias.
Here, price is essentially glued to its EMA20 at $1.28, while sitting below both the EMA50 at $1.33 and the EMA200 at $1.42. RSI14 reads 47.21, near neutral, and MACD is flat at -0.02 on both line and signal, producing a zero histogram. The regime is explicitly labeled neutral, unlike the bearish reads on the daily and hourly charts.
Overall, the 15m Bollinger Bands are tight, with a midline of $1.28, an upper band at $1.33, and a lower band at $1.24. ATR14 sits at just $0.02. Pivot levels mirror the hourly closely. CAST is in a tight holding pattern right at the pivot, waiting for a catalyst.
Bullish Scenario: What Needs to Happen
For a bullish case to develop, CAST stock would need to reclaim daily resistance at $1.34 and push convincingly through the hourly EMA20 at $1.36.
A sustained move above the daily Bollinger midline of $1.37 would signal that buyers are stepping back in with conviction. If the daily MACD histogram keeps expanding positively, and RSI on both timeframes turns higher together, that would mark genuine cross-timeframe confirmation.
Until then, any bounce should be treated as a technical reaction within a broader downtrend, not evidence of a full reversal.
Bearish Scenario: Path of Least Resistance
The bearish case remains the path of least resistance given FreeCast stock’s current structure. A break below daily support at $1.23, followed by a move under hourly support at $1.26, would open the door toward a deeper retest.
Over time, this could stretch toward the daily lower Bollinger Band near $0.79. Meanwhile, with price still trading dramatically below the 200-day EMA of $4.54, the long-term trend bias clearly favors sellers.
In this context, a continuation of negative hourly MACD momentum, combined with RSI staying suppressed below 40 on the daily, would invalidate any early bullish stabilization narrative. Sellers would remain firmly in control.
Closing Thoughts on FreeCast Stock
FreeCast stock is caught between a daily trend that still points lower and short-term signals showing tentative stabilization without confirmation.
The daily and hourly regimes both read bearish, while the 15-minute chart is neutral. This reflects a market pausing at a pivotal price zone near $1.28. Volatility, flagged by the elevated daily ATR of $0.34, means moves from here could be quick once a directional break occurs.
Therefore, traders watching CAST should focus less on chasing the current range and more on how price reacts around the $1.23 to $1.34 zone. That range is likely to define the next meaningful move.
FAQ
What is the current trend for FreeCast stock?
FreeCast stock is in a firmly bearish trend on both the daily and hourly timeframes. Price at $1.28 sits well below the 20-day EMA at $1.54, the 50-day EMA at $2.11, and the 200-day EMA at $4.54, confirming the downtrend is structural rather than temporary.
What are the key support and resistance levels for CAST?
The key support level is $1.23 on the daily chart, with additional hourly support at $1.26. Resistance sits at $1.34 on the daily pivot, with the hourly EMA20 at $1.36 and the daily Bollinger midline at $1.37 acting as further overhead barriers.
Is there any sign of a trend reversal in CAST?
Not yet. The daily MACD histogram at +0.06 shows tentative momentum stabilization, but both the MACD line and signal remain negative. Meanwhile, the hourly MACD is still printing a slightly negative histogram at -0.01. This creates a mild timeframe conflict that points to indecision rather than reversal.
What would confirm a bullish reversal for FreeCast stock?
A sustained break above $1.34–$1.37, combined with the daily MACD histogram expanding positively and RSI turning higher on both daily and hourly timeframes, would mark the first genuine confirmation across timeframes. Until then, bounces should be treated as technical reactions within the broader downtrend.
Disclaimer: This article is for informational purposes only and does not constitute financial advice, an investment recommendation, or a solicitation to buy or sell any financial instrument or cryptocurrency. The analysis provided is not indicative of future results. Investing in crypto assets and financial markets carries a high risk of capital loss. Always do your own research (DYOR) and consult a qualified financial advisor before making any decision.
Article produced with the assistance of artificial intelligence and reviewed by the editorial team.
