




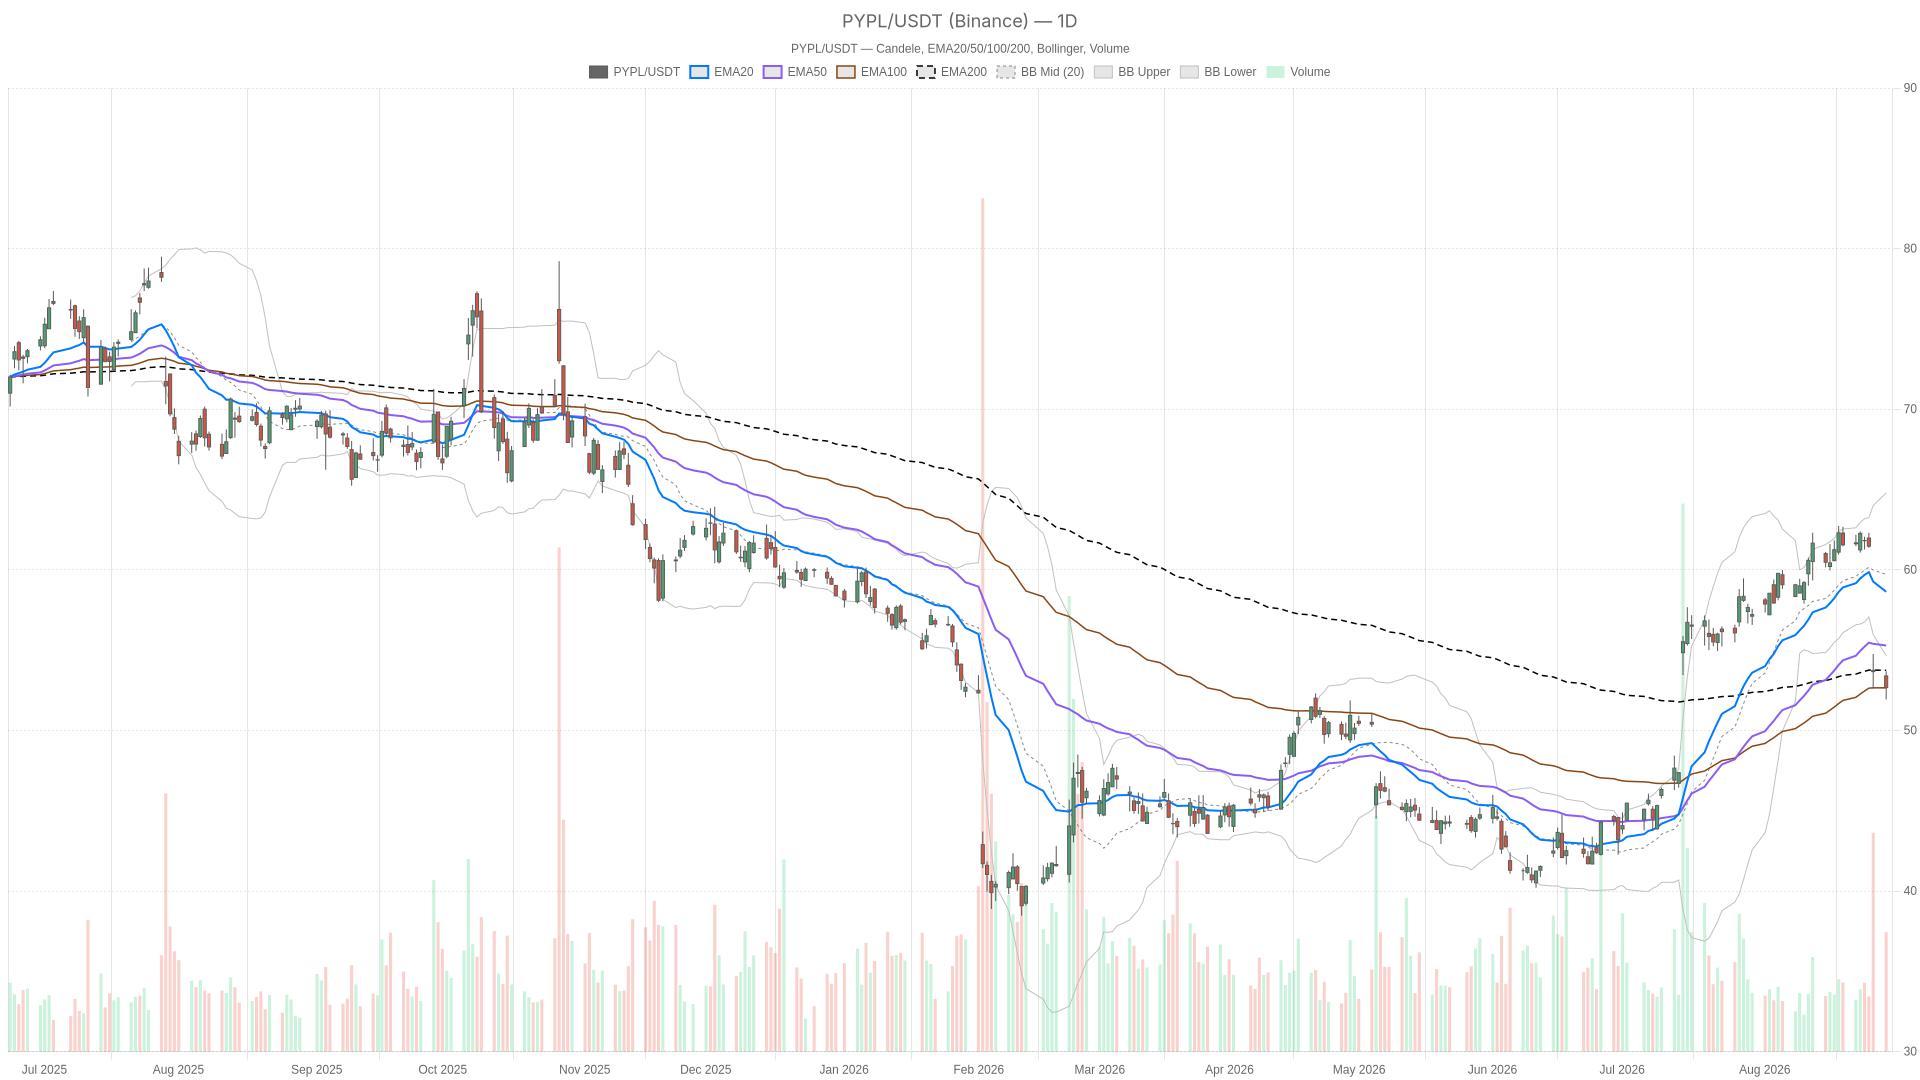
PayPal stock closed Monday at $52.66 after the abandoned Stripe/Advent acquisition talks removed a key bullish overhang. The daily chart has flipped from constructive to bearish. Analyst reactions remain split between caution and renewed value.
Summary
Key takeaways
- PayPal stock closed at $52.66, below the EMA20, EMA50, and EMA200 on the daily chart
- MACD histogram at -1.21 signals accelerating downside momentum
- Daily RSI14 at 32.89 is approaching oversold but has not yet reached extreme territory
- Price is trading below the lower Bollinger Band, reflecting volatility-driven downside expansion
- Mizuho cut its price target to $51; Bernstein reiterated its rating despite the deal collapse
PayPal Stock Technical Structure: Daily Trend Turns Bearish
The daily chart confirms PayPal stock has decisively broken below all three major moving averages, signaling a bearish trend shift with accelerating downside momentum.
Price closed at $52.66, below the EMA20 at $58.64, the EMA50 at $55.29, and the EMA200 at $53.74. That sequence marks a meaningful shift. When price slips beneath all three averages, sellers have seized control from the medium-term uptrend.
The MACD reinforces that read. The line sits at 0.74 against a signal of 1.95, producing a histogram of -1.21. That negative and widening spread points to accelerating downside momentum rather than a fading move. RSI14 at 32.89 is approaching oversold but has not yet reached extreme territory. This suggests further downside may still unfold before exhaustion sets in.
Volatility Expansion and Pivot Levels
Perhaps the most striking signal comes from the Bollinger Bands. With the lower band at $54.65 and price at $52.66, PayPal stock is closing below its own lower band on the daily chart. That is not a routine pullback. It reflects a volatility expansion to the downside, typically driven by a fundamental shock. ATR14 at 2.02 confirms daily ranges have widened considerably.
Meanwhile, pivot levels frame the near-term battle. The daily pivot sits at $52.75, essentially where price is trading now. Support rests at $51.83 and resistance at $53.59. A daily close below $51.83 would open the door to a deeper leg lower. Reclaiming $53.59, in contrast, would be the first sign that buyers are attempting to stabilize the tape.
1H Timeframe Confirms Bearish Bias, With a Twist
The hourly chart confirms PayPal stock’s bearish trend while flashing deeply oversold conditions that could precede a short-term bounce.
Price at $52.66 sits well below the EMA20 at $55.42, EMA50 at $58.07, and EMA200 at $57.77. This is a clean bearish alignment across all three averages. RSI14 has dropped to 18.01, which is deeply oversold by any conventional measure.
Oversold Extremes and Momentum Deceleration
Therefore, while the 1H chart does confirm the daily bearish bias, it also introduces a complication. Momentum this stretched often precedes at least a short-term bounce attempt. The hourly MACD histogram at -0.11 remains negative but is notably smaller than earlier in the decline. This hints that downside momentum may be decelerating even as the trend stays intact.
At the same time, hourly pivot levels are tight. The pivot sits at $52.75, with resistance at $52.94 and support at $52.47. Price is pinned between those boundaries. This tells us the market is undecided at the micro level, even while the broader hourly structure stays negative.
15-Minute Execution Context
The 15-minute chart shows PayPal stock in a bearish regime with tentative stabilization signals that have not yet confirmed a reversal.
On the 15-minute chart, the EMA stack agrees with the bearish read. Price sits below the EMA20 at $53.23, EMA50 at $54.40, and EMA200 at $58.30. RSI14 at 29.77 is nearing oversold on this shorter horizon as well.
Notably, the MACD histogram has ticked into slightly positive territory at 0.03, even though the MACD line remains below its signal. That is a subtle but real sign of short-term stabilization attempts. At the same time, price is trading below the lower Bollinger Band of $52.84. For execution purposes, the 15m pivot at $52.74 and support at $52.49 are the levels to watch for any near-term bounce reaction.
Bullish Scenario for PayPal Stock
A bullish recovery for PayPal stock would need to start with reclaiming the daily pivot at $52.75, followed by a push back above the 1H EMA20 at $55.42.
That move would need to be paired with RSI turning higher off oversold readings across the 1H and 15m charts. The MACD histogram would also need to flip decisively positive rather than just flattening. On the fundamental side, the Seeking Alpha thesis could give bulls a narrative to work with. It highlights strong free cash flow, buybacks, and the removed acquisition overhang. Bernstein’s decision to reiterate its rating despite the deal collapse also suggests not every analyst sees deterioration in the underlying business.
Bearish Scenario for PayPal Stock
The bearish case for PayPal stock simply requires continuation of what is already in motion, confirmed by a daily close below the $51.83 support level.
A close below $51.83 would confirm sellers remain in control and likely trigger further downside targeting. Continued closes below the lower Bollinger Bands on both the daily and 15m charts would reinforce the bearish structure. Additional price target cuts similar to Mizuho’s move to $51 would strengthen the fundamental concern narrative. In that scenario, the deeply oversold hourly RSI would reflect a market in freefall rather than one setting up for a bounce. Any short-term stabilization attempts on the 15m chart would fail to hold.
FAQ
Is PayPal stock in a bearish trend right now?
Yes. PayPal stock has broken below the EMA20, EMA50, and EMA200 on the daily chart, with the MACD histogram at -1.21 signaling accelerating downside momentum. The daily close at $52.66 places price below all three major moving averages.
What are the key support levels to watch for PayPal stock?
The critical support is at $51.83 on the daily pivot. Below that, a deeper sell-off could develop. On the hourly chart, $52.47 serves as immediate micro-support.
Could PayPal stock bounce from current levels?
The hourly RSI at 18.01 is deeply oversold, and the 15-minute MACD histogram has ticked slightly positive. These signals suggest a short-term bounce is possible. However, the broader trend remains bearish until price reclaims the 1H EMA20 at $55.42.
What triggered the sell-off in PayPal stock?
The abandoned Stripe/Advent International acquisition talks removed a bullish catalyst and replaced it with fresh valuation questions. Mizuho subsequently cut its price target to $51, while other analysts remain divided on the outlook.
Disclaimer: This article is for informational purposes only and does not constitute financial advice, an investment recommendation, or a solicitation to buy or sell any financial instrument or cryptocurrency. The analysis provided is not indicative of future results. Investing in crypto assets and financial markets carries a high risk of capital loss. Always do your own research (DYOR) and consult a qualified financial advisor before making any decision.
Article produced with the assistance of artificial intelligence and reviewed by the editorial team.
