



Netflix stock is in a confirmed downtrend. NFLX closed at $68.95 on July 17, below every major moving average, with RSI near oversold across all timeframes. Price structure is broken and momentum remains negative. However, depressed valuations and analyst upgrades are generating counterarguments worth considering.
Summary
Key takeaways
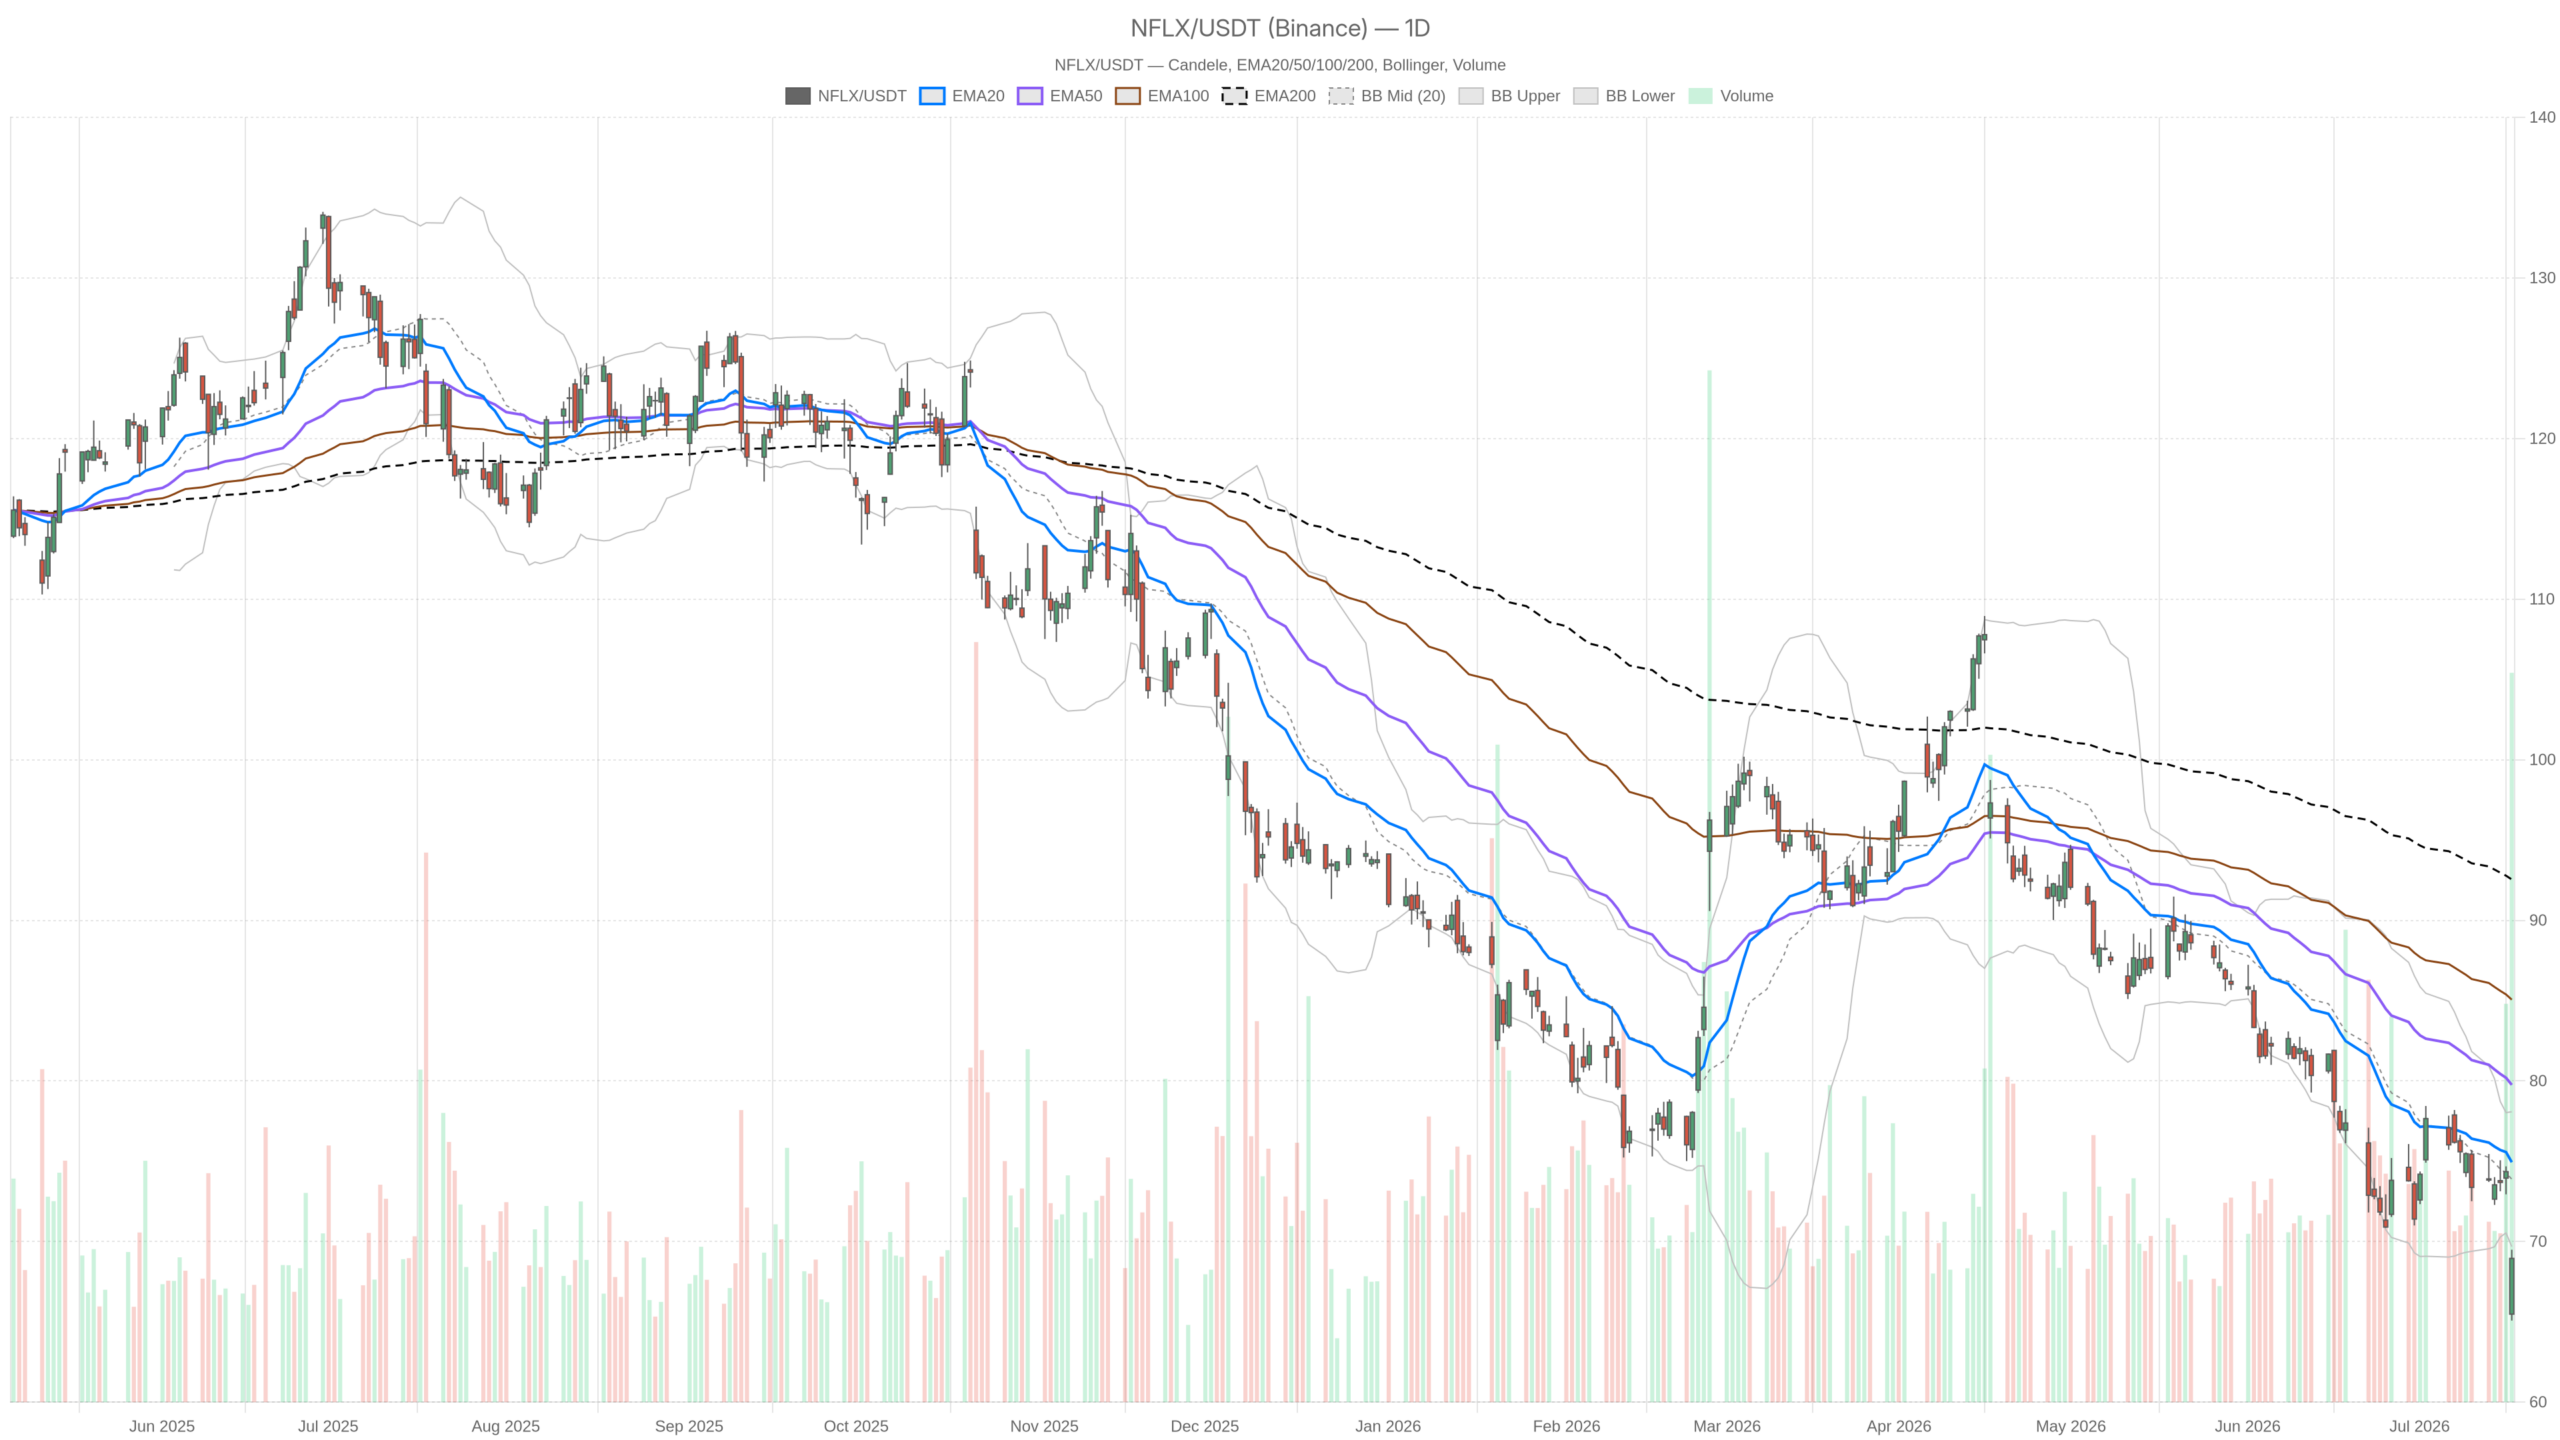
- NFLX closed at $68.95 on July 17, remaining below the EMA20 ($74.94), EMA50 ($79.76), and EMA200 ($92.54)
- Daily RSI at 30.72 sits just above the oversold threshold, while the MACD histogram turned fractionally positive at +0.10
- Analyst opinion is sharply divided between valuation-based upgrades and concerns about slowing pricing tailwinds
- A bullish reversal requires a close above the $70.60–$73.88 zone; a break below $66.19 would accelerate the downtrend
Netflix Stock: Daily Timeframe Defines the Bear Case
The daily chart confirms a structurally entrenched downtrend for Netflix stock, with price below all major moving averages and no evidence of mean reversion. NFLX closed at $68.95, trading beneath the EMA20 at $74.94, the EMA50 at $79.76, and the EMA200 at $92.54. That full EMA stack alignment — price below all three, with each shorter average below the longer one — signals persistent selling pressure, not consolidation.
Meanwhile, the daily Bollinger Band lower boundary sits at $69.68. Price is essentially pressing against that lower band. The mid-band at $73.88 now acts as resistance rather than a gravitational center, reinforcing the bearish bias.
Momentum and Volatility Signals
The daily MACD line reads -2.27 against a signal of -2.37, with a histogram of +0.10. This histogram has just flipped fractionally positive. That is a very early hint of momentum deceleration — not a reversal signal. Still, it does suggest the rate of decline may be slowing slightly. A histogram tick above zero after a prolonged bear move is noise until confirmed by price recapturing structure.
Daily RSI at 30.72 sits just above the classical oversold threshold of 30. Technically, this is a compression zone where sharp bounces can occur. Still, in a sustained downtrend, RSI can remain depressed for extended periods. Oversold is a condition, not a catalyst.
The daily ATR of 2.85 confirms meaningful intraday volatility. With pivot support at $66.19 (S1) and resistance at $70.60 (R1), NFLX is sandwiched in a tight structural range. A daily close above $70.60 would represent a first credible short-term improvement. Below $66.19, the next leg lower opens with little visible technical support.
Hourly Confirmation: No Meaningful Recovery Yet
The hourly chart reinforces the bearish thesis for Netflix stock with no signs of recovery taking shape. Price at $68.86 trades below the H1 EMA20 ($71.32), EMA50 ($72.89), and EMA200 ($76.29). The entire moving average structure is stacked bearishly with no signs of compression or convergence.
In contrast to the daily MACD histogram, the 1H MACD histogram is negative at -0.42. The MACD line of -1.43 sits below the signal line of -1.01. This is an active bearish cross — momentum is still deteriorating on an intraday basis. There is no hourly confirmation of a bottom forming.
The 1H RSI at 31.87 mirrors the daily reading — compressed near oversold but not yet showing a bullish divergence. For a meaningful bounce to develop, one would typically want RSI to reclaim 40 and price to close above the H1 EMA20 around $71.32. Neither condition is currently met.
H1 Bollinger Bands show the lower band at $67.00, with price trading near the midpoint of the band’s lower half. Overall, the hourly timeframe does not weaken the bearish daily thesis — it reinforces it.
15-Minute Context: A Tentative Micro Stabilization
The 15-minute chart shows a tentative micro stabilization for NFLX, but no evidence of a trend reversal. RSI on the 15m has recovered to 43.05 — out of oversold territory and back toward a neutral zone. The 15m MACD histogram is marginally positive at +0.17, suggesting the very short-term selling impulse has paused.
At the same time, price remains below the 15m EMA50 ($70.52) and EMA200 ($72.95). The 15m Bollinger Bands are relatively tight, with the upper band at $69.64 and the lower at $67.96. Price is consolidating just inside the upper half of this tight band. This hints at a micro stabilization — not a trend reversal — and may offer very short-term traders a small tactical window.
For execution purposes, the R1 pivot at $69.41 serves as immediate resistance. A clean push and hold above that level on the 15m could invite short-term buyers. That said, given the weight of evidence from the daily and hourly frames, any such move should be treated as a counter-trend bounce.
The Narrative Split: Upgrades vs. Structural Deterioration
Analyst opinion on Netflix stock is sharply divided between valuation-based upgrades and concerns over structural deterioration. Phillip Securities issued an upgrade based on valuation. Separately, a Seeking Alpha piece describes the current situation as a generational buying opportunity after a 50% decline, trading at historic low multiples. Another analysis highlights a significant bifurcation between Netflix’s valuation and its earnings growth.
On the other side, a competing Seeking Alpha piece downgraded NFLX to Hold, noting that pricing tailwinds are slowing and better opportunities exist elsewhere. The Motley Fool flagged that shares sank again following Q2 results, pointing to what it describes as a real issue behind the stock’s decline. Reports also note Netflix is down roughly 25% year-to-date and nearly 50% over the past year.
This divergence in analyst opinion is itself informative. When a stock is down this sharply and analysts split between generational buy and still too risky, it typically marks the early stage of a bottoming process. It is not a confirmed bottom. Valuation compression alone does not reverse price trends. Catalysts do.
Bullish Scenario: What Would Change the Picture
A credible bullish reversal for Netflix stock would require a sequence of technical repairs starting with a sustained close above $70.60. First, NFLX would need to break the immediate downside structure at the R1 pivot. From there, recapturing the daily Bollinger mid-band at $73.88 would signal genuine mean-reversion momentum. The EMA20 at $74.94 would then become the first real upside target worth monitoring.
On the fundamental side, the bullish narrative rests on valuation. If Netflix’s earnings execution confirms what the upgrade camp expects, the gap between price and intrinsic value would likely attract institutional re-rating. Sustained subscriber growth and monetization of its ad-supported tier are the key catalysts. A positive Q3 earnings surprise could serve as the trigger that technical setups alone cannot provide. In that scenario, the current RSI compression near 30 would be remembered as a textbook oversold entry zone.
Bearish Scenario: What Would Invalidate the Bulls
The bearish case remains the path of least resistance for NFLX, with a break below $66.19 likely to accelerate selling pressure. A daily close below the Bollinger lower band at $69.68 — or a confirmed break below S1 at $66.19 — would open the next leg lower. With price already near the lower band and momentum still negative on the hourly, a fresh decline cannot be ruled out.
Notably, the argument that pricing tailwinds are slowing carries real weight. If Netflix’s ability to raise prices is structurally constrained — and if Q2 results already disappointed — then the valuation argument may be premature. In a high-volatility, low-momentum stock, oversold can become more oversold. The distance between current price ($68.95) and the EMA200 ($92.54) illustrates just how far NFLX would need to travel to recover its longer-term trend context.
Positioning and Final Assessment
Netflix stock is technically broken across every meaningful timeframe. The daily regime is bearish, the hourly confirms that bias, and the 15-minute offers only the faintest hint of stabilization — not reversal. ATR of 2.85 on the daily suggests volatility remains elevated, meaning both bounces and breakdowns can be sharp.
Therefore, any long exposure at current levels is a counter-trend bet requiring disciplined risk management and a clear catalyst in view. The valuation compression and analyst upgrades create a legitimate fundamental foundation. However, the market has not yet confirmed that thesis with price action. Until NFLX reclaims at least the $70.60–$73.88 zone on a closing basis, the bearish structure remains intact and uncertainty is high.
FAQ
Is Netflix stock oversold right now?
Daily RSI stands at 30.72, just above the classical oversold threshold of 30. While this is a compression zone where bounces can occur, in a sustained downtrend RSI can remain depressed for extended periods. Oversold is a condition, not a catalyst for reversal.
What would signal a trend reversal in NFLX?
A credible reversal would require a sustained daily close above $70.60 (R1 pivot), followed by recapture of the Bollinger mid-band at $73.88 and the EMA20 at $74.94. Without reclaiming this zone, the bearish structure remains intact regardless of how oversold conditions appear.
Why are analysts divided on Netflix stock?
Some analysts see a generational buying opportunity after a nearly 50% decline, citing compressed valuation multiples relative to earnings growth. Others argue that pricing tailwinds are slowing and that better opportunities exist elsewhere, downgrading NFLX to Hold. This split typically marks the early stage of a bottoming process — not a confirmed bottom.
Disclaimer: This article is for informational purposes only and does not constitute financial advice, an investment recommendation, or a solicitation to buy or sell any financial instrument or cryptocurrency. The analysis provided is not indicative of future results. Investing in crypto assets and financial markets carries a high risk of capital loss. Always do your own research (DYOR) and consult a qualified financial advisor before making any decision.
Article produced with the assistance of artificial intelligence and reviewed by the editorial team.
