




Alibaba Stock surged nearly 4% premarket after unveiling its Qwen3.8 Max AI model. BABA closed at $120.34 on July 20. The Kimi K3 launch by AI startup Moonshot — in which Alibaba is a major backer — added further momentum. Yet the daily chart holds a critical caveat.
Summary
Key takeaways
- BABA closed at $120.34 on July 20, building on a near-4% premarket surge
- The Qwen3.8 Max AI model preview and Kimi K3 launch triggered renewed investor attention
- Daily EMA200 at $132.36 remains the dominant structural resistance, $12 above current price
- The resistance zone converges at $122.17–$122.62, formed by daily R1 and the Bollinger upper band
- Daily RSI at 64.11 leaves room for upside before overbought conditions arise
Alibaba Stock Charges Higher on a Wave of AI Momentum
Alibaba Stock is rallying behind concrete product launches rather than speculative hype. The company’s preview of its flagship large language model, Qwen3.8 Max, triggered an immediate premarket surge of nearly 4%. Meanwhile, AI startup Moonshot launched its record-setting Kimi K3 model. As a major backer, Alibaba gained additional investor attention from that launch.
The technical picture across the near term is aligned with the narrative. Price has broken above key short-term averages and momentum indicators confirm genuine buying pressure. However, the daily chart still holds a crucial caveat that serious traders cannot ignore — the EMA200 looms far above at $132.36.
Daily Timeframe: Momentum Building, But the EMA200 Looms Large
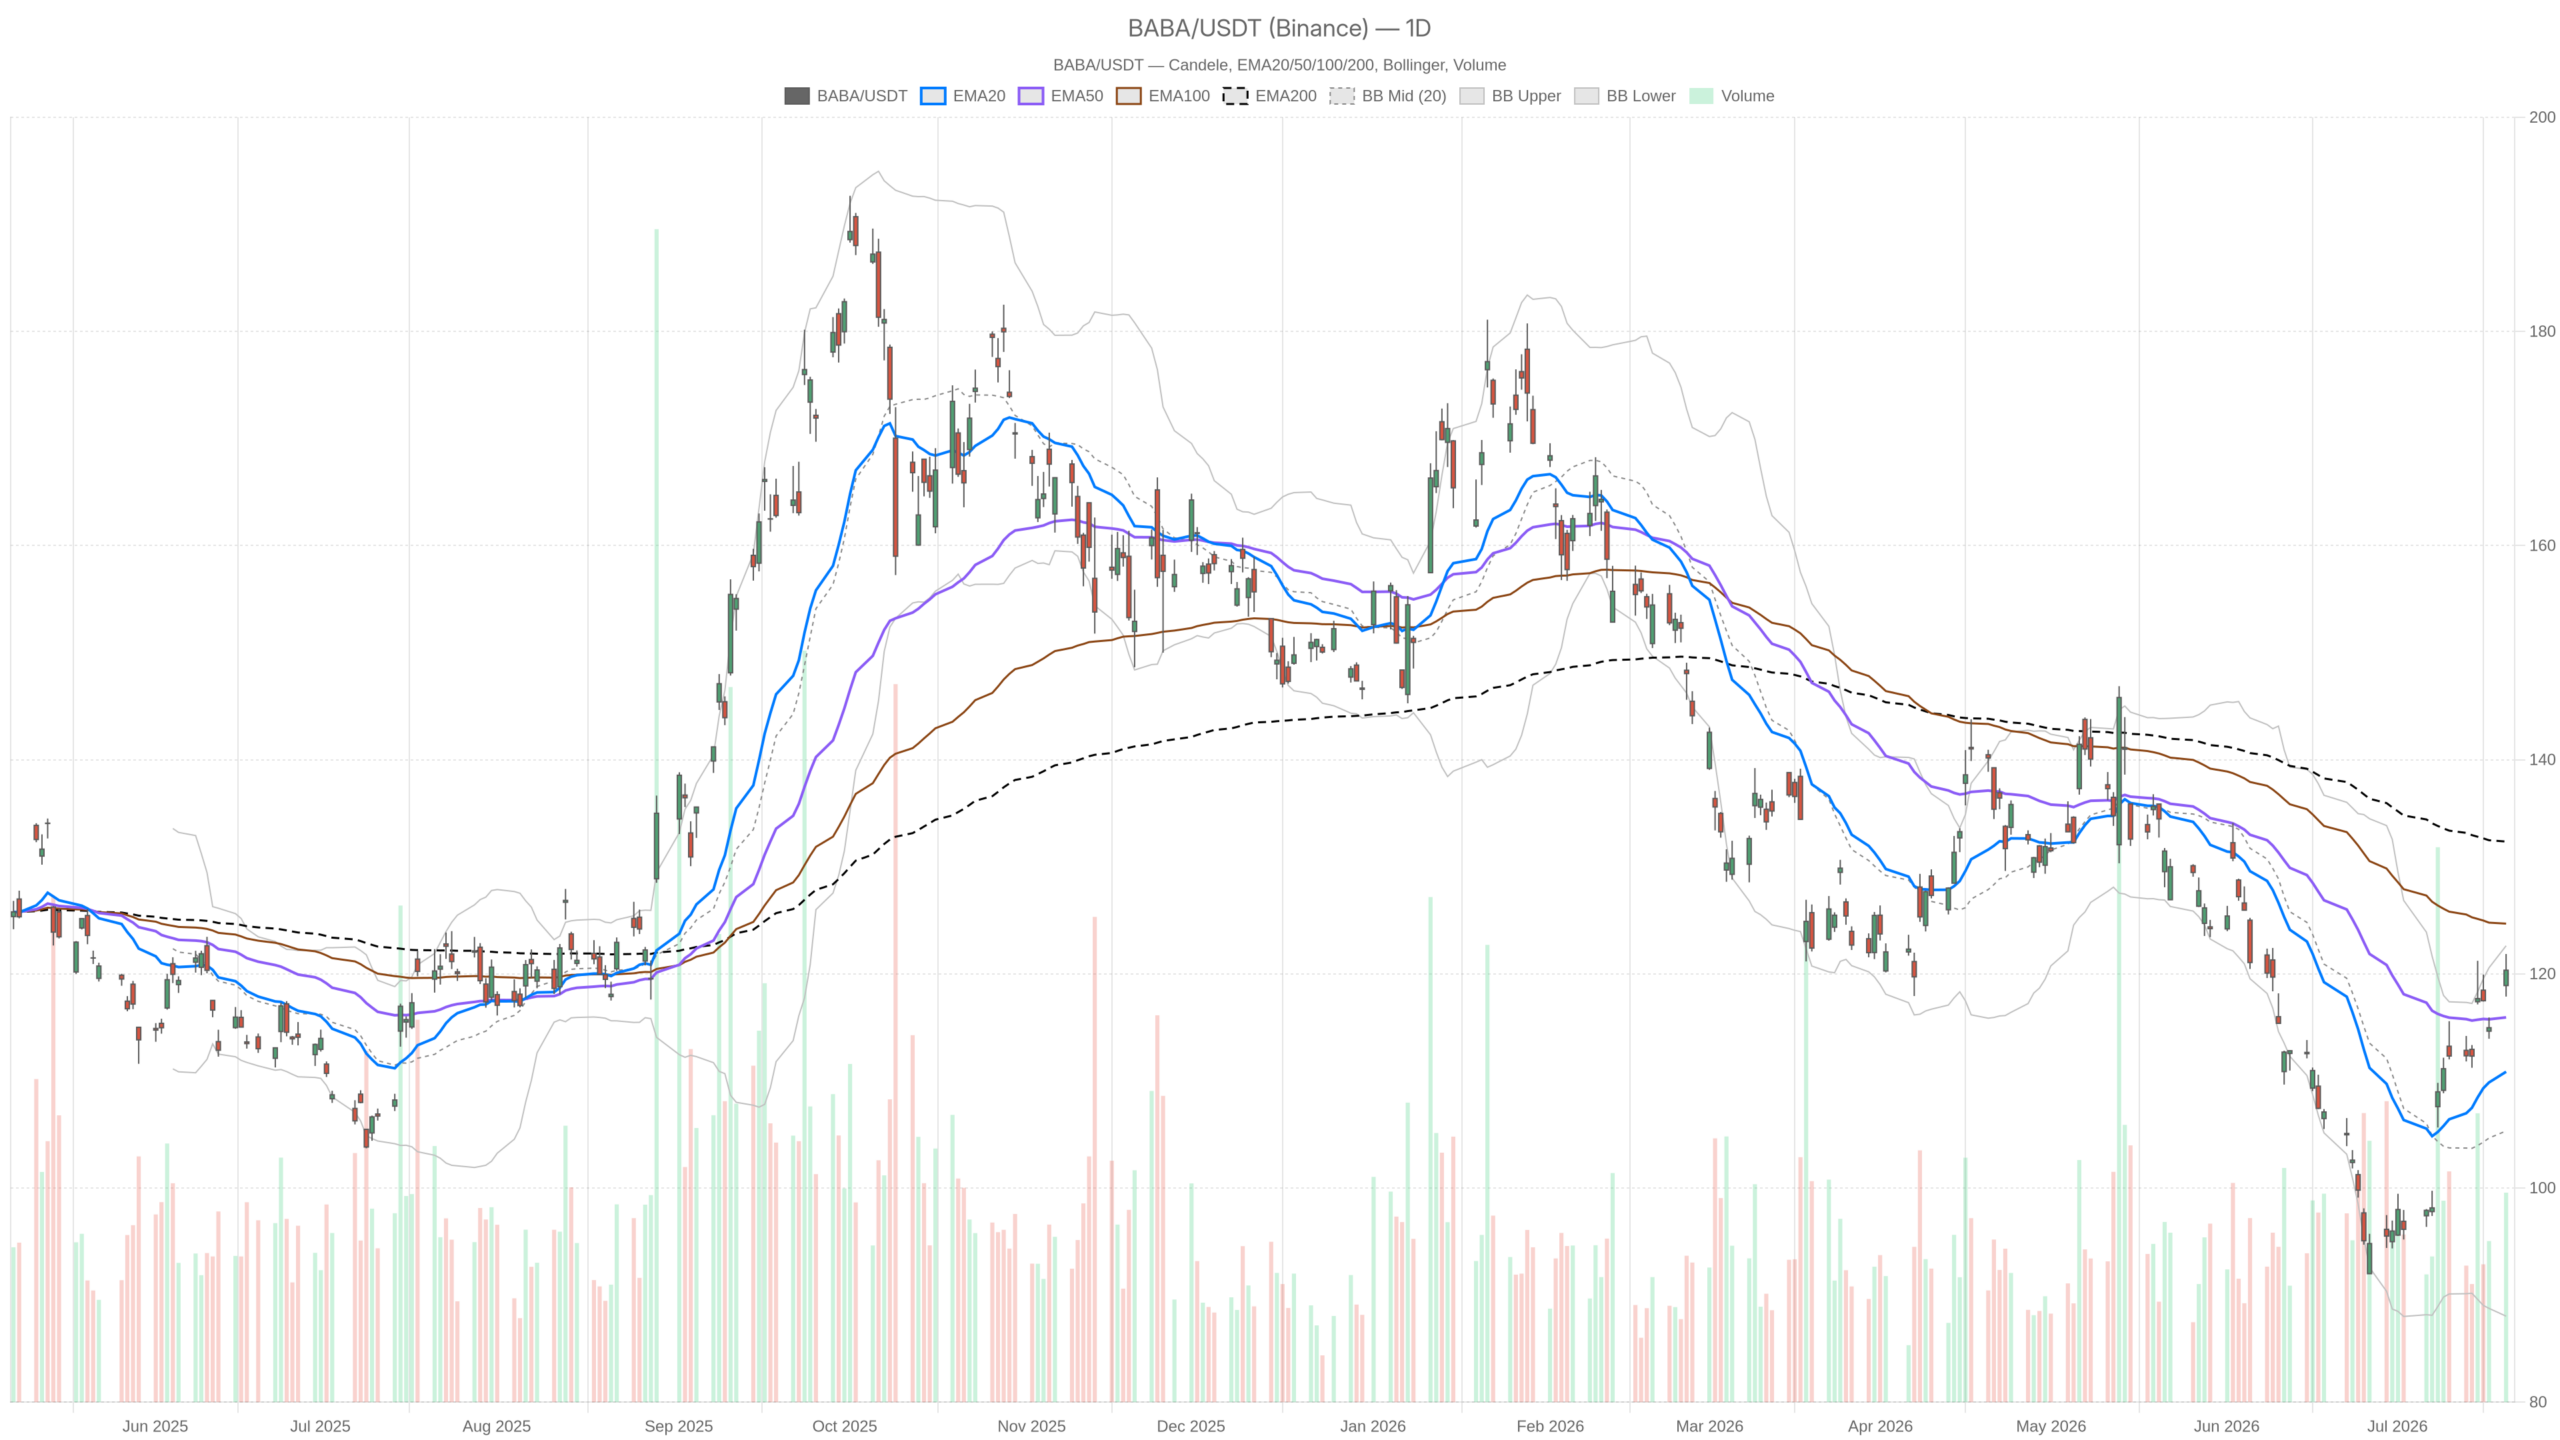
The daily chart shows BABA in a constructive recovery, yet the long-term trend remains unclaimed. Price sits well above both the EMA20 ($110.86) and EMA50 ($115.94). The separation between these two averages reflects a genuine shift in buying pressure — not just a brief technical bounce.
Momentum Indicators Signal Early-Stage Impulse
The daily RSI sits at 64.11. That level is firm without being overextended, leaving room for further upside. Notably, the MACD reinforces the constructive view. The MACD line at 0.77 has crossed above a signal line of -2.11, producing a histogram reading of 2.87. This kind of histogram expansion, after a prolonged negative signal, typically marks the early-to-mid stage of a bullish impulse.
Resistance Levels Define the Immediate Test
The Bollinger Bands paint a more nuanced picture. The midband at $105.33 sits well below current price, confirming BABA has broken decisively out of its consolidation range. However, the upper band at $122.62 is close. At Friday’s close of $120.34, the stock was within roughly $2.30 of that ceiling.
Critically, the daily EMA200 at $132.36 — a full $12 above current price — represents the dominant structural resistance. The daily regime is registered as neutral precisely because of this dynamic. BABA is recovering, but it has not reclaimed its long-term trend.
Meanwhile, the daily ATR of $4.24 signals meaningful volatility. Pivot analysis places the session’s pivot at $120.03, R1 at $122.17, and S1 at $118.20. The close at $120.34 lands marginally above the pivot — a slight edge to the bulls, but not a convincing breakout above R1.
Hourly Timeframe: Confirming the Bullish Lean
The 1H chart confirms rather than contradicts the constructive daily thesis, with a clean bullish stack and consistent momentum readings. Price at $120.36 sits above the EMA20 ($118.30), EMA50 ($115.16), and EMA200 ($111.82). This full bullish alignment tells us that buying pressure has been consistent across multiple intraday sessions, not just a single-session spike.
Notably, the hourly RSI at 64.9 mirrors the daily reading almost exactly. That consistency across timeframes adds conviction. The MACD on the 1H is also positive, with the line at 1.47 above the signal at 1.21 and a histogram of 0.25. The positive histogram is modest but remains in expansion territory — suggesting the move still has near-term traction.
At the same time, the hourly Bollinger upper band at $122.44 aligns closely with the daily R1 at $122.17. That confluence creates a defined resistance zone. On the downside, hourly support stands at $120.20 (S1), while the lower Bollinger band at $113.50 serves as a wider buffer.
15-Minute Chart: Hesitation at Current Levels
The 15m timeframe introduces a subtle caution signal, showing that immediate intraday momentum has stalled after the gap-driven session. The MACD histogram is at -0.27, meaning short-term momentum has tipped slightly negative. RSI at 57.12 is neutral, showing no immediate buying urgency.
Price is consolidating tightly, bracketed between a 15m S1 at $120.20 and R1 at $120.55. This points to a digestion phase rather than a reversal. Traders watching execution levels should note that a clean hold above $120.20 keeps the intraday structure intact.
The Bullish Case: AI Narrative Meets Recovering Structure
The bullish scenario for Alibaba Stock rests on two concrete pillars. First, the AI catalyst is real and product-driven. The Qwen3.8 Max launch directly triggered the premarket move, and the Kimi K3 backing adds a second layer of AI exposure. These are not speculative rumors — they are product launches with market-moving impact.
Second, the technical recovery is genuine. BABA has successfully reclaimed the EMA20 and EMA50 on the daily chart. The MACD crossover from deeply negative territory is early-cycle, historically a zone of strong follow-through.
What Needs to Happen Next
For the bull case to develop fully, price needs to clear the $122.17–$122.62 resistance zone with volume. A sustained close above that band would open a path toward the $125–$128 area. Continued positive newsflow around AI model development would strengthen that scenario materially.
The Bearish Scenario: Resistance Is Real and the EMA200 Is Far Away
The risks to Alibaba Stock cannot be dismissed, even as near-term momentum looks compelling. The EMA200 at $132.36 is the dominant overhead structure. That level will attract sellers who have been holding losing positions for months. The upper Bollinger Band and daily R1 converge around $122–$122.62, forming the first real test of this rally’s credibility.
If BABA fails to break that zone and rolls over, the first meaningful support sits at the daily S1 of $118.20. Below that, the EMA50 at $115.94 becomes the key line in the sand. A breakdown beneath the EMA50 on the daily would effectively neutralize the recovery thesis. Any deterioration in AI sentiment — whether from competitors, geopolitical friction, or regulatory news — could trigger such a reversal.
Positioning, Volatility, and the Bigger Picture
Alibaba Stock is at a technically interesting inflection point. The AI narrative is fresh, momentum is clearly building, and near-term timeframes are aligned to the upside. At the same time, the daily regime remains neutral. The EMA200 is far above, and short-term momentum shows early signs of fatigue at the highs.
Overall, the ATR of $4.24 on the daily chart reminds us this is a name capable of sharp intraday swings in either direction. Conviction should be earned at $122.62, not assumed before it. The next session will be telling.
FAQ
What is driving Alibaba Stock’s recent surge?
Two AI catalysts are fueling the move: Alibaba’s preview of its Qwen3.8 Max large language model and AI startup Moonshot’s launch of the record-setting Kimi K3 model, in which Alibaba is a major backer.
What is the key resistance level for BABA right now?
The immediate resistance zone sits at $122.17–$122.62, formed by the daily R1 pivot and the Bollinger upper band. Beyond that, the EMA200 at $132.36 represents the dominant structural overhead.
Is Alibaba Stock’s current rally sustainable?
The daily RSI at 64.11 is firm without being overextended, and the MACD crossover from negative territory suggests early-stage bullish impulse. However, the daily regime remains neutral because price remains below the EMA200. Failure to break above $122.62 could shift bias back to range-bound territory.
What support levels should traders watch on BABA?
The first meaningful support sits at daily S1 of $118.20. Below that, the EMA50 at $115.94 is the key line in the sand. A breakdown beneath the EMA50 would neutralize the recovery thesis.
Disclaimer: This article is for informational purposes only and does not constitute financial advice, an investment recommendation, or a solicitation to buy or sell any financial instrument or cryptocurrency. The analysis provided is not indicative of future results. Investing in crypto assets and financial markets carries a high risk of capital loss. Always do your own research (DYOR) and consult a qualified financial advisor before making any decision.
Article produced with the assistance of artificial intelligence and reviewed by the editorial team.
