



Nvidia stock trades at $203.28 on July 20, sitting just below its daily pivot of $204.43. The daily timeframe registers a neutral regime. Meanwhile, the 1H and 15m charts both flag bearish conditions — creating a tense setup for NVDA as fundamentals and technicals diverge.
Summary
Key takeaways
- NVDA closed at $203.28 on July 20, below the daily pivot of $204.43 and the EMA20/EMA50 cluster near $204.49.
- The daily RSI sits at 48.62 — neutral — while 1H and 15m regimes are both bearish.
- The EMA200 at $190.59 remains intact, confirming the long-term trend structure is not broken.
- A close above $204.49 would flip the short-term trend constructive and target the $213.60 resistance.
- Nvidia stock trades at a perceived 26% discount to fair value as AI revenue surges, though price has been flat since November.
Daily Bias: Nvidia Stock Stays Neutral but Not Without Tension
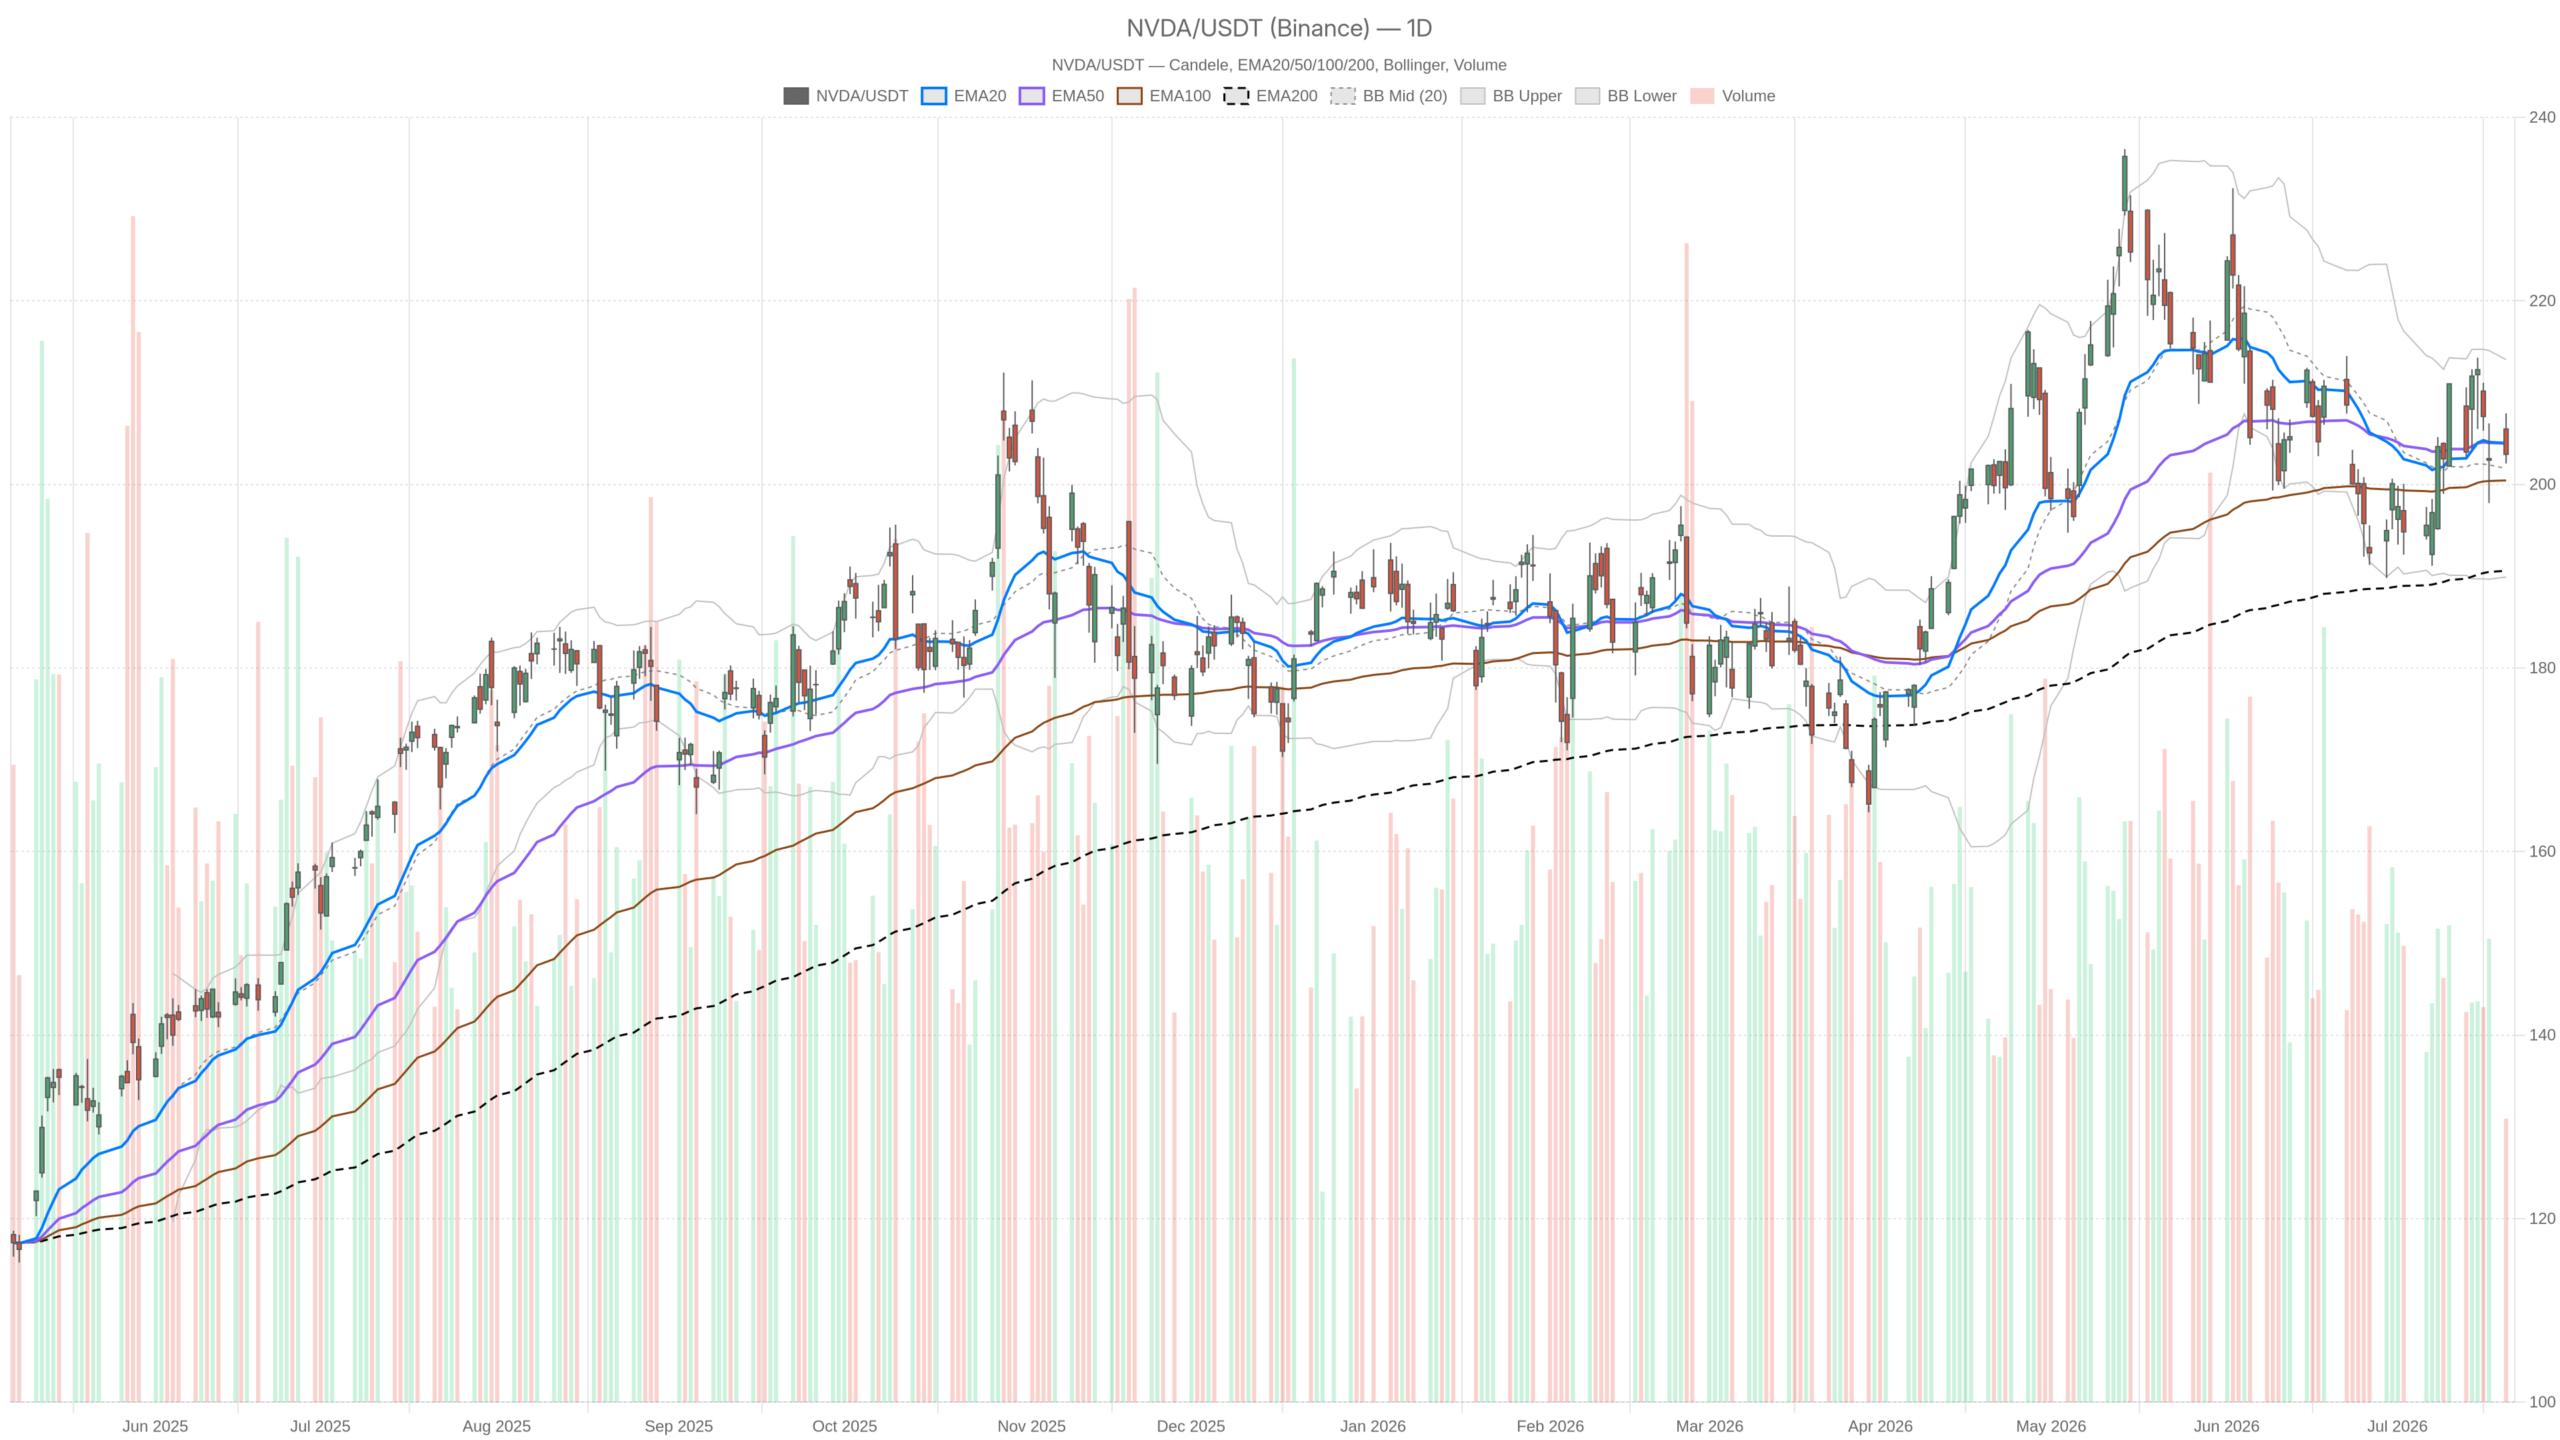
Nvidia stock’s daily bias is decidedly neutral. The EMA20 and EMA50 sit virtually on top of each other at $204.49 and $204.48. This near-perfect confluence signals the market has lost directional conviction. Price closed at $203.28, marginally below both averages. That small gap keeps the short-term trend from flipping constructive.
However, the EMA200 at $190.59 remains comfortably below current price. That gap confirms the broader secular trend is still intact. Nvidia stock has not broken its long-term structure. It has simply stalled within it.
The daily RSI at 48.62 reinforces this equilibrium. It sits just below the midpoint — not oversold, not overbought. There is no momentum extreme to lean on. Meanwhile, the MACD adds a subtle nuance: the MACD line at -0.02 is barely negative. But the histogram reading of +0.83 shows the gap between line and signal is narrowing constructively. This is not a confirmed bullish crossover. It does suggest selling pressure is starting to ease.
Meanwhile, Bollinger Bands on the daily frame place the midline at $201.75, with price trading above it. The upper band at $213.60 defines the next meaningful resistance zone. The lower band at $189.91 sits close to the EMA200 — a natural double-support floor if conditions deteriorate sharply. Daily ATR of $7.28 reflects moderately elevated volatility. Intraday swings of that magnitude remain well within normal range.
Hourly Timeframe Complicates the Picture
The 1H chart tells a different story for NVDA: it registers an explicitly bearish regime, conflicting with the daily neutral reading.
At this timeframe, price at $203.38 sits below all three key hourly EMAs. The EMA20 at $205.16, EMA50 at $205.33, and EMA200 at $205.37 align within a tight $0.21 band — all pointing against price. This is a technically significant bearish signal.
Furthermore, the 1H RSI at 43.26 confirms weak momentum without reaching oversold territory. There is no capitulation signal here — just steady, persistent selling. The hourly MACD is negative on both line (-0.95) and histogram (-0.18). Notably, the histogram shows bearish divergence is still expanding. That matters for short-term traders looking for a bounce entry.
In addition, the hourly Bollinger midline at $205.11 sits above current price. This reinforces that price is trading in the lower half of its recent range. The pivot structure is tight: resistance at $203.69, support at $202.83. NVDA is essentially pinned between these two levels in the short term.
15-Minute Context: No Reversal Signal Yet
At the 15-minute level, NVDA’s bearish regime persists with no reversal signal emerging.
Here, price remains below the EMA20 ($203.97), EMA50 ($204.69), and EMA200 ($204.89). The MACD is negative and the histogram is still dragging lower at -0.14. RSI at 44.5 offers no clear oversold signal to anchor a tactical long. The 15m ATR of $0.81 confirms tight near-term volatility. The market is not panicking, but it is not buying either. Any meaningful recovery would need to clear the 15m EMA cluster before the hourly structure could even be challenged.
Fundamental Backdrop: Discount Narrative Meets Flat Price Reality
The fundamental backdrop for Nvidia stock diverges notably from the technical hesitation.
Notably, one headline flags NVDA trading at a 26% discount to fair value as AI revenue surges. Another notes the paradox directly: the stock has been flat since November despite tripling its net income. That is not a bearish fundamental thesis — it is a valuation re-rating problem. The market has been digesting an extraordinary earnings expansion without pushing price materially higher.
Additionally, Nvidia disclosed a 9.3% stake in neocloud computing firm Nebius. This strategic investment underscores management’s intent to deepen exposure across the AI infrastructure ecosystem. Separately, Micron and Nvidia are cited as key drivers of S&P 500 Q2 profit growth. Earnings season is now testing whether Big Tech’s results can match elevated expectations. Chipmakers, including NVDA, rebounded on July 20 as the broader market absorbed a selloff. However, the S&P 500 ultimately finished lower, weighed down by declines in Apple and Tesla.
Bullish Scenario: What Would Confirm an NVDA Resumption
The bullish case for Nvidia stock rests on the daily structure holding and intraday bearish pressure resolving upward.
For that to materialize, NVDA needs to reclaim the daily pivot at $204.43. It must also push through the EMA20/EMA50 cluster near $204.49. A close above that level would flip the short-term trend constructive. It would also bring the upper Bollinger band target of $213.60 back into view.
Still, the positive daily MACD histogram already hints this is possible — the momentum deterioration is stalling. If the AI revenue narrative continues to attract institutional buyers at this perceived 26% discount, the fundamental catalyst is already present. The earnings season context adds a potential catalyst. Strong results from NVDA’s peer group could lift sentiment across the semiconductor space.
Bearish Scenario: What Would Invalidate the NVDA Bull Case
The bearish scenario gains traction if NVDA fails to reclaim the EMA cluster and instead breaks hourly pivot support.
Below $202.83, the next meaningful reference is the daily S1 at $201.13. A sustained break there would open space toward the Bollinger lower band at $189.91. Notably, this level converges with the EMA200 around $190.59. That zone would represent a roughly 6-7% drawdown from current levels.
The combination of all hourly EMAs stacked above price, persistent negative MACD momentum, and flat price action despite earnings growth creates a credible case for continued consolidation at best — and a leg lower at worst. Meanwhile, the broader market context provides limited macro support. The S&P 500 closed lower on July 20 despite a chipmaker rebound.
Positioning and Volatility Outlook
Overall, Nvidia stock presents a technically indecisive but fundamentally charged setup.
On the daily timeframe, the regime is neutral, capped by a flat EMA structure and a mid-range RSI. The intraday picture is more explicitly bearish. Hourly and 15m regimes are aligned against price. The key tension is between a compelling long-term fundamental narrative — surging AI revenue, strategic investments, and a perceived valuation discount — and a price structure that has simply not broken higher.
Daily ATR of $7.28 means noise is inherent in any short-term read. Traders and investors should watch the $204.43–$204.49 resistance zone closely. How NVDA responds to that cluster in the sessions ahead will likely define the next directional move. Either this neutral consolidation resolves into a genuine recovery or it slides toward deeper support.
FAQ
What is the current technical bias for Nvidia stock?
The daily timeframe shows a neutral bias, with price at $203.28 sitting below the EMA20/EMA50 cluster near $204.49. However, the 1H and 15m timeframes both register bearish regimes, adding near-term selling pressure to the setup.
Where is the key resistance level for NVDA?
The critical resistance zone sits at $204.43–$204.49, which includes the daily pivot point and the converging EMA20/EMA50. A close above this cluster would flip the short-term trend constructive and target the upper Bollinger band at $213.60.
What fundamental factors support Nvidia stock?
NVDA trades at a perceived 26% discount to fair value as AI revenue surges. The company also disclosed a 9.3% stake in neocloud firm Nebius, and it is cited as a key driver of S&P 500 Q2 profit growth alongside Micron.
What is the bearish risk for NVDA right now?
A break below hourly pivot support at $202.83 would open space toward daily S1 at $201.13. A sustained decline could reach the Bollinger lower band near $189.91, which converges with the EMA200 around $190.59 — representing a 6-7% drawdown from current levels.
Disclaimer: This article is for informational purposes only and does not constitute financial advice, an investment recommendation, or a solicitation to buy or sell any financial instrument or cryptocurrency. The analysis provided is not indicative of future results. Investing in crypto assets and financial markets carries a high risk of capital loss. Always do your own research (DYOR) and consult a qualified financial advisor before making any decision.
Article produced with the assistance of artificial intelligence and reviewed by the editorial team.
