

Summary
Key takeaways
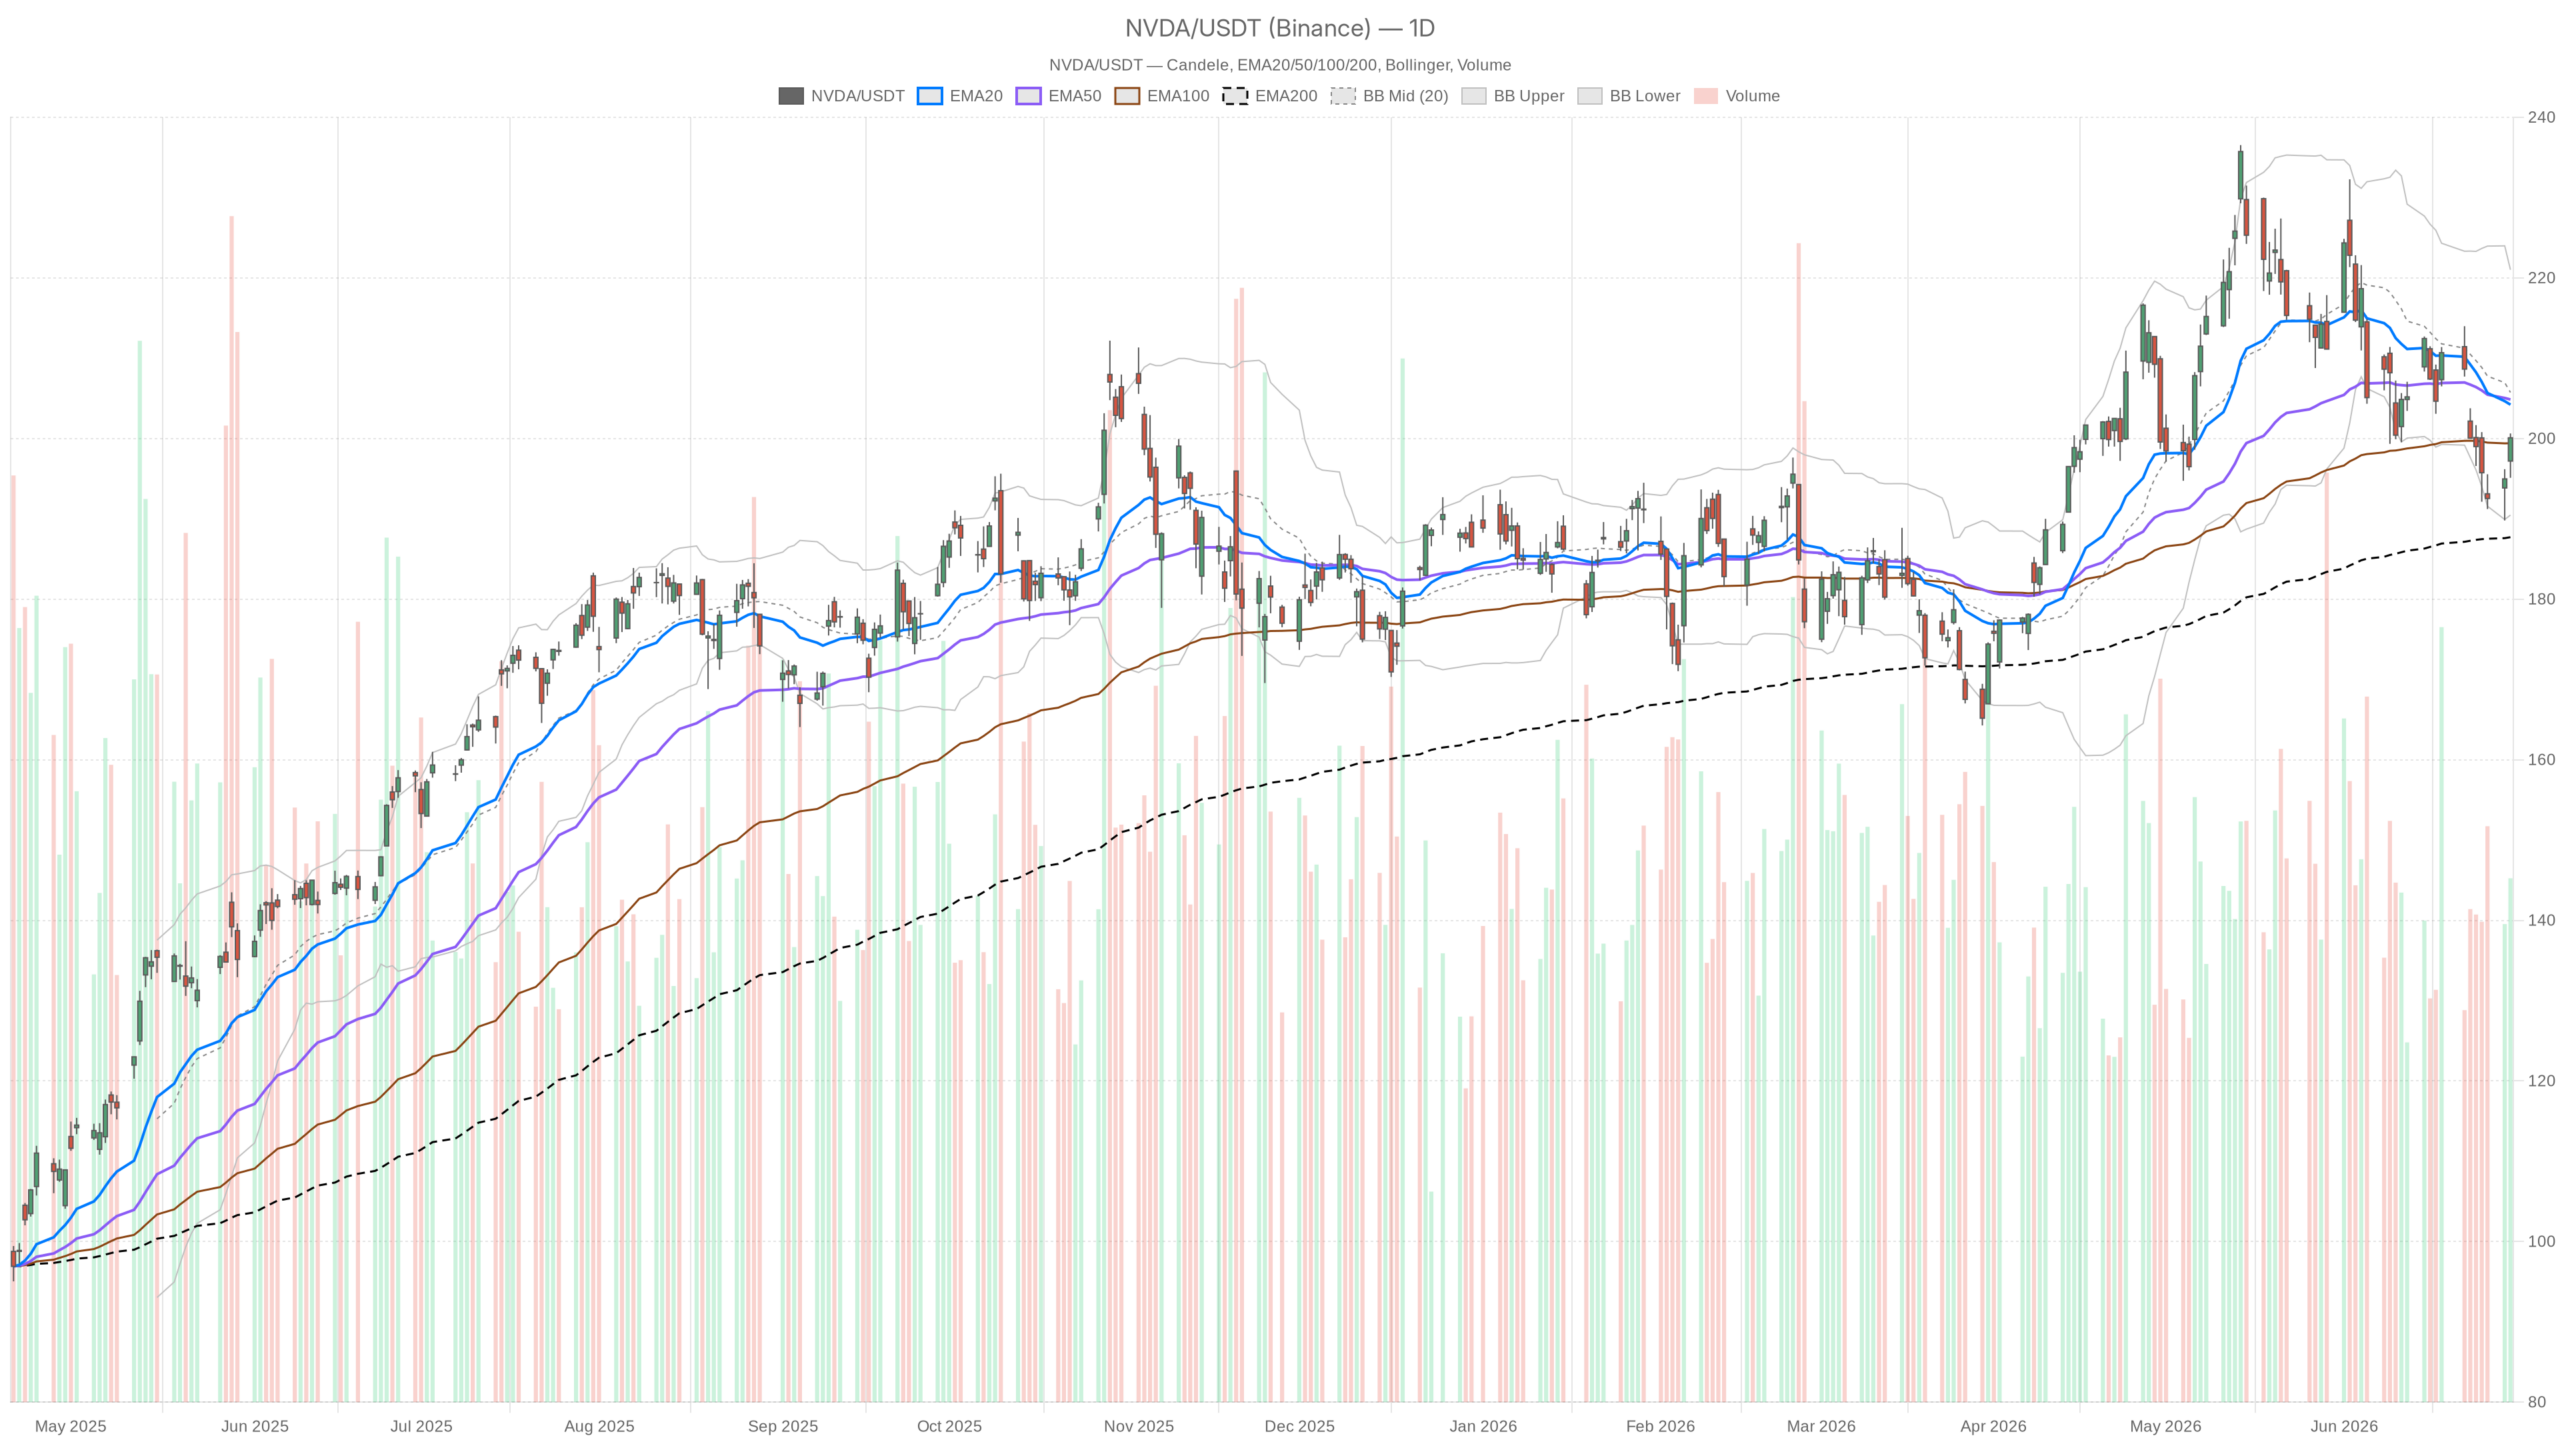
- Nvidia stock closed June at $200.09, down roughly 8% for the month and trapped below key daily moving averages.
- The daily trend remains bearish. Both EMA20 and EMA50 sit above price near $204–$205, forming layered resistance.
- Hourly momentum has turned bullish. Price trades above intraday EMAs with MACD crossing positive — a genuine short-term shift.
- The $204–$207 resistance zone will determine whether this recovery gains traction or fades into the broader downtrend.
- Daily ATR of $6.34 signals elevated volatility. Positioning aggressively without a confirmed structural break carries real risk.
Nvidia stock enters July precariously after sliding roughly 8% through June. NVDA closed at $200.09 on June 30 — above the $198.61 pivot but below key daily moving averages. The daily chart shows lost medium-term momentum. Until price reclaims those levels, the structural path of least resistance remains downward.
Daily Trend Structure: Bears Maintain Control
The daily bias is clearly bearish-to-neutral. Both the EMA20 at $204.22 and EMA50 at $204.86 sit above price, acting as a layered resistance ceiling. Meanwhile, the EMA200 at $187.72 provides the longer-term floor. It reminds us the broader uptrend is not broken. Price is caught between macro support and medium-term resistance — a compression zone that eventually resolves with force.
Daily RSI at 45.21 reinforces the cautious read. It has room to fall further without triggering an oversold signal. Sellers retain the near-term advantage on the daily chart. The MACD tells the same story. The line sits at -3.88 against a signal of -2.57. The negative histogram of -1.31 confirms momentum is still deteriorating. No crossover yet suggests a reversal is forming.
Bollinger Bands place the midline at $205.74, well above current price. Nvidia stock is trading in the lower half of the band — a classically weak positioning. The lower band at $190.47 represents a near-term downside magnet if selling pressure accelerates. Daily ATR of $6.34 confirms this is a volatile name. Sharp moves in either direction should not surprise.
Short-Term Momentum Pushes Back on the Hourly Chart
However, the hourly picture complicates the bearish daily thesis meaningfully. On the 1H chart, NVDA trades above both its EMA20 at $196.93 and EMA50 at $198.82. Price closed the last hourly session at $199.77, well above these intraday moving averages. The 1H MACD has turned positive. The line at 0.34 crossed above the signal at -0.57. The resulting histogram of 0.91 marks a genuine short-term momentum shift.
RSI at 60.93 on the hourly confirms buyers are in control of the near-term tape. In contrast, the 1H EMA200 sits at $206.51 — above current price. It aligns closely with the resistance cluster formed by the daily EMAs. This is a meaningful convergence. Short-term buyers are pushing higher, but they are running directly into layered resistance between roughly $204 and $207.
That zone will define whether this intraday recovery becomes something more significant. Otherwise, it simply fades into the broader downtrend.
Micro-Level Exhaustion on the 15-Minute Timeframe
On the 15-minute chart, the execution picture is nuanced. RSI has climbed to 69.22 — approaching overbought territory at the micro level. The MACD histogram on the 15m has turned fractionally negative at -0.02. This suggests the immediate momentum pulse may be exhausting. Price is bumping against the upper Bollinger Band at $199.50. The most recent high sits at $200.63.
At the same time, 15m EMAs are stacked bullishly. This supports any shallow dip as a potential re-entry point for intraday longs. Notably, this is a market in short-term fatigue, not reversal — an important distinction for traders.
Fundamental Backdrop: Structural Tailwinds vs. Headline Pressure
On the news front, the fundamental backdrop carries its own tension. Bernstein reiterated an Outperform rating on Nvidia stock. The firm positions Nvidia as the central intelligence layer for the robotics industry — a genuine structural growth narrative. SemiAnalysis projects second-half data center revenue running 20% above consensus. That is a material upside catalyst if it materialises.
On the other hand, both China and OpenAI are reportedly reducing their Nvidia chip dependency. That headline pressure has weighed on sentiment. It likely contributed to June’s 8% decline. Yet NVDA still traded higher on that news — a telling sign. The market is increasingly pricing Nvidia’s resilience into its base case. Still, the technical damage on the daily chart has not been repaired. Sentiment is one thing; structure is another.
Nvidia Stock Bullish Scenario
The bullish scenario rests on a convincing reclaim of the $204–$207 resistance cluster. If short-term momentum on the 1H chart persists, buyers could push through the layered EMA resistance. The next meaningful target sits near the Bollinger midline at $205.74. A weekly close above $207 would shift the daily bias decisively. It would open a path toward prior highs. Strong H2 data center results ahead of expectations would serve as the fundamental trigger.
Nvidia Stock Bearish Scenario
The bearish scenario is that this intraday bounce fades at resistance. Most counter-trend moves do when the daily trend is negative. A rejection at $200–$202 followed by a break below the $196.59 daily S1 pivot would confirm bears are still in control. In that case, the lower Bollinger Band near $190.47 becomes the logical next target. It converges with the EMA200 at $187.72 — a roughly 5–6% downside from current levels.
Overall Outlook
Overall, Nvidia stock sits at a genuine inflection point heading into July. The daily trend is bearish. The hourly is recovering. The 15-minute is near-term extended. Traders seeking directional conviction need to see price break through the $204–$207 resistance zone or fail convincingly at current levels. Volatility remains elevated with a daily ATR near $6.34. Positioning aggressively without a confirmed structural break carries real risk in this environment.
FAQ
What is the key resistance zone for Nvidia stock right now?
The critical resistance zone sits between $204 and $207. This cluster is formed by the daily EMA20 at $204.22, the daily EMA50 at $204.86, and the 1H EMA200 at $206.51. A weekly close above $207 would shift the daily bias decisively bullish.
Is Nvidia stock still in a long-term uptrend?
Yes. Despite the bearish daily momentum, Nvidia stock remains above the daily EMA200 at $187.72. This key long-term moving average is still rising, indicating the broader structural uptrend has not been broken — only challenged.
What does the hourly chart say about short-term momentum?
The 1H chart shows a genuine bullish shift. Price trades above the EMA20 and EMA50. The MACD has turned positive with a histogram of 0.91. RSI sits at 60.93, confirming buyers control the near-term tape. However, this recovery is running into heavy resistance above.
What fundamental catalysts could move Nvidia stock in July?
Key catalysts include SemiAnalysis projections of data center revenue 20% above consensus in H2 and Bernstein’s robotics thesis. On the negative side, reports of China and OpenAI reducing chip dependency could pressure sentiment further. The interplay between these narratives and the technical structure will likely define July’s direction.
Disclaimer: This article is for informational purposes only and does not constitute financial advice, an investment recommendation, or a solicitation to buy or sell any financial instrument or cryptocurrency. The analysis provided is not indicative of future results. Investing in crypto assets and financial markets carries a high risk of capital loss. Always do your own research (DYOR) and consult a qualified financial advisor before making any decision.
Article produced with the assistance of artificial intelligence and reviewed by the editorial team.