

Nvidia stock sits at a critical inflection point at $200.04, having slipped below key short- and medium-term moving averages as momentum indicators deteriorate. The daily structure is not outright bearish, but evidence now points to meaningful selling pressure rather than consolidation ahead of a move higher.
Summary
Key takeaways
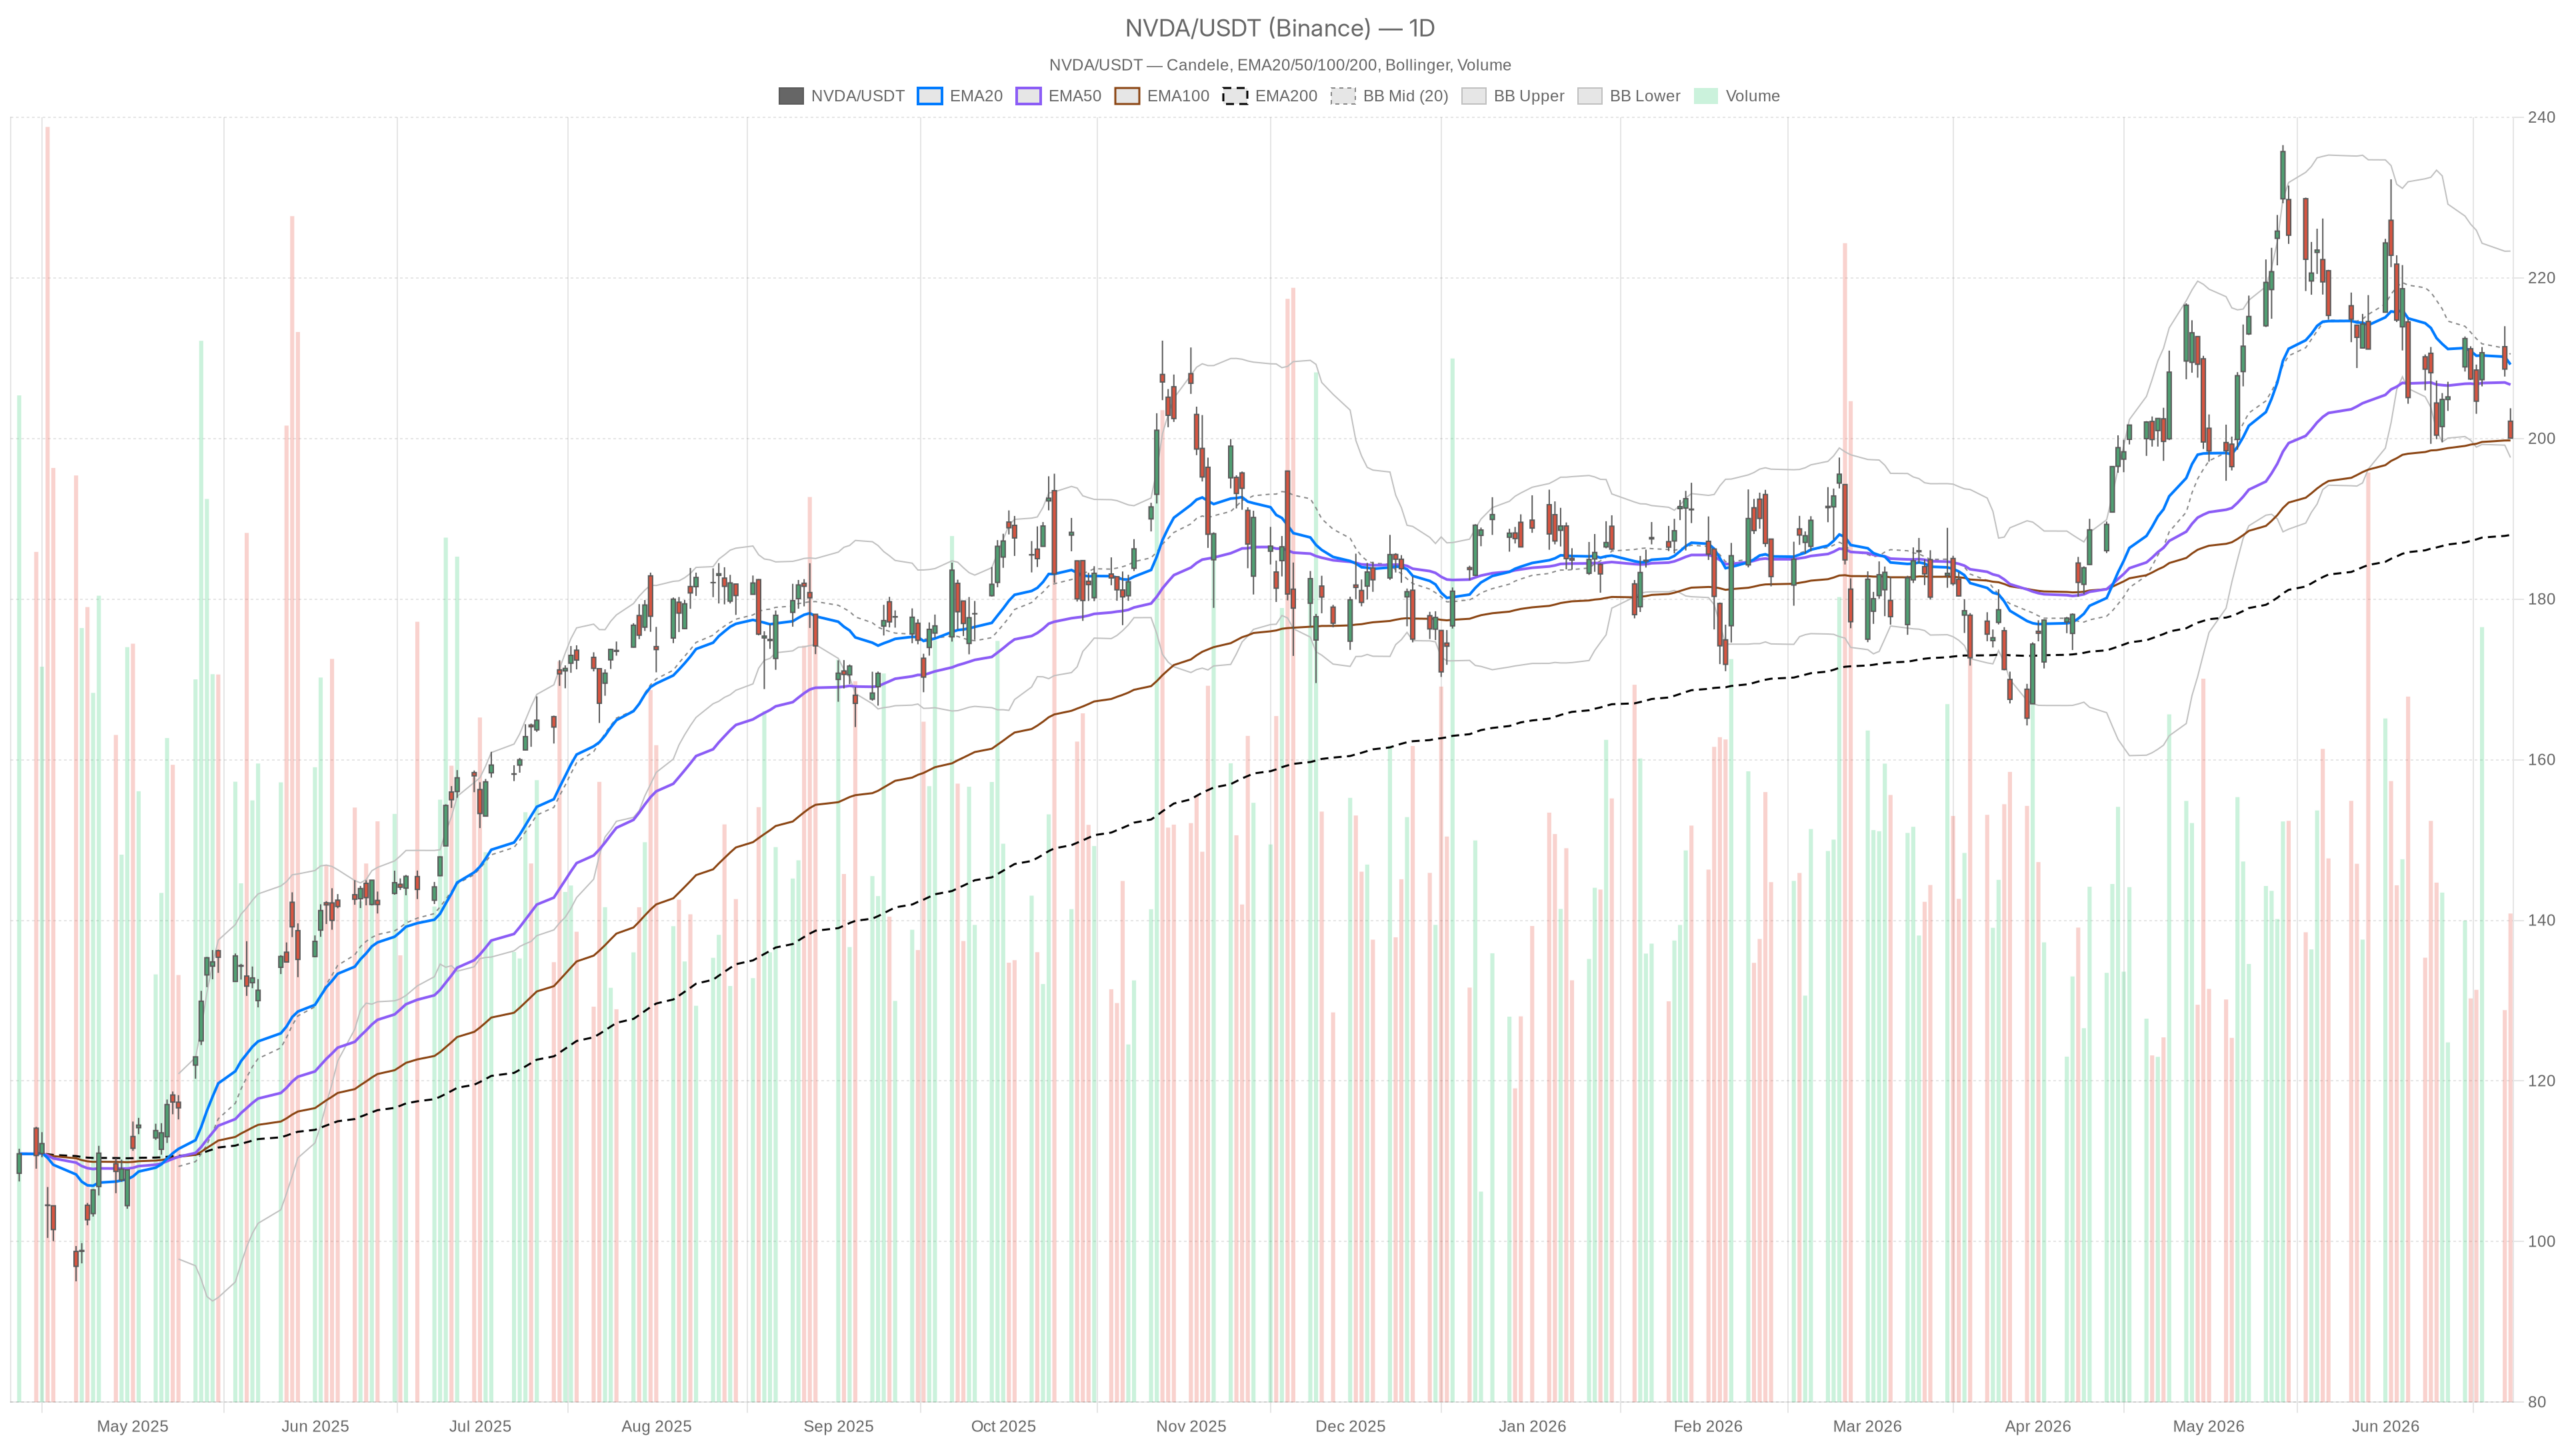
- NVDA trades at $200.04, below the EMA20 ($209.22) and EMA50 ($206.71), with both now acting as overhead resistance.
- Daily MACD is deteriorating with widening negative divergence, signaling building rather than peaking downside momentum.
- The 1H RSI sits oversold at 29.6, yet shows no signs of recovering — typical of a strong downtrend.
- The daily EMA200 at $188 remains the critical long-term trend anchor separating a correction from a structural breakdown.
- Near-term bearish pressure dominates; bulls need to reclaim the $206–$209 zone with volume confirmation to shift the bias.
Daily Timeframe: Neutral Regime, but Bias Tilting Bearish
A report that South Korea’s SK Hynix is slowing its high-bandwidth memory expansion sent shockwaves through the AI-chip complex. NVDA dropped roughly 3.7% in a single session. That supply-chain signal matters for Nvidia specifically, given its deep dependency on HBM for data center GPUs. The move reinforced how sensitive Nvidia stock remains to any hint of deceleration in AI infrastructure spending.
Moving Averages Flip to Resistance
On the daily chart, the regime is technically neutral — yet the details tell a more cautious story. Price closed at $200.04, well below the EMA20 at $209.22 and the EMA50 at $206.71. Both averages now act as overhead resistance. The one structural positive is the EMA200 sitting at $188, still comfortably below current price. That longer-term trend floor has not been tested. It remains the key reason the daily bias has not fully collapsed to bearish.
MACD and RSI Signal Building Downside Pressure
However, the daily MACD is clearly deteriorating. The MACD line at -1.68 has crossed below the signal at -0.57, with a histogram reading of -1.11. This is not a minor wobble — the divergence is widening, signaling that downside momentum is building rather than peaking. RSI at 42.48 sits in neutral-bearish territory, not yet oversold but heading in that direction. There is still room to fall before daily RSI reaches a technically oversold reading that would attract mean-reversion buyers.
Bollinger Bands Frame the Next Support Test
The Bollinger Band picture adds nuance. With the midline at $210.49 and the lower band at $197.63, NVDA is trading in the lower third of its daily band. Price is approaching the lower band but has not definitively broken through it. A close beneath $197.63 would be a more alarming signal. For now, the $200 area also coincides with the daily pivot support at S1 ($198.77). This creates a short-term structural floor that traders are watching closely.
Daily ATR at $7.80 reflects a still-volatile environment. Intraday swings of that magnitude are normal for NVDA, but they also mean any breakdown or recovery could move fast and aggressively.
1H Timeframe Confirms Bearish Pressure
The hourly picture is more clearly bearish and reinforces the daily weakness. On the 1H chart, price is trading below all three key EMAs. The EMA20 sits at $205.16, the EMA50 at $206.88, and the EMA200 at $210.32. That bearish EMA stack confirms the intraday trend is firmly to the downside, with no near-term recovery having gained traction.
The 1H RSI at 29.6 is the most striking data point on this timeframe. It sits just below the 30 threshold — technically oversold. In isolation, that would suggest a bounce is overdue. In context, however, oversold readings in a strong downtrend often persist longer than expected before generating any meaningful relief rally. The 1H MACD continues to print deep negative values with no histogram reversal in sight. This is not a picture of exhausted selling — it is active, ongoing bearish momentum.
Meanwhile, the 1H Bollinger Band lower rail sits at $199.03, and NVDA is essentially trading right on top of it. That proximity to the lower band, combined with the oversold RSI, creates a setup where a technical bounce could emerge. However, it would be a relief rally within a downtrend rather than a structural reversal.
15-Minute Chart: One Small Signal Worth Watching
At the execution level, the 15-minute chart tells a similar bearish story, though with one minor wrinkle. The MACD histogram has ticked into slightly positive territory at +0.09, even as the MACD line remains deeply negative at -1.27. That micro-divergence and a 15m RSI of 30.12 at the oversold line suggest the selling pace may be decelerating slightly. It is not a reversal signal. It is a small hint that the intensity of the most recent leg lower may be briefly exhausting itself.
The 15m Bollinger Bands are extremely compressed, with the upper at $203.03 and lower at $200.07. This indicates tight, low-volatility consolidation forming right at the lows. A break in either direction from this range will likely be decisive at the short-term level. The 15m pivot structure places resistance at $200.83 and S1 support at $199.61.
Bullish Scenario: What Nvidia Stock Needs to Recover
The bullish case for Nvidia stock is not dead, but it requires some repair work. For the stock to reassert upside momentum, price needs to reclaim the $206–$209 zone. That is where both the EMA50 and EMA20 on the daily chart converge. A move back above those levels would shift the short-term trend structure and give bulls a credible base to work from.
Fundamentally, the bullish narrative remains intact at a higher level. Nvidia has officially become the world’s largest stock by market cap. Analysts note that none of 2027’s anticipated earnings growth is currently priced into the stock. This could make the pullback a compelling entry point for longer-term investors. The company’s AI-driven ecosystem strategy continues to deepen its structural moat. This includes small acquisitions and neocloud bets on platforms like CoreWeave and Nebius. A robotics breakthrough highlighted in recent news further underscores that the growth story extends well beyond GPUs alone.
In addition, the daily EMA200 at $188 offers a meaningful cushion. As long as NVDA holds well above that level, the long-term trend structure remains fundamentally bullish, even amid this short-term turbulence.
Bearish Scenario: Risks That Could Accelerate Nvidia Stock’s Decline
On the other hand, the bearish risks are real and should not be dismissed. A confirmed daily close below $197.63 — the lower Bollinger Band — would signal that the current correction is deepening. From there, the $188 EMA200 becomes the next major target and a test of whether the long-term trend can hold.
The HBM supply-chain concern is not trivial. If SK Hynix’s slowdown reflects genuine demand uncertainty rather than a temporary supply recalibration, it could pressure Nvidia’s near-term shipment outlook. Any further deterioration in that narrative would likely weigh on the stock independently of its broader long-term story. The daily MACD continuing to widen to the downside would confirm this is a sustained correction, not a brief dip.
Moreover, NVDA is trading below both the EMA20 and EMA50 on the daily chart. With the 1H regime firmly bearish, the path of least resistance in the near term remains to the downside. Bulls need to step in decisively around the $200 level to change that dynamic.
Nvidia Stock Positioning and Volatility Context
Overall, Nvidia stock sits in a precarious but not catastrophic position. The daily trend anchor — the EMA200 — remains well below current price, preserving the long-term bullish structure. Yet the near-term picture is one of a stock under active selling pressure. Daily momentum is negative, hourly RSI is oversold but not recovering, and price clings to the $200 psychological support level. That level is being tested, not bouncing cleanly. A daily ATR of nearly $8 means this situation can resolve quickly in either direction.
Traders navigating NVDA right now face a genuine tension. The oversold hourly readings invite short-term long setups, but the broader momentum backdrop does not yet support high-conviction directional exposure. Until price reclaims at least the $206 area with volume and momentum confirmation, the risk remains skewed to further weakness. Patience and confirmation matter more than speed here.
FAQ
Is Nvidia stock still in a long-term bullish trend?
Yes, the long-term structure remains bullish as long as NVDA holds above the daily EMA200 at $188. That level has not been tested during this pullback, preserving the higher-timeframe uptrend. However, short- and medium-term momentum has turned clearly negative.
What is the key support level for Nvidia stock right now?
The immediate support zone sits at $197.63 — the daily lower Bollinger Band — reinforced by the daily pivot S1 at $198.77 and the psychological $200 level. A close below $197.63 would open the door to a test of the EMA200 at $188.
What caused Nvidia stock to drop recently?
A report that South Korea’s SK Hynix is slowing its high-bandwidth memory expansion triggered the sell-off. Given Nvidia’s deep dependency on HBM for its data center GPUs, any supply-chain deceleration signal directly pressures the stock’s near-term outlook.
What needs to happen for Nvidia stock to reverse higher?
NVDA must reclaim the $206–$209 zone — where the daily EMA50 and EMA20 converge — with volume and momentum confirmation. Without that, any bounces are likely relief rallies within a downtrend rather than durable reversals.
Disclaimer: This article is for informational purposes only and does not constitute financial advice, an investment recommendation, or a solicitation to buy or sell any financial instrument or cryptocurrency. The analysis provided is not indicative of future results. Investing in crypto assets and financial markets carries a high risk of capital loss. Always do your own research (DYOR) and consult a qualified financial advisor before making any decision.
Article produced with the assistance of artificial intelligence and reviewed by the editorial team.