



Zhongchao Inc. stock staged an extreme intraday surge on July 22, hitting $11.93 before closing at $4.30. The nearly 460% range from open to high signals a volatility event, not a normal session. Whether this marks a genuine reversal or another bounce inside a structurally broken chart remains the central question.
Summary
Key takeaways
- Zhongchao Inc. stock hit an intraday high of $11.93 on July 22 before closing at $4.30 — a range reflecting extreme volatility with an open at just $2.27.
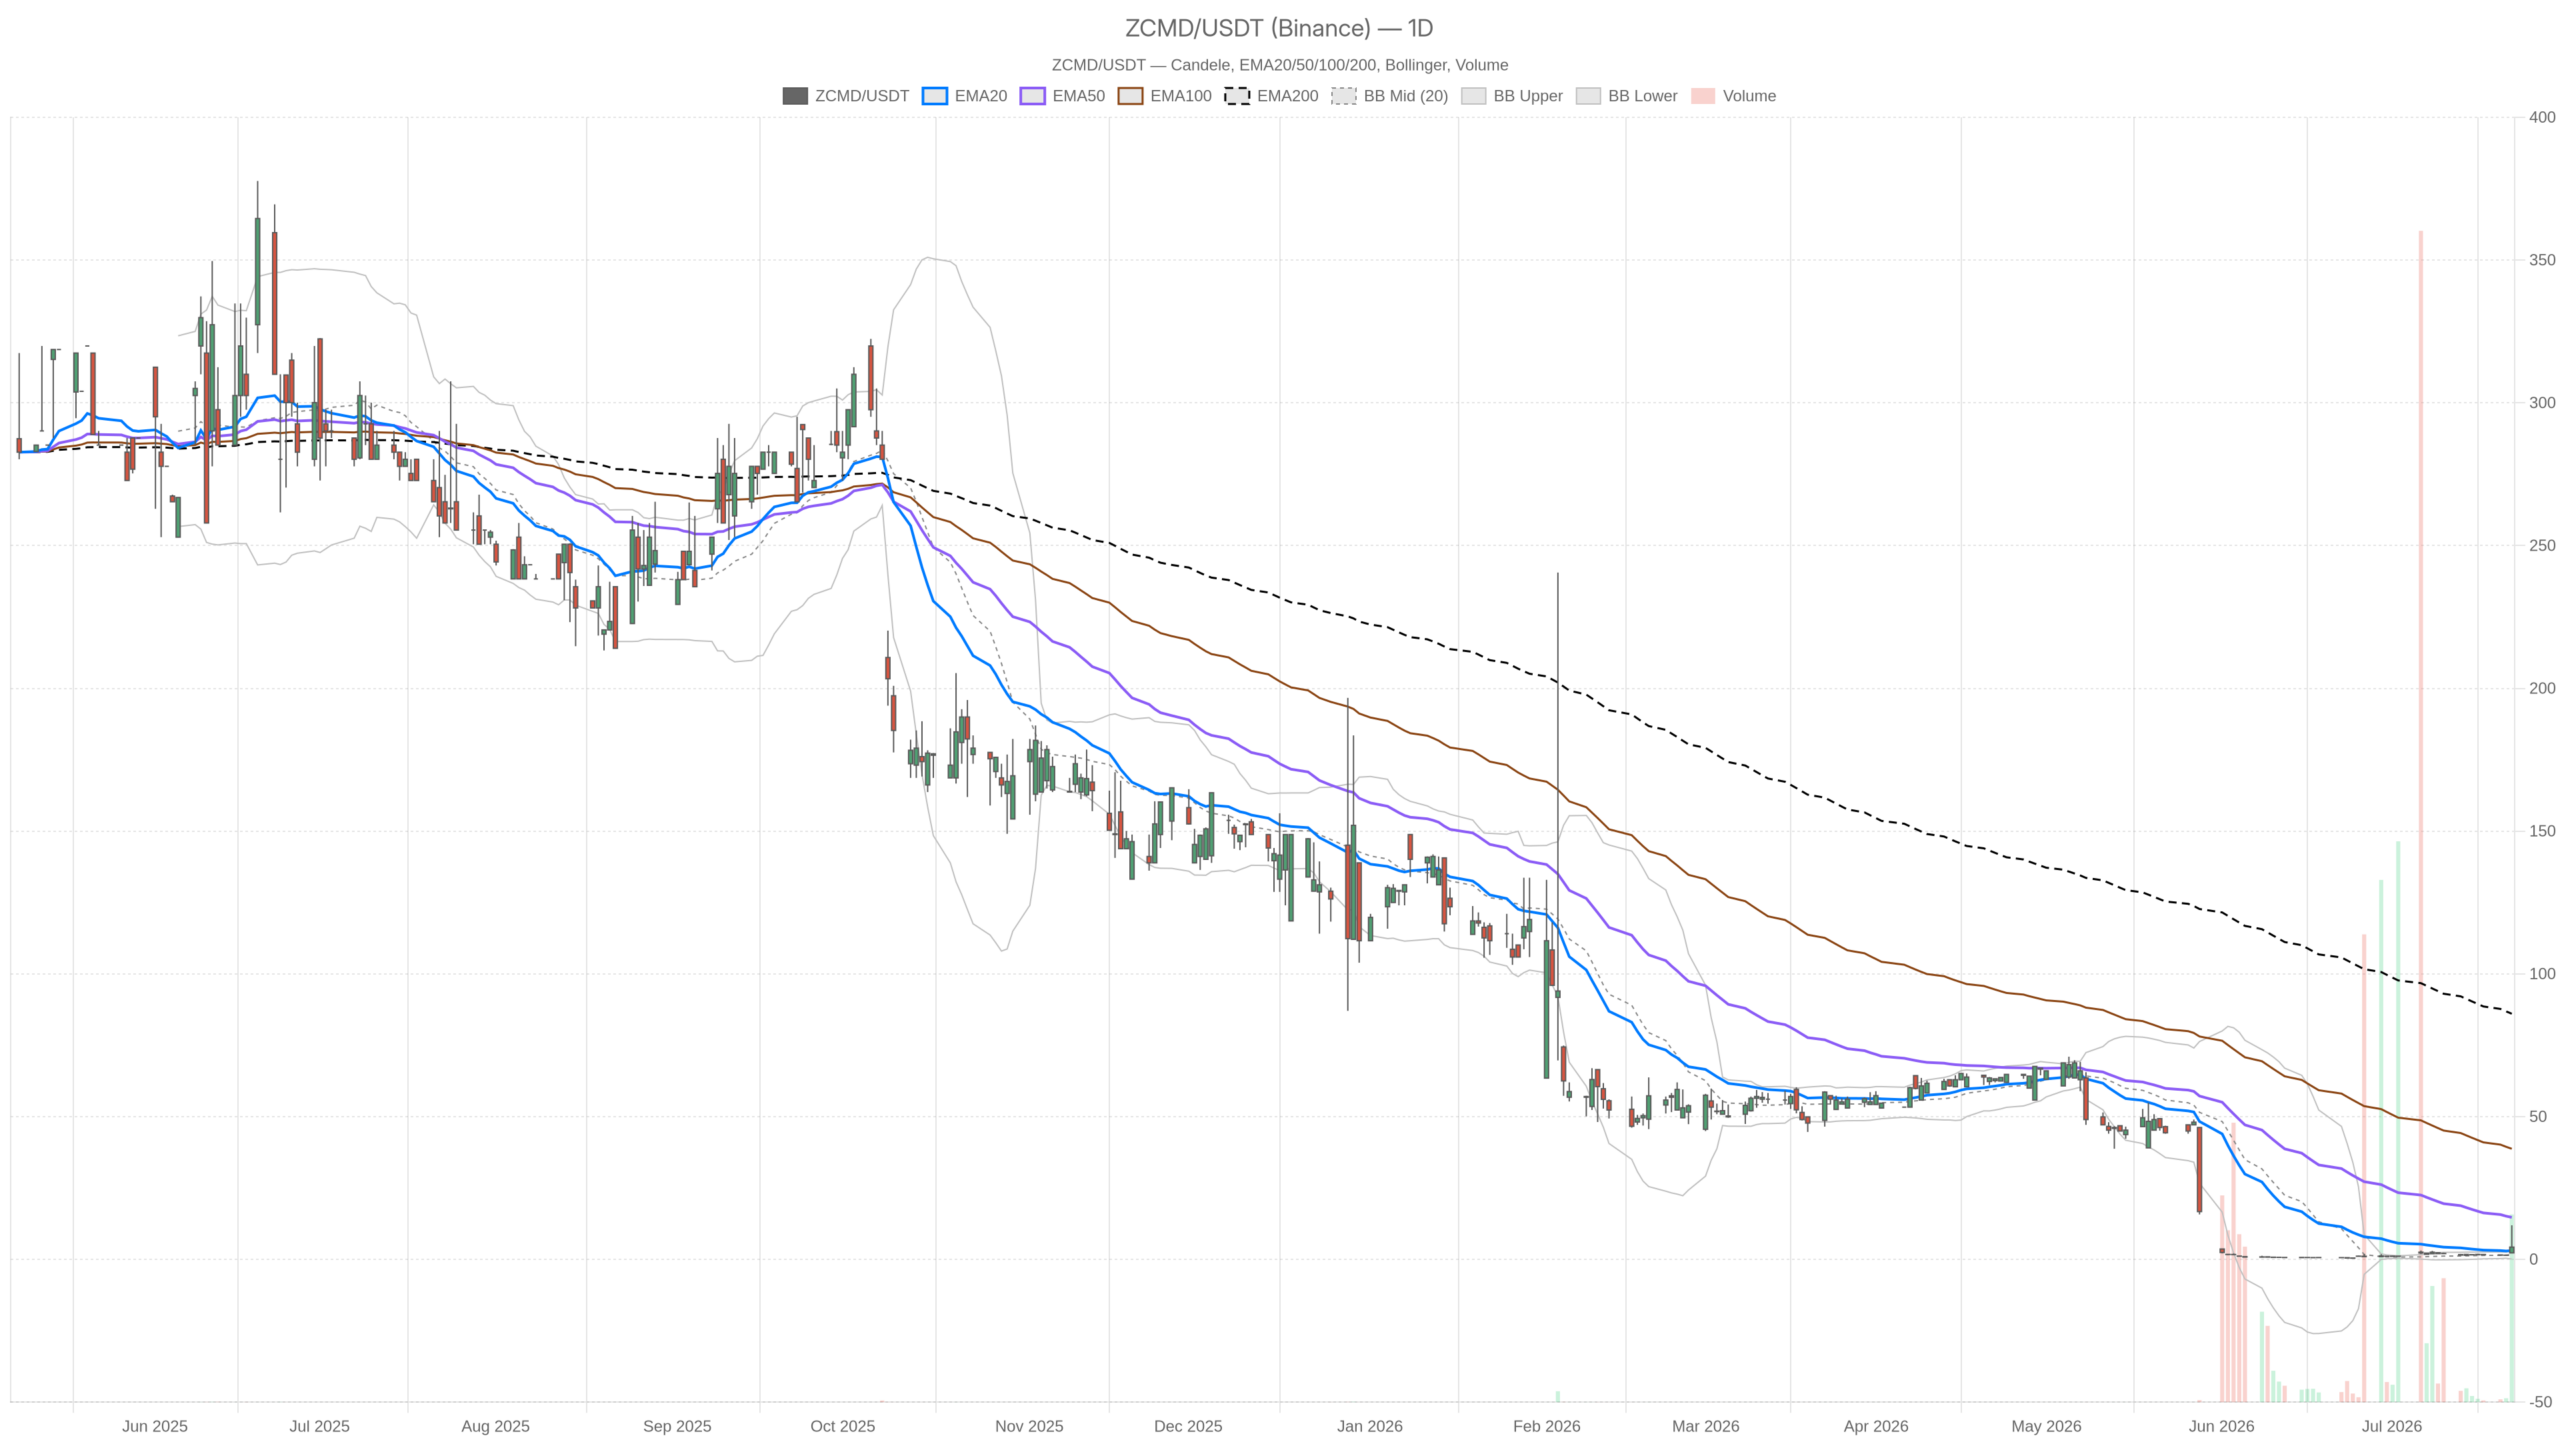
- The daily structure remains deeply bearish, with EMA50 at $14.71 and EMA200 at $86.03 acting as heavy overhead resistance layers.
- Daily MACD histogram turned positive at +1.34, signaling decelerating bearish momentum — not a confirmed buy signal.
- The 1H chart shows mild bullish confirmation with price above EMA20 ($3.73) and EMA50 ($2.72), though the hourly pivot at $4.38 remains untested.
- The 15-minute frame reveals late-session fading, with price closing below the EMA20 at $4.92 and the MACD histogram printing -0.36.
Daily Structure: A Broken Trend With Faint Stabilization Signals
The daily chart of Zhongchao Inc. stock remains structurally bearish despite the July 22 spike. Price closed at $4.30 — above the EMA20 at $3.06 but massively below the EMA50 at $14.71 and EMA200 at $86.03. These are not minor technical overhangs. They represent months of sustained selling pressure, and the gap between current price and those longer averages signals a stock that has lost the overwhelming majority of its trend value.
The daily regime is flagged as neutral. Price is neither making sustained new lows nor reclaiming meaningful structure. However, neutral here does not mean safe. The Bollinger Band midline sits at $1.67, with the upper band at $3.23. The close at $4.30 punches above the upper band. Normally this signals strong momentum. In this context, it reflects the distortion of an extreme intraday spike rather than an organic breakout.
Volatility and Pivot Context
The daily ATR of $1.23 confirms significant baseline volatility relative to price. A single average daily move covers roughly 29% of the closing price. That alone demands respect for position sizing. Meanwhile, the daily pivot point sits at $6.12, with resistance at $10.11 and support at $0.31. The close at $4.30 is trapped beneath the pivot. This represents a technically bearish positioning within the session’s reference framework.
Momentum Indicators Show Divergence
Daily RSI at 45.89 sits in neutral territory below the 50 midline. This suggests momentum has not shifted decisively to the bulls. The daily MACD, however, tells a more constructive short-term story. The line reads -2.63 against a signal of -3.97, producing a histogram of +1.34. That positive histogram means bearish momentum is decelerating. It is not a buy signal — it is a slowdown in selling pressure. For a stock this distressed, that distinction matters.
1H Chart: Short-Term Momentum Turns Constructive
The hourly chart of Zhongchao Inc. stock displays a notably different tone from the daily. The 1H close at $4.30 sits above both the EMA20 at $3.73 and the EMA50 at $2.72. This stacking of price above short-term averages is a mild bullish signal on the intraday frame. However, the EMA200 on the hourly at $12.05 acts as a significant ceiling. Any sustained recovery attempt would need to contend with that level.
Hourly RSI prints at 53.65 — just above the neutral midpoint. This indicates modest bullish momentum without being overbought. The hourly MACD is in positive territory. The line at 0.98 sits above the signal at 0.83, reinforcing the near-term upward tilt. The histogram at +0.15 is thin but positive. Taken together, the 1H picture provides mild confirmation of the daily bounce — not a strong rally signal, but not deterioration either.
Volatility Inversion and Pivot Resistance
The 1H ATR of 1.90 is notably higher than the daily ATR of 1.23. That inversion reflects the concentrated burst of volatility during the session. The 1H pivot stands at $4.38, with resistance at $4.87 and support at $3.82. Price closed at $4.30 — just below the hourly pivot. That subtle detail keeps the short-term structure in a borderline, unconfirmed state rather than a clean bullish one.
15-Minute Context: Fading Into the Close
The 15-minute chart of Zhongchao Inc. stock captures the final intraday texture and adds an important nuance. Price opened the last candle at $4.78, hit a high of $4.95, then pulled back to close at $4.30. The EMA20 on the 15m timeframe sits at $4.92 — above the close. This means price is fading beneath its fastest short-term average at the end of the session.
The MACD histogram on 15m reads -0.36, confirming micro-momentum points downward into the close. This is the signature of a late-session pullback, not a clean hold of gains. On the other hand, the 15m RSI at 47.07 remains near neutral. The EMA50 at $4.09 provides near-term support beneath current price.
The 15m pivot structure shows support at $4.03 and resistance at $4.77. The close at $4.30 sits within that range. In short, the 15-minute frame does not signal collapse. It signals consolidation after a spike, with a mild downside lean into the session end.
Bullish Scenario: What Zhongchao Inc. Stock Needs to Sustain a Recovery
A genuine bullish case for Zhongchao Inc. stock requires more than a single high-volume spike. For the bounce to become sustainable, price would need to reclaim and hold above the daily pivot at $6.12. A daily close above that level would shift the session structure from bearish to neutral with bullish potential. The first hourly resistance at $4.87 is the immediate checkpoint. A retest of $6.12 only becomes relevant once that level is cleared.
Additionally, the daily MACD histogram continuing to expand positively would confirm the transition. It would signal that decelerating selling pressure is turning into real buying interest. Volume on July 22 reached 5,842,915 shares — elevated, but concentrated in a single spike. Sustained volume above that average on subsequent up-days would materially strengthen the bull case.
Bearish Scenario: Why the Path of Least Resistance Still Points Lower
In contrast, the bearish scenario remains the default for Zhongchao Inc. stock given the structural damage at the daily level. A return below the EMA20 at $3.06 would invalidate the current short-term recovery. It would re-expose the lower Bollinger Band region near $0.10. The daily support pivot at $0.31 illustrates just how much downside the technical framework still allows.
If the daily MACD histogram turns negative again, that would be a meaningful warning. It would signal that the bounce has failed and bearish momentum is reasserting itself. Furthermore, the overwhelming weight of EMA50 at $14.71 and EMA200 at $86.03 creates compounding resistance. Any rally faces technical headwinds at each layer above current price.
Positioning and Volatility: A Market Requiring Discipline
Overall, Zhongchao Inc. stock sits in a complex and unresolved technical state. The daily structure is broken on a longer-term basis. Yet the immediate session produced a violent upside move that has introduced short-term ambiguity. The 1H frame mildly confirms the bounce, while the 15m frame shows late-session fading. These signals do not align cleanly, and that conflict demands caution.
With an ATR near $1.23 on the daily and $1.90 on the hourly, the volatility environment is extreme relative to price. Any directional bias must account for the possibility of equally sharp reversals in either direction. This is not a market for oversized positions or loose stops. Discipline in execution and clarity of thesis are the only real edges available.
FAQ
What happened to Zhongchao Inc. stock on July 22?
Zhongchao Inc. stock experienced an extreme intraday surge, hitting a high of $11.93 before closing at $4.30. The daily open was just $2.27, producing a range of nearly 460% from low to high within a single session — a clear volatility event rather than a normal trending day.
Is Zhongchao Inc. stock in a bullish or bearish trend?
The daily structure remains deeply bearish. Despite the short-term bounce, price sits far below the EMA50 at $14.71 and the EMA200 at $86.03. The daily MACD histogram has turned positive at +1.34, but this signals decelerating selling pressure rather than a confirmed bullish reversal.
What are the key resistance levels for ZCMD stock?
The first hourly resistance sits at $4.87, followed by the daily pivot at $6.12 and resistance at $10.11. Longer-term, the EMA50 at $14.71 and EMA200 at $86.03 represent significant overhead barriers that would challenge any sustained recovery attempt.
What support levels should traders watch?
Immediate support sits at the EMA20 on the daily chart at $3.06. Below that, the 15m support at $4.03 and hourly support at $3.82 provide near-term floors. The daily support pivot stands at $0.31, illustrating the substantial downside the technical framework still permits.
Disclaimer: This article is for informational purposes only and does not constitute financial advice, an investment recommendation, or a solicitation to buy or sell any financial instrument or cryptocurrency. The analysis provided is not indicative of future results. Investing in crypto assets and financial markets carries a high risk of capital loss. Always do your own research (DYOR) and consult a qualified financial advisor before making any decision.
Article produced with the assistance of artificial intelligence and reviewed by the editorial team.
