




Tesla, Inc. stock closed at $374.01 on July 22nd despite a Q2 revenue beat. Price sits below all key moving averages. The daily chart shows a clear bearish bias. The earnings catalyst briefly captured attention, but the technical structure tells a more cautious story.
Summary
Key takeaways
- Tesla, Inc. stock closed at $374.01 on July 22nd, well below the EMA20 ($392.34), EMA50 ($398.42), and EMA200 ($397.93)
- Daily RSI at 41.7 and MACD histogram at -2.88 confirm sustained bearish momentum
- The $392–$398 zone — where all three major EMAs converge — is the critical resistance level to reclaim
- Tesla reported a Q2 revenue beat, but at least one analyst downgraded the stock citing an earnings miss and valuation concerns
- Tesla held its $674 million Bitcoin position through Q2 despite paper losses for the third consecutive quarter
Tesla, Inc. Stock Daily Structure: A Market Stuck Below Its Own Averages
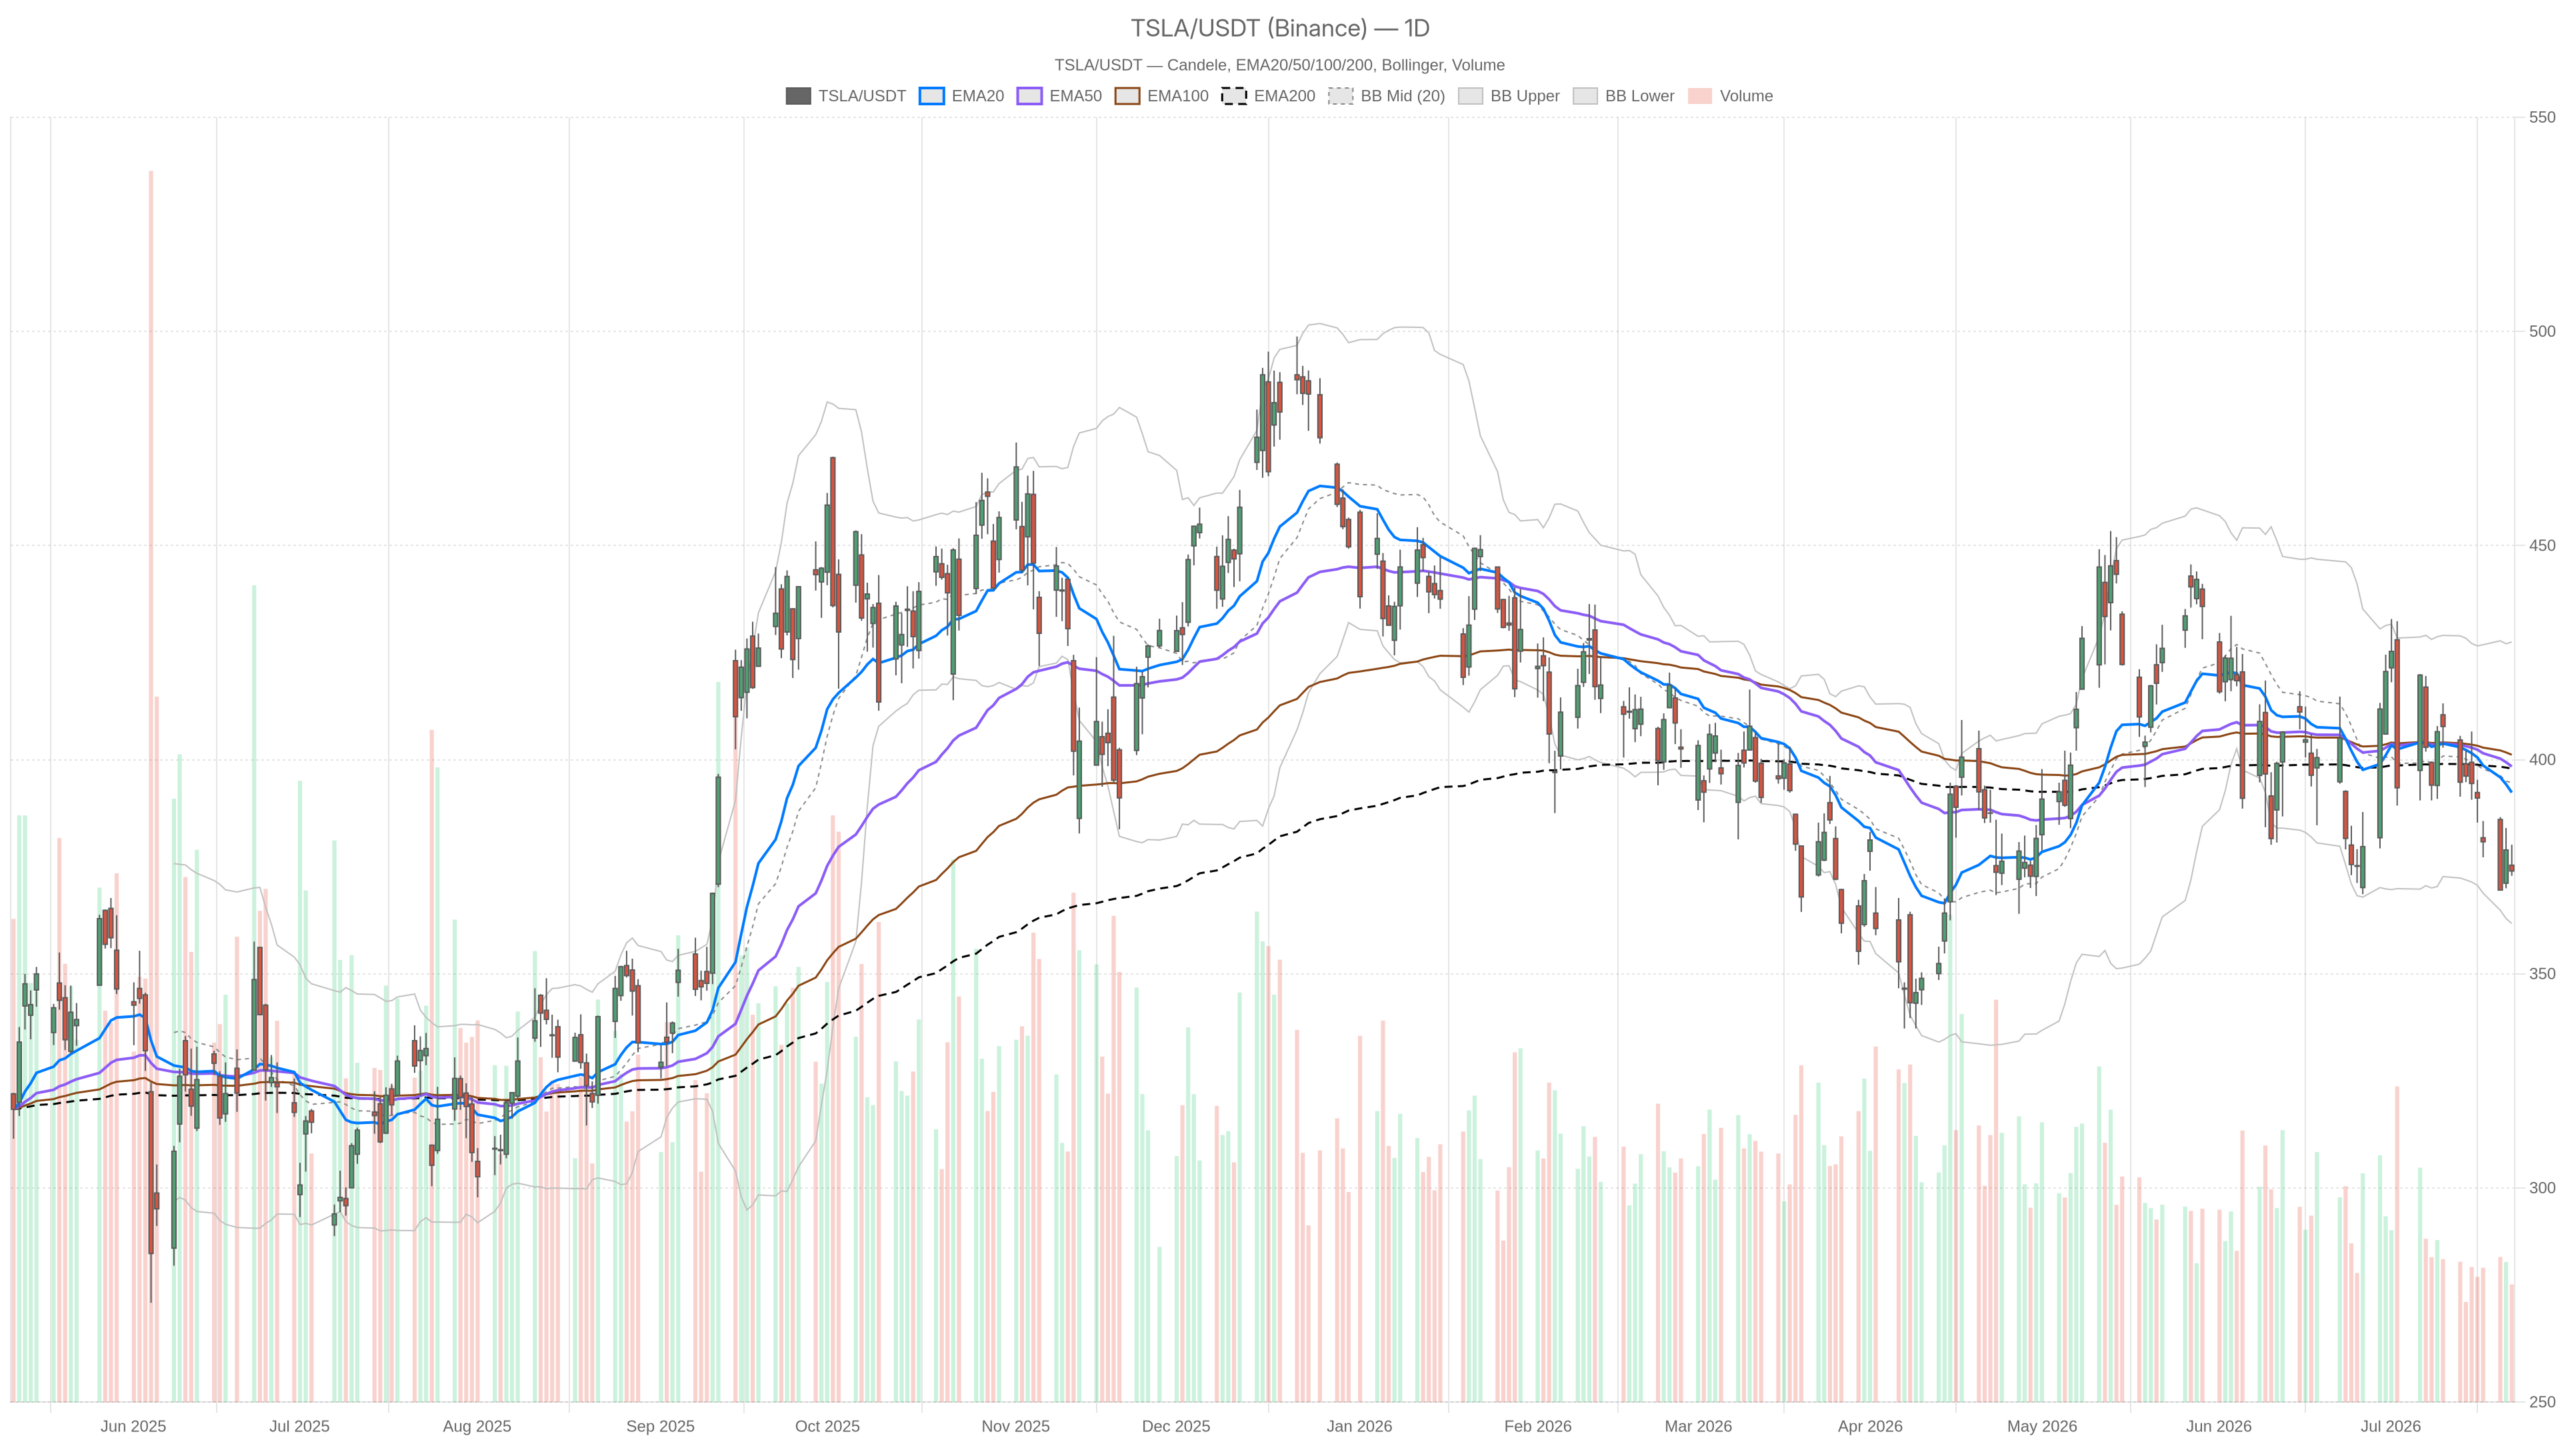
Tesla, Inc. stock’s daily chart reveals a market trapped below its own equilibrium. Price sits beneath all three major moving averages with no serious challenge to overhead resistance.
TSLA closed at $374.01 on July 22nd, with the session ranging between $372.90 and $380.17. That entire range sits below the EMA20 at $392.34, the EMA50 at $398.42, and the EMA200 at $397.93. All three moving averages are clustered tightly near the $397–$398 zone. This dense overhead resistance has yet to be seriously challenged.
The EMA Cluster Forms a Dense Resistance Zone
The Bollinger Band midline sits at $394.62, equally out of reach. Meanwhile, price is pressing closer to the lower band at $361.75. This suggests the market is not simply consolidating. It is drifting toward the weaker half of the distribution.
The configuration signals a stock trending below its own medium and long-term equilibrium. The daily ATR sits at $16.62. Volatility is present but not abnormal for Tesla, Inc. stock. However, the pivot structure adds a mild bearish lean. The session pivot was $375.69, with resistance at R1 of $378.49 and support at S1 of $371.22. The close just below the pivot level reinforces the downside tilt.
RSI and MACD Deepen the Bearish Case
The daily RSI at 41.7 reinforces this view. It is not oversold, but it is firmly in bearish territory. The indicator sits below the 50 neutral threshold and shows no meaningful recovery attempt. Meanwhile, the MACD paints an even starker picture. The line reads -6.97 against a signal of -4.09, generating a histogram of -2.88. The divergence between the MACD line and signal is widening, not narrowing. That is not a momentum setup looking to reverse anytime soon.
Overall, the daily regime is tagged as neutral. Nevertheless, the weight of evidence tilts decisively toward the downside for Tesla, Inc. stock.
Hourly Timeframe: Bearish Confirmation, With a Hint of Stabilization
The hourly chart labels Tesla, Inc. stock’s regime explicitly as bearish. Price sits beneath every major EMA, with all three trending lower.
EMA Stacking Confirms the Downtrend
Price on the hourly was closing at $374.05. It sits beneath the EMA20 at $378.03, the EMA50 at $383.93, and the EMA200 at $396.05. That full stacking of EMAs above price, all trending lower, is a textbook short-term downtrend in progress. The hourly RSI at 38.1 keeps the momentum picture weak.
MACD Histogram Hints at Slowing Selling Pressure
However, there is one nuance worth noting. The hourly MACD histogram is marginally positive at +0.24. The MACD line remains in negative territory at -2.45 versus a signal of -2.69. This small histogram uptick could indicate very early momentum deceleration. It is not a reversal, but a slight easing of selling pressure. In the context of a broader downtrend, this is not a buy signal. It is simply a potential pause.
Bollinger Bands on the 1H frame show the midline at $376.52 and the lower band at $369.45. Price hugging the lower half of this range confirms bears remain in control at the intraday level. The pivot structure shows PP at $374.06, R1 at $375.22, and S1 at $372.89. TSLA is oscillating in a very tight band with limited room before testing short-term support.
15-Minute Context: TSLA Approaches Short-Term Oversold Territory
The 15-minute chart shows Tesla, Inc. stock approaching oversold conditions, with RSI at 33.45. This proximity could allow for a minor technical bounce.
RSI on this timeframe dropped to 33.45, approaching oversold conditions. The MACD histogram is slightly negative at -0.23, but the rate of decline appears to be moderating. Bollinger Bands on the 15m show a lower bound of $373.65, with price near $374.05. Tesla, Inc. stock is hovering just above that near-term floor.
However, any recovery attempt faces immediate resistance at the 15m EMA20 of $376.07 and EMA50 of $377.28. Neither of those levels looks easily conquered given the weight of pressure from above. This timeframe is useful only for timing entries or exits. It does not change the broader directional thesis.
The Earnings Narrative: Revenue Beat, But Market Hesitates
Tesla’s Q2 2026 revenue beat failed to lift Tesla, Inc. stock out of its bearish technical structure. The market’s hesitation reflects genuine uncertainty about near-term direction.
Tesla’s Q2 2026 earnings landed squarely in the spotlight on July 22nd. The company reported revenue that beat analysts’ expectations, with strong auto sales cited as a key driver. High gas prices provided an additional tailwind. The earnings call featured Elon Musk and was hosted by Head of Investor Relations Travis Axelrod.
Yet despite the top-line beat, at least one Seeking Alpha analyst issued a rating downgrade. The analyst cited an earnings miss on the bottom line and valuation premium concerns. At the same time, another Seeking Alpha piece framed the Q2 report as potentially securing Tesla’s return as a Magnificent Seven leader. This divergence in analyst sentiment reflects the genuine uncertainty surrounding Tesla, Inc. stock.
On the crypto front, Tesla held its Bitcoin position through Q2. The company recorded paper losses for the third consecutive quarter. As of March 31st, Tesla held $674 million in digital assets. The company chose not to liquidate this holding despite ongoing BTC weakness. That decision may reassure some investors about management’s long-term conviction. Still, it adds a non-core risk factor to the balance sheet narrative.
Bullish Scenario: What Would Change the Picture for Tesla, Inc. Stock
For Tesla, Inc. stock to turn bullish, price must reclaim the $392–$398 zone where all three major EMAs converge. A sustained move above this area would be the clearest signal that sellers have lost control.
A sustained reclaim of the $392–$398 zone would require a move of roughly 5–6% from current levels. That is not trivial given the current momentum backdrop. On the fundamental side, follow-through buying from the earnings beat could provide fuel. This would be strengthened by positive analyst revisions or delivery guidance upgrades. A daily RSI recovery back above 50 would confirm that momentum is shifting. Until those conditions materialize, any bounce is best treated as a relief rally within a downtrend.
Bearish Scenario: The Downside Case Remains Active
The bearish case for Tesla, Inc. stock targets the lower Bollinger Band at $361.75 if price breaks below the S1 daily pivot at $371.22.
If TSLA breaks below $371.22 and fails to recover the $374–$375 area, the outlook darkens. Pressure toward the lower Bollinger Band at $361.75 becomes the more probable path. The daily MACD is still diverging negatively, with no sign of a crossover. RSI at 41.7 has room to move further south before reaching oversold levels. This means there is no technical floor forcing a bounce in the immediate term.
The bearish case is invalidated if price reclaims and holds the Bollinger midline at $394.62 on a daily closing basis. Below that level, the technical structure remains tilted against the bulls.
Positioning in an Uncertain Environment
Tesla, Inc. stock faces conflicting signals: a genuine fundamental catalyst versus a bearish technical structure. The directional edge belongs to the bears until proven otherwise.
Tesla, Inc. stock is navigating a difficult moment. A genuine fundamental catalyst — the Q2 revenue beat — is competing against a technical structure that remains firmly on the back foot. The daily regime may be classified as neutral. Yet, every major indicator beneath the surface points to sustained selling pressure. The hourly chart confirms the bias. The 15-minute frame suggests temporary exhaustion, but not reversal.
Volatility, as measured by the daily ATR of $16.62, is meaningful enough to produce sharp intraday swings. However, the directional edge belongs to the bears until proven otherwise. Traders and investors monitoring TSLA should treat the $392–$398 zone as the line in the sand. Below it, the path of least resistance remains lower. This is not financial advice. It is the market structure speaking for itself.
FAQ
What is the key resistance level for Tesla, Inc. stock?
The $392–$398 zone, where the EMA20, EMA50, and EMA200 all converge, is the critical resistance Tesla, Inc. stock must reclaim to shift bullish. A sustained close above this area would signal that sellers have lost control.
What is the bearish downside target for Tesla, Inc. stock?
If Tesla, Inc. stock breaks below the S1 daily pivot at $371.22 and fails to recover the $374–$375 area, the lower Bollinger Band at $361.75 becomes the more probable downside target.
Did Tesla’s Q2 2026 earnings beat expectations?
Tesla reported a Q2 2026 revenue beat driven by strong auto sales and aided by high gas prices. However, at least one Seeking Alpha analyst downgraded the stock, citing an earnings miss on the bottom line and valuation concerns.
What does the daily RSI indicate for Tesla, Inc. stock?
The daily RSI at 41.7 is firmly in bearish territory below the 50 neutral threshold. It shows no meaningful recovery attempt and has room to fall further before reaching oversold levels, meaning no technical floor is forcing a bounce in the near term.
Disclaimer: This article is for informational purposes only and does not constitute financial advice, an investment recommendation, or a solicitation to buy or sell any financial instrument or cryptocurrency. The analysis provided is not indicative of future results. Investing in crypto assets and financial markets carries a high risk of capital loss. Always do your own research (DYOR) and consult a qualified financial advisor before making any decision.
Article produced with the assistance of artificial intelligence and reviewed by the editorial team.
