




Nokia Corporation Sponsored stock enters its July 23 Q2 earnings at $10.28 — below key moving averages, with deeply negative daily momentum. AI networking optimism keeps retail sentiment alive. The tension between a deteriorating chart and a fundamental catalyst defines the setup.
Summary
Key takeaways
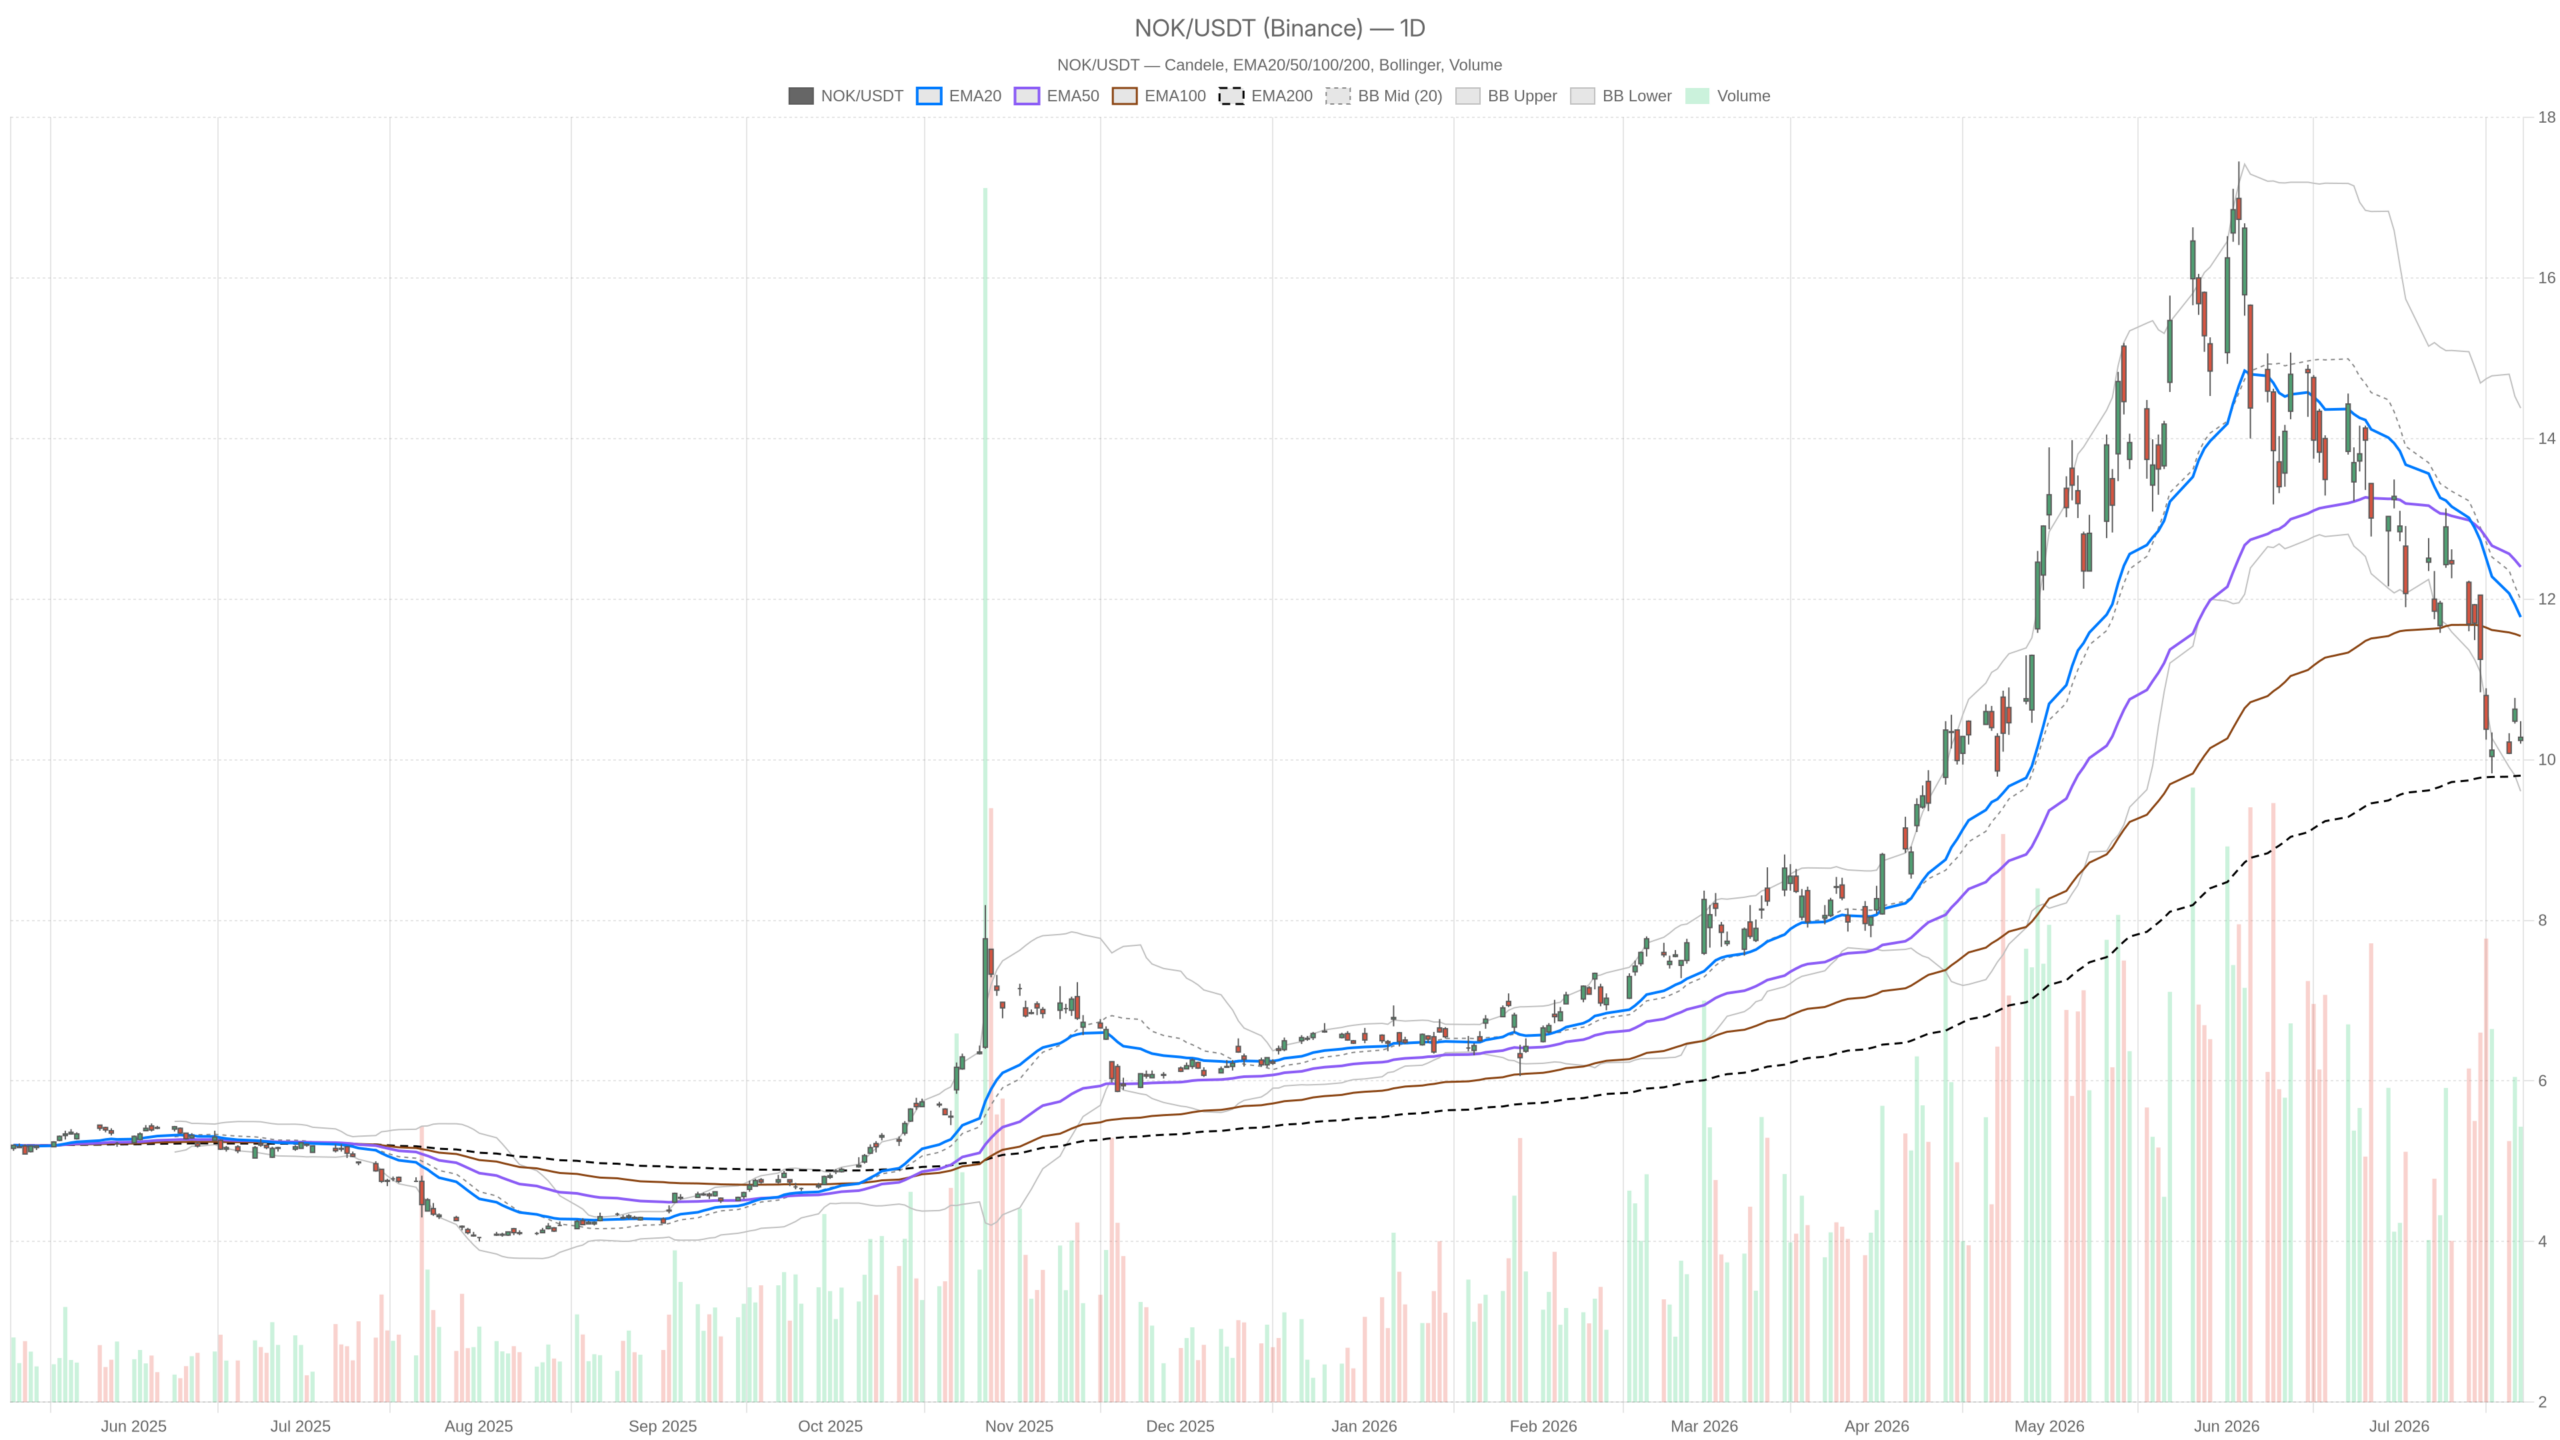
- NOK trades at $10.28, well below the EMA20 at $11.78 and EMA50 at $12.40
- Daily RSI at 34.83 signals deep oversold conditions without a confirmed reversal
- Daily MACD remains negative with no crossover in sight
- EMA200 at $9.80 provides a long-term structural floor
- July 23 earnings represent a binary catalyst with compressed pre-event volatility
Daily Bias: Nokia Corporation Sponsored Stock Shows Bearish Structure
The daily timeframe for Nokia Corporation Sponsored stock is clearly bearish. Price at $10.28 sits far below short- and medium-term moving averages. Only the long-term EMA200 at $9.80 offers structural support beneath current levels.
Trend Structure and Moving Averages
Price is trading significantly below the EMA20 at $11.78 and the EMA50 at $12.40. This distance reflects sustained selling pressure, not a brief correction. The EMA200 at $9.80 provides the only constructive signal from the daily view — a long-term floor that has not yet been tested.
Momentum and Volatility Signals
Daily RSI at 34.83 places NOK deep in oversold territory, though still above the 30 threshold. This signals exhaustion in the selling wave, but not yet a confirmed reversal.
Meanwhile, the daily MACD paints a more troubling picture. The MACD line stands at -0.91 versus a signal of -0.73, with the histogram at -0.18. Critically, the line remains below signal, and the histogram’s negative reading confirms bearish momentum has not yet peaked. No divergence or crossover suggests a near-term trend reversal.
In addition, Bollinger Bands add important context. The midline sits at $11.99, far above current price. The lower band at $9.61 is being approached from above. Price moving toward the lower band, combined with the oversold RSI, typically flags a stretched move — but that alone is not a reversal signal. The daily ATR of $0.72 indicates meaningful intraday range, consistent with a stock approaching a volatility event. The daily pivot point is $10.32, with resistance at $10.44 and support at $10.16.
Hourly Structure Reinforces the Bearish Lean
The 1H timeframe does not offer relief from the daily bearish bias — it reinforces it. Price closed the last hourly candle at $10.30, below all key moving averages on this timeframe. However, one small sign of short-term stabilization has emerged.
Price sits below the 1H EMA20 at $10.44 and well below the EMA50 at $10.76. The EMA200 on this timeframe at $12.26 aligns with the daily picture — all trend averages are stacked bearishly against price.
Notably, the 1H MACD provides a minor stabilization signal. The MACD line sits at -0.06, with the signal at -0.07 and the histogram turning marginally positive at +0.01. This barely flickering development suggests the intraday selling impulse may be losing force. The 1H RSI at 41 is subdued, not oversold, and gives no clear directional signal.
The 1H Bollinger midline at $10.42 sits just above price. The lower band at $9.98 acts as the next area of vulnerability if support breaks. On the 1H pivot structure, resistance is clustered tightly at $10.38 — essentially matching the 15-minute resistance. That compression signals a narrow trading range, typical ahead of a binary event.
15-Minute Context: Pre-Earnings Compression
The 15-minute chart confirms pre-earnings compression. Price closed at $10.30, essentially flat, with all three EMA averages closely stacked — a sign of low intraday momentum rather than directional conviction.
The EMA20 at $10.39, EMA50 at $10.42, and EMA200 at $10.76 sit tightly together. Meanwhile, the 15m RSI at 39.3 mirrors the hourly in weakness without reaching an extreme. Notably, the MACD histogram is flat at zero — neither bulls nor bears control this granular timeframe.
The 15m ATR of just $0.06 reinforces the compression picture. Volatility on this timeframe has essentially dried up. Range tightening before a major catalyst typically precedes a sharp expansion — but direction depends entirely on the earnings outcome.
Earnings Catalyst and Market Sentiment
Still, the fundamental backdrop adds complexity to an otherwise bearish technical picture. Nokia Corporation Sponsored stock reports Q2 earnings on July 23, and retail sentiment ahead of the release has been described as optimistic. Some market participants have called Nokia a pillar of infrastructure supported by AI networking initiatives.
Meanwhile, the stock reportedly rose overnight ahead of the earnings release, suggesting pre-positioning by bulls. At the same time, key watchpoints remain — specifically competition and telecom spending trends. Nokia enters this report with meaningful technical headwinds. Therefore, a beat alone may not reverse the dominant daily trend unless accompanied by forward guidance that materially shifts expectations. Broader U.S. equity futures were edging higher around the same period.
Bullish Scenario: What Would Support a Recovery
A constructive earnings outcome could shift the bearish bias. But it would need strong revenue, better-than-expected AI networking traction, and confident forward guidance. From a technical standpoint, the bullish case requires NOK to first reclaim the daily pivot at $10.32 and then push through the $10.44 resistance level.
Beyond that, a sustained move back toward the EMA20 at $11.78 would represent meaningful structural improvement. The oversold daily RSI at 34.83 provides room for a recovery without immediately hitting overbought resistance. In addition, the EMA200 on the daily at $9.80 provides a cushion below — limiting the theoretical downside floor in a worst-case selloff.
Bearish Scenario: What Would Invalidate the Bulls
On the other hand, a disappointing earnings report — or even in-line results that fail to impress — would likely accelerate the existing downtrend. The distance between current price and all major moving averages on both daily and hourly frames is already large. A failure to reclaim $10.32 on the daily pivot would leave daily support at $10.16 as the next test.
Below that, the daily lower Bollinger Band at $9.61 and the EMA200 at $9.80 represent the last meaningful technical defense. Any sustained break below those levels would signal deeper structural deterioration in Nokia Corporation Sponsored stock.
The daily MACD remains in negative territory with no crossover in sight. Therefore, any post-earnings pop that fails to generate follow-through buying would likely see momentum sellers return quickly.
Positioning Into a Volatile Catalyst
Overall, the technical picture for NOK heading into earnings is bearish on both daily and hourly timeframes. Only minor short-term stabilization signals are visible on the 1H MACD histogram. The 15m chart reflects pre-earnings compression, and the daily ATR of $0.72 confirms the stock is capable of meaningful moves once the catalyst lands.
In this environment, uncertainty is the dominant factor. The July 23 earnings release is effectively a binary event for Nokia Corporation Sponsored stock. The technical setup defines the path of least resistance as downward, but a strong catalyst could temporarily override that structure. Positioning in either direction carries elevated risk. Patience for confirmation after the release remains the analytically sound approach.
FAQ
When does Nokia report its Q2 earnings?
Nokia Corporation reports its Q2 earnings on July 23.
What are the key support levels for NOK?
The daily support sits at $10.16, with the lower Bollinger Band at $9.61 and the EMA200 at $9.80 acting as the last meaningful technical defenses.
What would confirm a bullish reversal?
NOK would need to reclaim the daily pivot at $10.32, push through $10.44 resistance, and then mount a sustained move toward the EMA20 at $11.78.
Is Nokia Corporation Sponsored stock oversold?
Daily RSI at 34.83 places NOK in oversold territory, though still above the 30 extreme threshold. This signals selling exhaustion but not yet a confirmed reversal.
Disclaimer: This article is for informational purposes only and does not constitute financial advice, an investment recommendation, or a solicitation to buy or sell any financial instrument or cryptocurrency. The analysis provided is not indicative of future results. Investing in crypto assets and financial markets carries a high risk of capital loss. Always do your own research (DYOR) and consult a qualified financial advisor before making any decision.
Article produced with the assistance of artificial intelligence and reviewed by the editorial team.
