




IREN stock surged to $48.27 in one of its strongest sessions in months, riding a 6% rally fueled by Microsoft delivery news and an updated Nvidia status. The move lands squarely inside a broader wave of enthusiasm sweeping AI infrastructure names. The question: is this a durable structural shift or just an overbought spike that needs to cool first?
Summary
Key takeaways
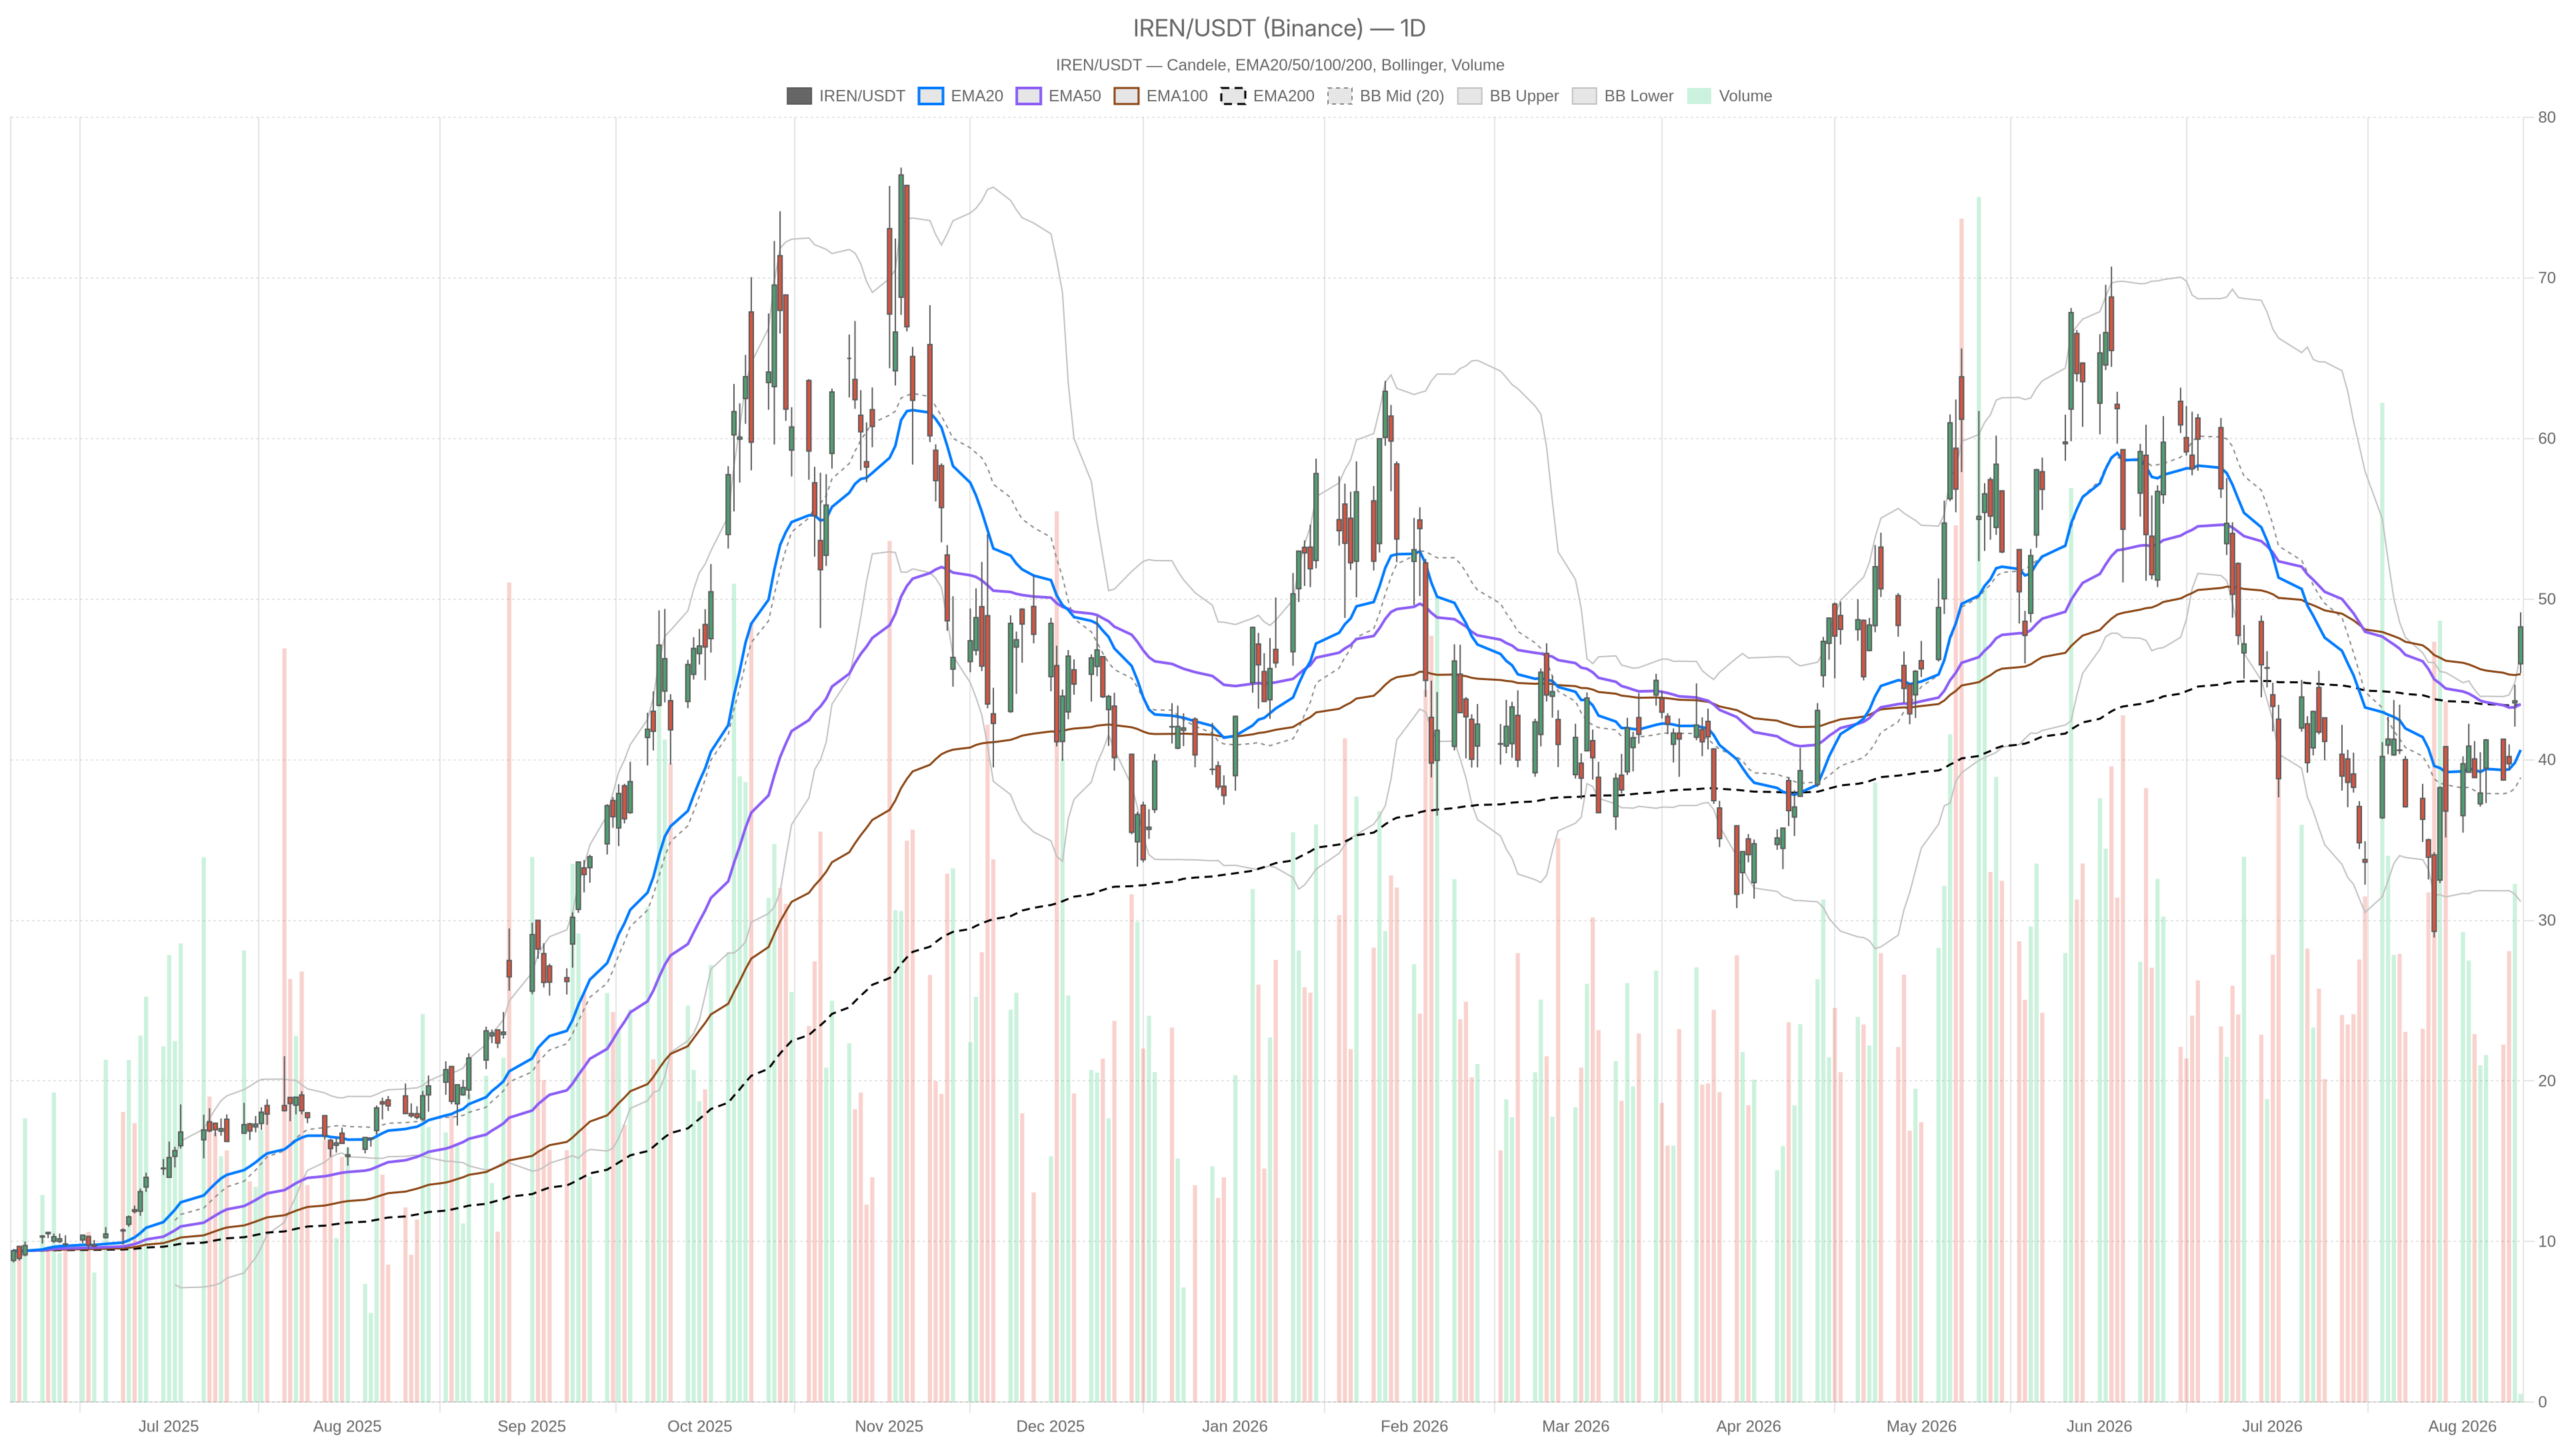
- IREN stock closed at $48.27, breaking above the daily upper Bollinger Band at 46.6 — a genuine breakout signal.
- Daily RSI14 sits at 60.18, comfortably bullish and not yet stretched, leaving room for further upside.
- Hourly RSI14 has reached 79.01, deep into overbought territory, raising near-term pullback risk.
- The next critical resistance test lies at $49.84; support sits at the daily pivot of $47.61.
- ATR14 stands at 4.29, underlining elevated volatility and the potential for sharp swings in either direction.
Daily chart signals a structural shift in IREN stock
The daily chart shows IREN stock trading well above all three major moving averages. EMA20 sits at 40.61, EMA50 at 43.46, and EMA200 at 43.43. The 50-day and 200-day averages are nearly overlapping, which typically reflects a long basing phase. Price has now broken decisively above both, closing near $48.27, suggesting that consolidation phase may be ending in favor of buyers.
RSI14 reads 60.18 — comfortably bullish but not yet stretched. This leaves room for further upside before the daily chart would flag exhaustion. Meanwhile, the MACD tells a more nuanced story: the line remains negative at -0.16, below the signal at -1.65. However, the histogram has swung sharply positive to 1.49. Momentum is turning up fast, even though the broader MACD structure hasn’t fully flipped. It is an early-stage signal, not a confirmed trend reversal.
The Bollinger Band setup offers perhaps the most striking detail. With the upper band at 46.6, price closed above it at 48.27. A close outside the upper band on the daily chart is a genuine breakout signal. Still, it also raises the odds of a near-term mean-reversion pullback toward the band. ATR14 stands at 4.29, underlining just how volatile this stock has become. In terms of pivot structure, the pivot point sits at 47.61 and resistance at 49.84, with support at 46.05. IREN stock currently trades between the pivot and R1, placing the next real test at that 49.84 level.
Hourly momentum confirms the move, but overbought signals emerge
The 1-hour chart reinforces the bullish daily picture. EMA20 at 42.15 sits above EMA50 at 40.53 and EMA200 at 40.95 — a clean bullish stack. The MACD line is firmly positive at 1.51, above its signal at 0.88, with a histogram of 0.62. This presents a more mature bullish signal than the daily MACD, confirming momentum has genuinely shifted on the intraday horizon.
However, RSI14 on the hourly chart has reached 79.01, deep into overbought territory. At the same time, price closes above the hourly upper Bollinger Band of 46.07. This echoes the stretched condition visible on the daily chart. Here lies the timeframe conflict: the daily trend is bullish but still emerging, while hourly momentum is already overheated. That combination often precedes a short-term cooling period, even within a broader uptrend.
15-minute chart: execution context for IREN stock
Zooming into the 15-minute chart, the regime is explicitly tagged bullish. The EMA stack of 44.53, 42.76, and 40.12 confirms the same trend seen on higher timeframes. RSI14 at 78.12 remains overbought, consistent with the hourly reading. The MACD histogram has narrowed slightly to 0.45 from the hourly’s 0.62, hinting that the very short-term push is losing a bit of steam.
Price action on this timeframe shows a pullback from the session high of 49.18 down to the close at 48.27. The 15-minute pivot stands at 48.56, with support at 47.95. Currently trading below its own pivot, the short-term chart appears to be digesting the breakout rather than reversing it. For those tracking execution, this pullback zone near the 15-minute EMA20 and pivot support offers a more logical reference point than chasing strength directly into resistance.
Bullish scenario for IREN stock
The bullish case for IREN stock rests on the daily breakout above the upper Bollinger Band holding firm. Price needs to sustain levels above the 47.61 pivot and eventually clear the 49.84 resistance. A daily RSI still under 65 leaves room to run before overbought conditions become a real constraint.
On the fundamental side, the Microsoft delivery news, updated Nvidia status, and reports around IREN’s $4 billion AI target all reinforce the narrative of a credible pivot toward AI-focused cloud computing. Continued strength across AI infrastructure peers — following the wave of enthusiasm sparked by Riot Platforms’ data center deal — could keep sentiment tilted in IREN’s favor.
Bearish scenario and what would invalidate the bullish case
On the other hand, the overbought readings on both hourly and 15-minute RSI — at 79.01 and 78.12 respectively — warn that a pullback is a live risk regardless of the daily trend. A rejection at the 49.84 resistance level, followed by a break back below the daily pivot at 47.61, would weaken the breakout thesis considerably.
Losing the 46.05 support would be a more serious signal. It could potentially drag price back toward the EMA50/EMA200 cluster near 43.4–43.5. Sentiment risk also exists outside the charts. Jim Cramer publicly favored CoreWeave over IREN, calling it “cheaper and better” — a reminder that not all market voices are convinced IREN’s AI valuation story is the strongest in the sector.
Closing take on IREN stock
Overall, the daily trend in IREN stock has turned constructive. It is supported by a clean EMA stack and a breakout above the upper Bollinger Band. Yet the hourly and 15-minute charts show clear overbought stress. The daily MACD line hasn’t fully confirmed the shift that the histogram is already signaling. With ATR14 at 4.29 on the daily chart, volatility is elevated and swings in either direction should be expected. Positioning here requires balancing the credibility of the AI-driven narrative against the near-term risk of a cooling-off period before the next directional move becomes clearer.
FAQ
What is the key breakout level for IREN stock?
The critical breakout signal is the daily close above the upper Bollinger Band at 46.6, with IREN stock finishing at $48.27. The next major resistance to watch is $49.84.
Is IREN stock overbought right now?
It depends on the timeframe. The daily RSI14 at 60.18 remains comfortably bullish and not yet stretched. However, the hourly RSI14 at 79.01 and 15-minute RSI14 at 78.12 are both deep in overbought territory, signaling near-term cooling risk.
What fundamentals are driving IREN stock higher?
The rally is tied to Microsoft delivery news, an updated Nvidia status, and reports around IREN’s $4 billion AI infrastructure target. Broader enthusiasm across AI peers — including momentum from Riot Platforms’ data center deal — is also lifting sentiment.
What level would invalidate the bullish case?
A rejection at $49.84 resistance followed by a break below the daily pivot at $47.61 would weaken the breakout thesis. Losing the $46.05 support level would be a more serious bearish signal, potentially dragging price toward the EMA50/EMA200 cluster near 43.4–43.5.
Disclaimer: This article is for informational purposes only and does not constitute financial advice, an investment recommendation, or a solicitation to buy or sell any financial instrument or cryptocurrency. The analysis provided is not indicative of future results. Investing in crypto assets and financial markets carries a high risk of capital loss. Always do your own research (DYOR) and consult a qualified financial advisor before making any decision.
Article produced with the assistance of artificial intelligence and reviewed by the editorial team.
