




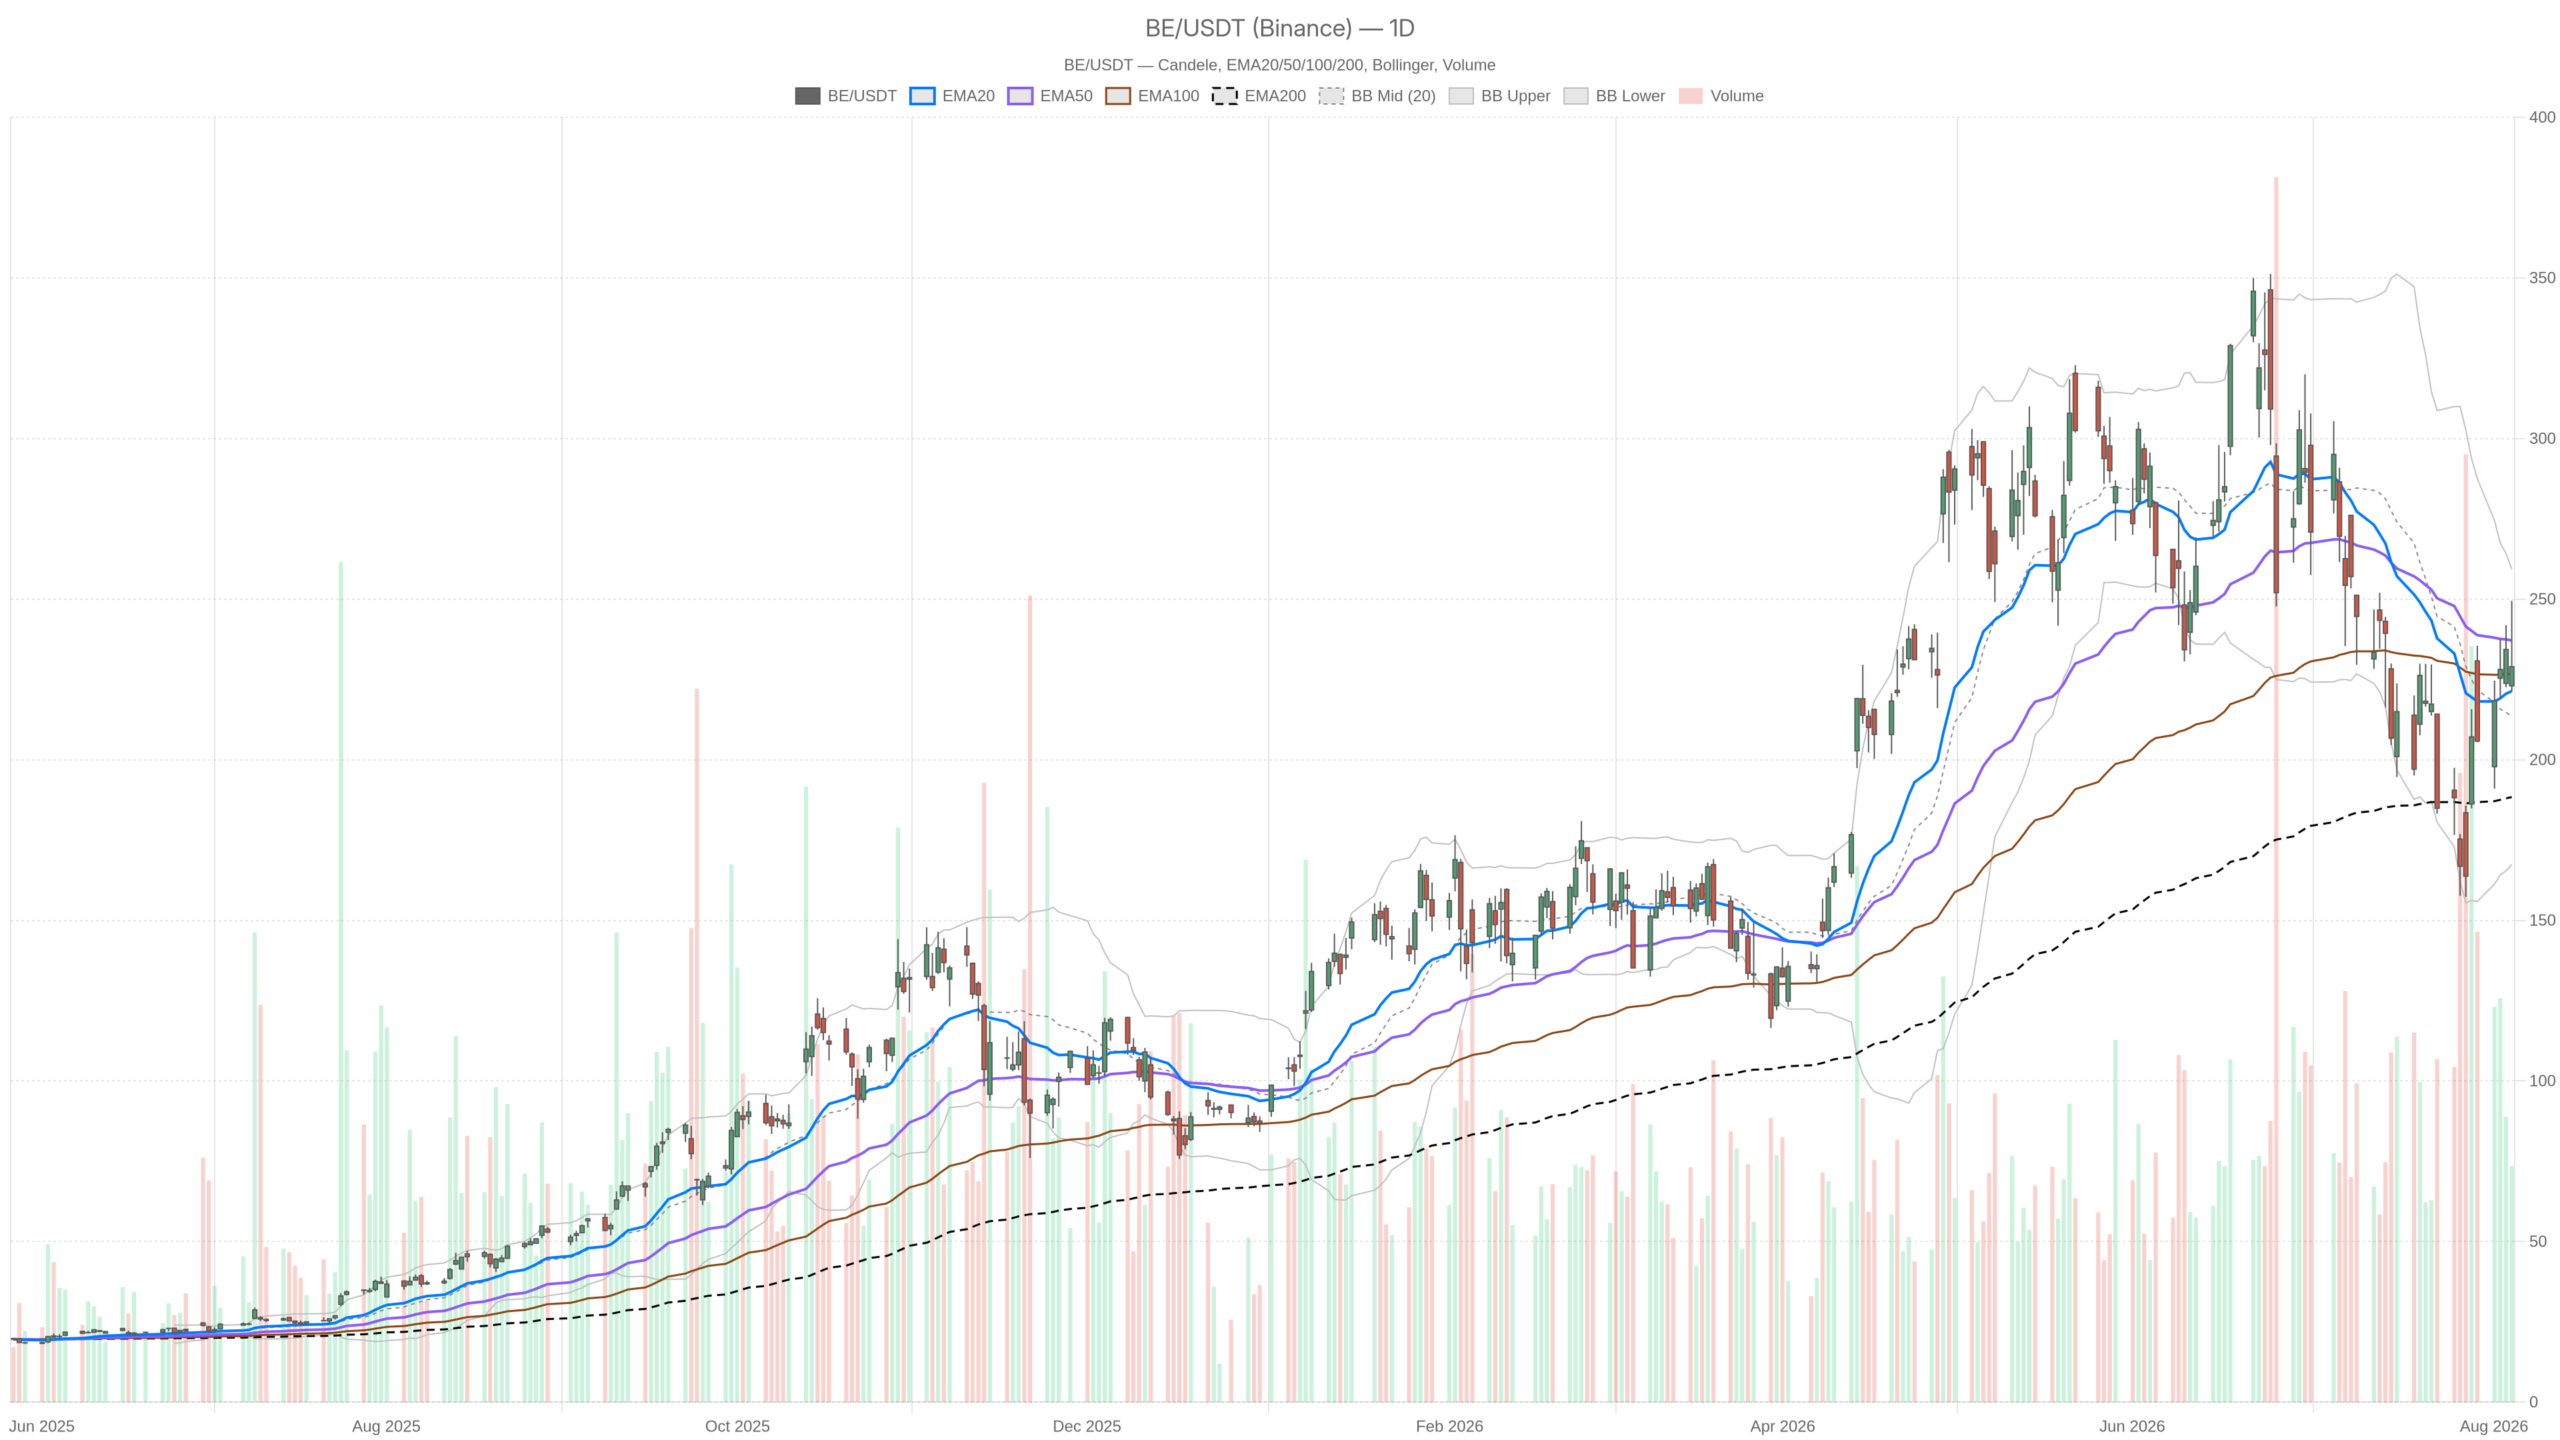
Bloom Energy stock is digesting a sharp rejection at 249.45, closing at 228.96. The 28-point daily range shows sellers controlling the upper half. Yet the daily trend structure remains intact. This is a corrective pause inside a larger advance, not a breakdown.
Summary
Key takeaways
- BE closed at 228.96 after an intraday swing from 221.21 to 249.45 — a 28-point range in a single session.
- Daily ATR stands at 27.37, roughly 12% of the share price, keeping volatility exceptionally high.
- Price holds above the 200-day EMA at 188.39 but remains below the 50-day EMA at 237.14.
- Daily RSI reads 50.43 at the midline, signalling a momentum reset rather than a breakdown.
- Key decision levels: support at 216.96, pivot at 233.21, resistance at 245.20.
Why the daily chart keeps bloom energy stock in a neutral regime
Bloom energy stock sits in a neutral daily regime because moving averages are mixed and RSI has reset to its midline. The broader uptrend is structurally intact, but medium-term momentum has stalled.
The moving average configuration is genuinely mixed. Price is above the 20-day EMA at 221.36 and comfortably above the 200-day, yet below the 50-day. That is the signature of a stock working off an overextended move rather than reversing it. Short-term demand is holding, but medium-term momentum has stalled.
Momentum indicators point to basing, not trending
Daily RSI reads 50.43 — dead centre. BE joined Q2 standouts like Microsoft and EMCOR Group after an earnings-driven expansion. Therefore, a return to the midline is a reset, not a warning. Momentum has neither the strength of a trending market nor the weakness of a breakdown.
MACD is more interesting. The line sits at -10.68 against a signal at -16.67, leaving the histogram positive at 5.99. The absolute values remain below zero, so medium-term momentum is still damaged. However, the improving histogram shows selling pressure is fading rather than accelerating. That combination usually precedes a base, not an immediate trend resumption.
Volatility defines the digestion zone
Volatility is the dominant fact here. Daily ATR stands at 27.37, roughly 12% of the share price. Bollinger Bands span 167.41 to 259.36 around a 213.39 midline. Those are enormous parameters. Notably, price sits well inside that envelope, closer to the mid than the extremes. This is consistent with a digestion phase after a volatility shock.
Daily pivots frame the near-term battlefield cleanly. The pivot point is 233.21, with resistance at 245.20 and support at 216.96. Wednesday’s close at 228.96 leaves BE below its pivot. In practical terms, sellers still hold the intraday reference level.
The 1H chart complicates rather than confirms
The hourly chart weakens the constructive daily picture. Short-term momentum has turned lower and moving averages are tangled, confirming no clear intraday trend.
Hourly structure weakens the constructive read. The last hourly close of 228.89 sits below both the 20-period EMA at 231.91 and the 200-period EMA at 230.34. Meanwhile, it holds above the 50-period EMA at 221.30. That is a compressed, tangled set of averages — and tangled averages mean no trend.
Hourly RSI at 49.90 mirrors the daily midline reading. However, hourly MACD is deteriorating. The line at 4.80 has crossed below the 6.85 signal, pushing the histogram to -2.05. Short-term momentum is rolling over even though values remain positive. The intraday impulse that drove the run to 249.45 has expired.
Price is also pinned near the lower hourly Bollinger Band at 226.35, with the midline up at 234.77. Hourly ATR of 7.71 underscores how wide the swings remain on a small timeframe. Therefore, the 226–232 zone should be treated as noise-heavy rather than clean structure. Hourly pivots reinforce that: PP 229.54, R1 231.48, S1 226.95 — a range of less than five points.
15m execution context: stretched, not broken
The 15-minute chart shows BE is oversold into support. This creates potential for a mean-reversion bounce, though the short-term slide has not yet stopped.
On the 15-minute chart, BE is oversold. RSI has dropped to 28.23, and price at 228.89 trades beneath both the 20- and 50-period EMAs, stacked at 234.58 and 234.60. The 200-period EMA at 220.54 is the deeper reference. MACD remains negative at -1.93 versus a -0.92 signal, so the short-term slide has not yet stopped.
At the same time, price has pushed to the lower 15-minute band at 227.86 with ATR at just 2.45. That is a stretched condition into a defined level. It typically produces mean-reversion attempts toward the 236.21 midline. For timing purposes, the 227.34 support and 230.69 resistance pivots mark the immediate friction points.
Bullish scenario
The bull case requires defence of 216.96 daily support and a reclaim of 233.21. Only a push through the 50-day EMA at 237.14 would confirm renewed upside momentum.
The bull case rests on the daily structure holding. It requires defence of 216.96 daily support and, ideally, the 221.36 EMA20 area. From there, bulls need a reclaim of the 233.21 daily pivot to shift the intraday balance. A push through the 237.14 EMA50 would be the real signal, opening 245.20 and the 249.45 session high.
Supporting evidence would be the daily MACD histogram continuing to expand while RSI pushes back above the midline. Hourly confirmation would come from a close back above 231.91 and 230.34, turning that cluster from resistance into support. Fundamentally, the narrative backdrop remains supportive after Bloom Energy’s inclusion among the earnings-season winners.
Bearish scenario
The bear case treats the 249.45 rejection as the top. Failure to recover 233.21 keeps sellers in control, and a close below 221.36 would open the door to 216.96 and lower.
The bear case is simpler: the 249.45 rejection was the top of this move. Failure to recover 233.21 keeps sellers in control of the pivot structure. A daily close below 221.36 would break the last short-term support reference. That puts 216.96 directly in play. Below that, the Bollinger midline at 213.39 becomes the logical magnet.
What invalidates the bullish case is a loss of 216.96 on a closing basis. This is especially true if the daily MACD histogram flattens back toward zero. Given a 27.37 ATR, such a move could travel quickly. Meanwhile, the softer energy complex adds background noise. Crude fell 5.69% and natural gas dropped 3.56% in the sessions cited — a reminder that sentiment across energy names has not been uniformly firm.
Positioning and the volatility problem
Bloom energy stock currently offers disagreement across timeframes. The daily chart is neutral-to-constructive; the hourly chart shows momentum already turning lower. Until key levels resolve, BE is a high-volatility range, not a directional trade.
Overall, the timeframes disagree, and that disagreement is the honest conclusion. The daily chart argues for neutral-to-constructive digestion above the 200-day EMA. The hourly chart argues that momentum has already turned lower. The 15-minute chart is simply oversold into support.
The practical issue for anyone watching bloom energy stock is scale. With daily ATR near 27 points and Bollinger Bands more than 90 points wide, ordinary noise looks like a trend break. Levels matter more than signals in this environment. The decision points — 216.96, 233.21, and 237.14 — resolve the conflict. Until one of them gives way on a closing basis, BE remains a high-volatility range rather than a directional trade. The uncertainty premium embedded in that range is real.
FAQ
Is bloom energy stock still in an uptrend?
Yes, on the daily timeframe. BE remains well above its 200-day EMA at 188.39, which keeps the broader uptrend structurally intact. However, the 50-day EMA at 237.14 now sits above spot price, signalling a corrective phase within that larger advance.
What are the key levels to watch for bloom energy stock?
The three decision points are support at 216.96, the daily pivot at 233.21, and the 50-day EMA at 237.14. A close above 237.14 would confirm renewed bullish momentum, while a close below 216.96 would invalidate the constructive case.
Why is Bloom Energy stock so volatile right now?
Daily ATR stands at 27.37, roughly 12% of the share price. Bollinger Bands span more than 90 points from 167.41 to 259.36. This is typical after an earnings-driven expansion, and the stock is now in a digestion phase absorbing that volatility shock.
Disclaimer: This article is for informational purposes only and does not constitute financial advice, an investment recommendation, or a solicitation to buy or sell any financial instrument or cryptocurrency. The analysis provided is not indicative of future results. Investing in crypto assets and financial markets carries a high risk of capital loss. Always do your own research (DYOR) and consult a qualified financial advisor before making any decision.
Article produced with the assistance of artificial intelligence and reviewed by the editorial team.
