




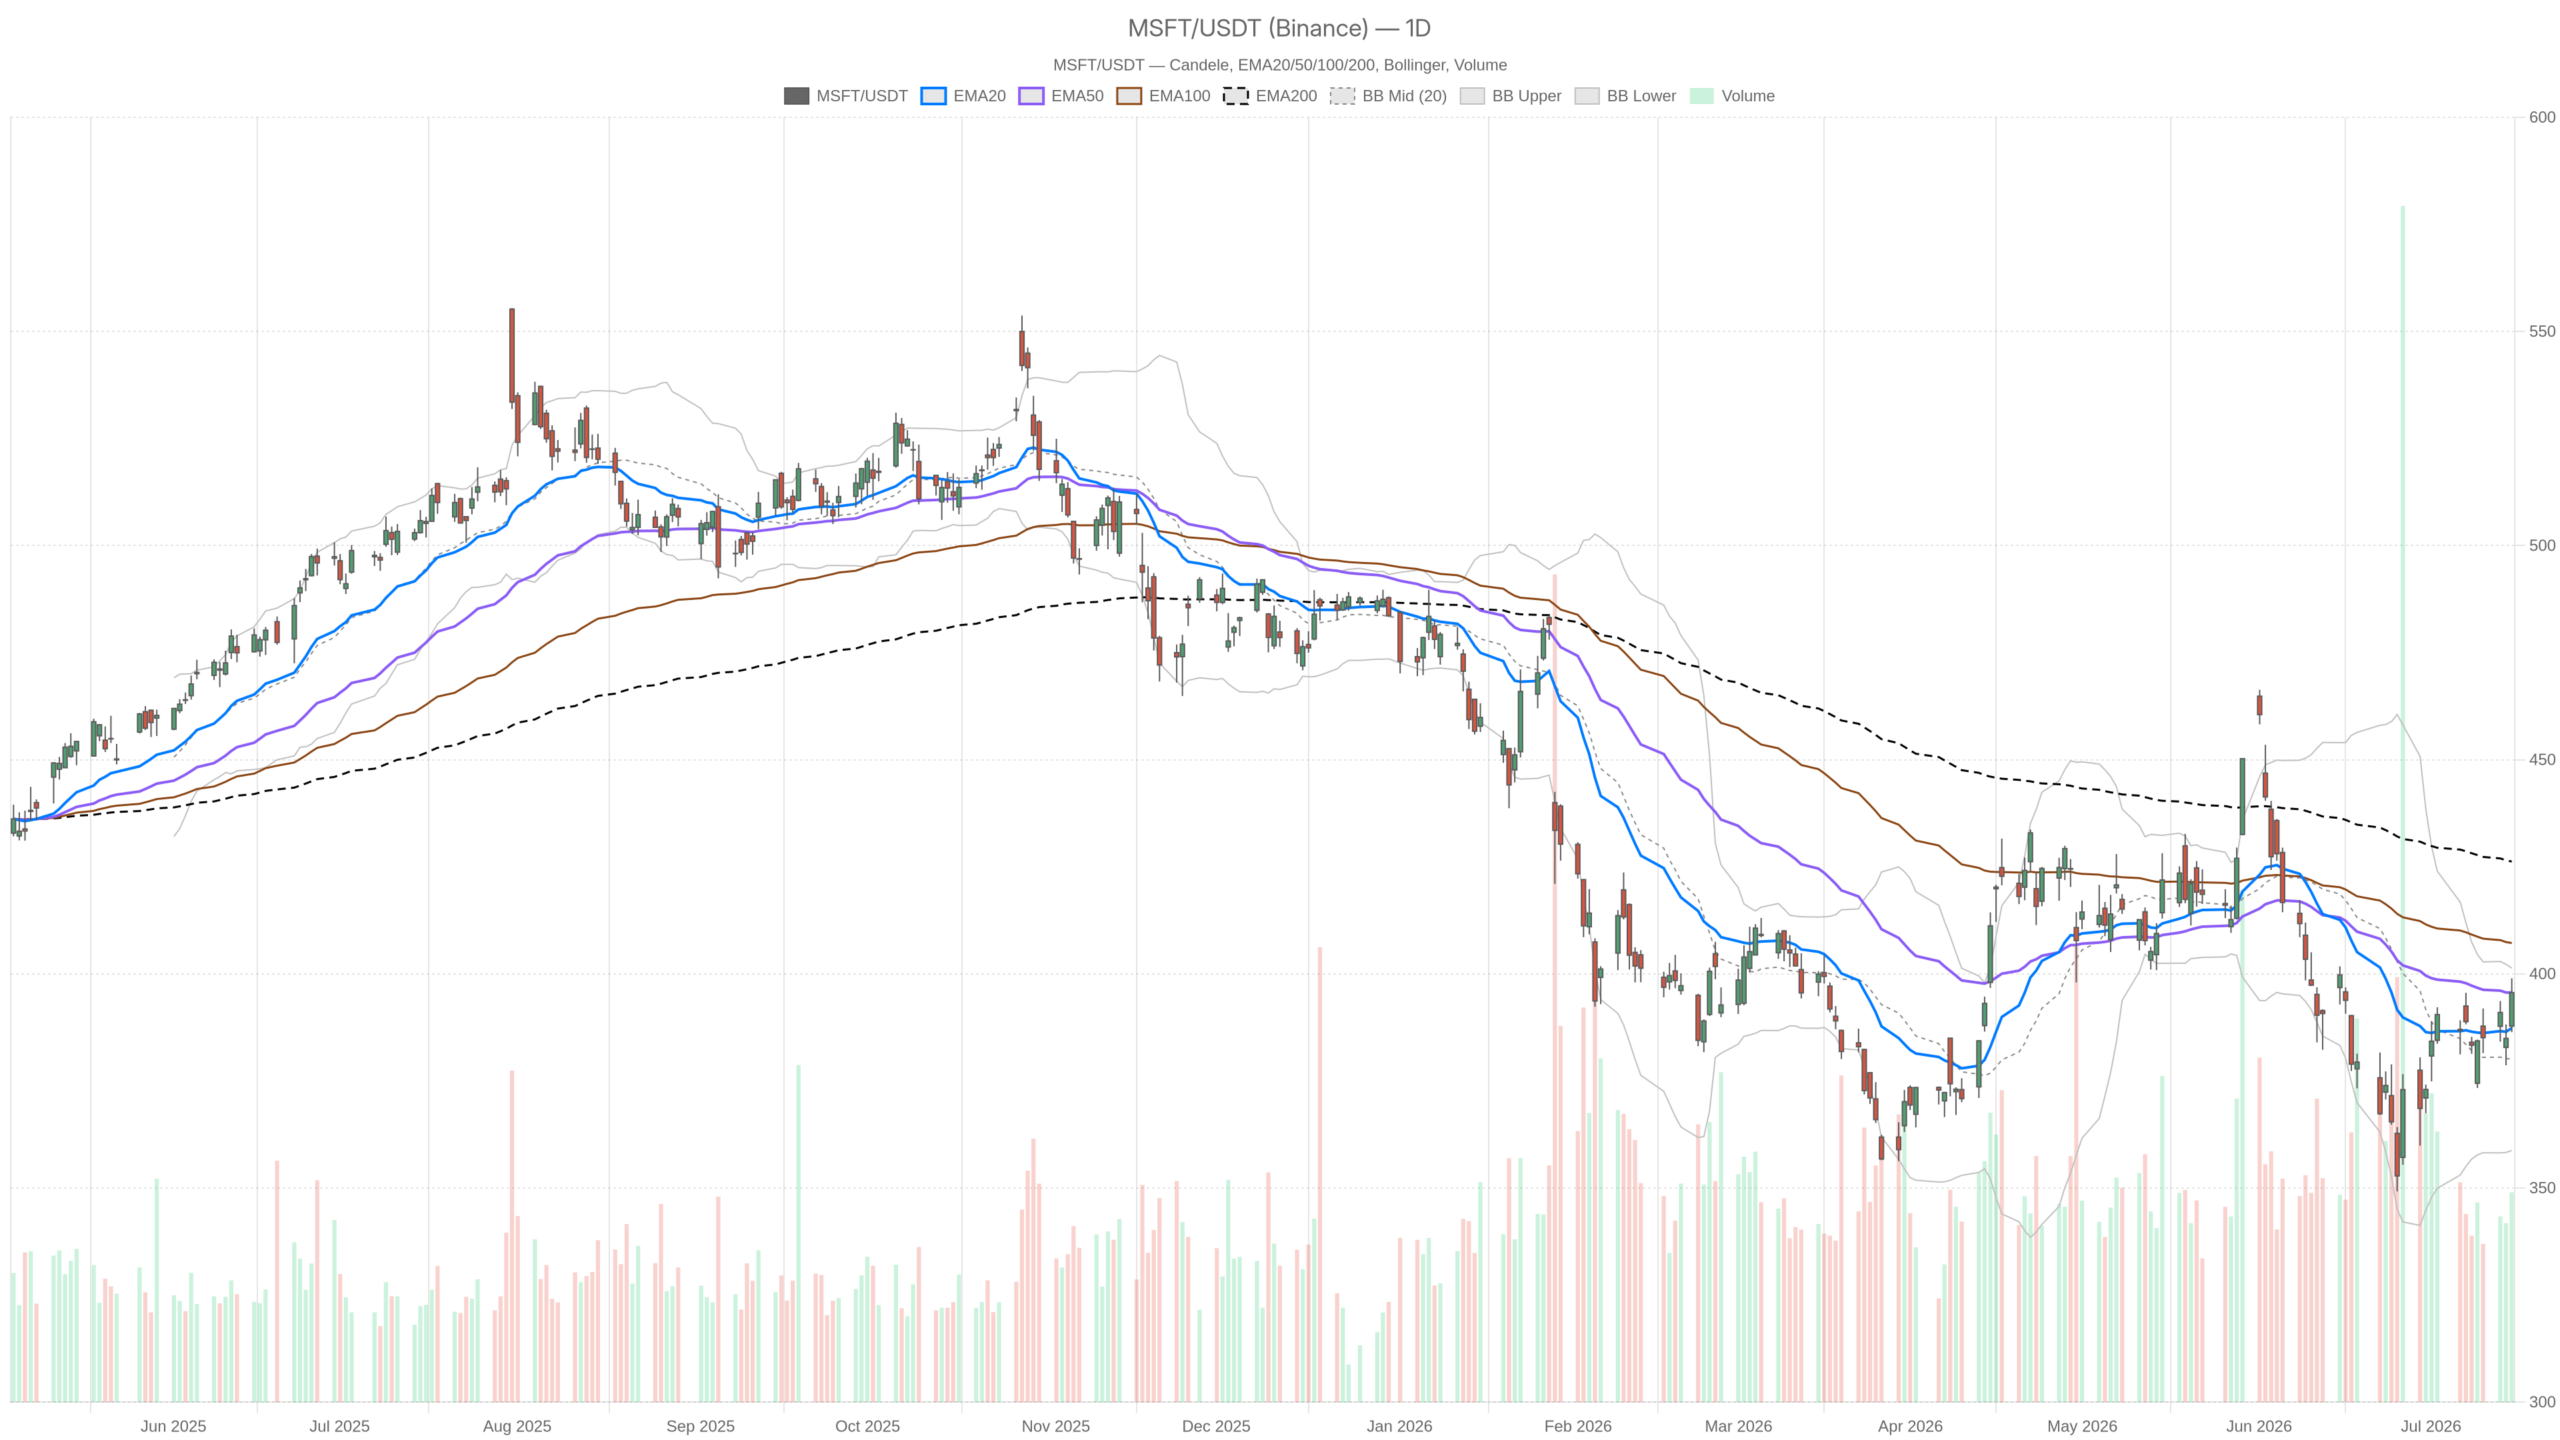
Microsoft Stock sits in a technically ambiguous zone as of July 15, with MSFT closing at $395.63. The session was constructive but falls short of a genuine trend reversal. With earnings due July 29 and two major Wall Street firms cutting price targets, the setup demands careful interpretation.
Summary
Key takeaways
- MSFT closed at $395.63 on July 15, approaching the critical $400–$401 resistance cluster.
- The daily MACD histogram turned positive at 2.99, signaling bearish momentum is decelerating rather than reversing.
- Both Citi and Mizuho cut price targets but maintained bullish ratings ahead of the July 29 earnings report.
- The EMA200 sits far overhead at $426.22, leaving no nearby long-term average to support price in a downturn.
- Daily ATR of $12.49 confirms elevated volatility heading into a major earnings catalyst.
Daily Bias on Microsoft Stock: Neutral With Early Recovery Signs
The daily bias on Microsoft Stock remains neutral, though early recovery signs are beginning to surface in the momentum data. Price closed at $395.63 on solid range expansion, having touched a session high of $398.96.
EMA Structure Reflects a Damaged Trend
That intraday move is encouraging on the surface. However, the broader structure tells a more cautious story. The EMA20 sits at $387.35, and the EMA50 is at $395.64 — essentially where price closed. MSFT is wrestling with its own 50-day average. This level often acts as dynamic resistance during recoveries. Meanwhile, the EMA200 remains far overhead at $426.22. Price trading nearly $30 below the 200-day average is not a bullish structure by any standard definition.
Momentum Indicators Point to Deceleration
The daily MACD is negative, with the line at -2.96 and the signal at -5.95. The histogram, however, has turned positive at 2.99. That divergence is meaningful: it signals bearish momentum is losing steam, even if the trend itself hasn’t flipped. This is deceleration, not reversal — an important distinction heading into an event-driven catalyst. The RSI14 on the daily stands at 53.5, neutral territory. It leaves room for movement in either direction without an immediate technical constraint from momentum exhaustion.
The $400–$401 Resistance Cluster Defines the Ceiling
Bollinger Bands place the midline at $380.05, with the upper band at $401.34. The current close at $395.63 is approaching that upper band. This level historically acts as a short-term ceiling during consolidation phases. Notably, a clean break above $401.34 would carry real significance. Meanwhile, the daily ATR of $12.49 confirms elevated volatility. Intraday swings of that magnitude are entirely normal for a name of this size.
Pivot analysis gives a pivot point at $393.66, with R1 resistance at $400.93 and S1 support at $388.37. The close above the daily pivot is a modest positive. Therefore, R1 at $400.93 aligns closely with the upper Bollinger Band. The $400–$401 zone stands as the critical short-term resistance cluster to monitor.
Hourly Structure Strengthens the Near-Term Case for Microsoft Stock
The hourly chart strengthens the near-term case for Microsoft Stock, with price trading above all three key moving averages simultaneously. On the 1H timeframe, the picture brightens considerably.
Bullish EMA Alignment Confirms Intraday Strength
Price closed the last hourly bar at $395.62. All three key EMAs — the 20 at $391.49, the 50 at $387.93, and the 200 at $389.89 — are stacked below current price. That alignment is bullish in structure. The stock is trading above its short, medium, and longer-term hourly averages simultaneously.
Momentum Builds Without Reaching Exhaustion
The hourly RSI at 63.13 reflects genuine upside momentum. It’s elevated but not yet in overbought territory, suggesting the move still has room to extend. The MACD reinforces that read: the line at 2.74 is above the signal at 2.08, with a positive histogram of 0.65. Momentum is building, not fading, on an intraday basis.
In contrast to the daily chart’s caution, the hourly Bollinger Bands show price trading comfortably within range. The upper band sits at $399.99. The hourly ATR of $3.90 suggests manageable intraday volatility. Overall, the 1H structure confirms rather than contradicts the cautiously optimistic daily reading. Short-term momentum is constructive heading into the close.
15-Minute Context: Tactical Positioning Near Resistance
The 15-minute chart carries a bullish regime designation for Microsoft Stock, confirming active buying pressure in the most recent price action. Price closed at $395.62 with all three EMAs — 20 at $395.12, 50 at $392.57, and 200 at $387.08 — below current price. That ascending EMA stack on the shortest timeframe confirms active buying in the latest tape.
At the same time, the 15m MACD histogram has turned slightly negative at -0.44, even as the line remains positive at 1.13. That small divergence suggests very short-term momentum is losing intensity. This isn’t alarming, but it does indicate the stock may need to consolidate briefly around current levels. The 15m Bollinger upper band at $398.02 and R1 at $396.12 define the immediate ceiling for intraday traders.
Fundamental Headwinds: Analyst Cuts and the Debt Conversation
Microsoft Stock faces fundamental headwinds as Citi and Mizuho cut price targets ahead of the July 29 earnings report, though both firms maintain their bullish ratings. The technical picture doesn’t exist in isolation — the news flow around MSFT is generating a notably split signal of its own.
Both firms lowered their price targets on MSFT ahead of the fiscal Q4 report. Critically, however, both maintained their bullish ratings. That combination — lower target, unchanged conviction — reflects trimmed near-term expectations rather than a fundamental change in thesis. Citi analyst Tyler Radke lowered the price target but still sees significant upside in MSFT shares from current levels.
The reasoning behind the cuts appears tied to rapidly escalating capital expenditure across major technology names. Capital spending is increasing so fast that large companies, including Microsoft, are borrowing hundreds of billions of dollars. The question of whether that AI-driven investment cycle will generate sufficient returns — and on what timeline — is precisely what markets will scrutinize on July 29.
The framing in current commentary suggests the recent sell-off may already be partially pricing in the risk. That doesn’t eliminate the risk. It simply means the bar for a negative earnings surprise may be somewhat lower than headline price declines suggest.
Bullish Scenario: What Would Confirm the Recovery
A bullish recovery in Microsoft Stock would require a sustained close above the $400–$401 resistance cluster and a positive earnings catalyst on July 29. Several conditions must align for this scenario to take hold.
First, price must clear the $400–$401 resistance cluster — the convergence of the daily upper Bollinger Band and the daily R1. A sustained close above that zone would shift the structural bias meaningfully. Second, the July 29 earnings report would need to demonstrate that cloud and AI revenue momentum remains intact despite elevated capital spending. If management provides forward guidance that justifies the investment cycle, the gap to the EMA200 at $426.22 becomes a realistic medium-term target. Third, daily MACD turning positive would confirm the broader trend is genuinely reversing, not merely pausing within a larger downtrend.
Bearish Scenario: What Would Invalidate the Bullish Case
The bullish case for Microsoft Stock would be invalidated by an earnings disappointment, potentially triggering a retest of the $388.37 S1 support. On the other hand, the bearish scenario is equally plausible given current positioning.
If earnings disappoint — whether through revenue misses, guidance cuts, or concerns about AI spending returns — the stock could quickly retest the daily S1 at $388.37. A break below that level would expose the $380 Bollinger midline, and potentially the lower band near $358.76. The EMA20 at $387.35 would be the first line of dynamic support to monitor on any pullback. Furthermore, the EMA200 sitting so far above at $426.22 means there is no technical gravitational pull from a nearby long-term average to support the price in a risk-off scenario.
Positioning Ahead of the Earnings Catalyst
Microsoft Stock is in a technically transitional state, with range-bound trading between $388 and $401 defining the most probable near-term path. The daily regime remains neutral, but the hourly structure is constructively bullish. The 15-minute trend also supports near-term upside. The conflict between short-term momentum and longer-term trend damage is the defining tension in this setup.
Volatility, as measured by the daily ATR of $12.49, is elevated — appropriate for a stock sitting on the edge of a major earnings catalyst. Positioning ahead of July 29 carries material event risk in both directions. The analyst community is cautiously optimistic but trimming near-term expectations. That combination typically means the stock needs a genuine earnings beat to sustain any breakout above $401. Until that catalyst arrives, the $388–$401 range remains the most probable path for MSFT.
FAQ
What is the daily bias for Microsoft Stock right now?
The daily bias for Microsoft Stock is neutral with early recovery signs. MSFT closed at $395.63 on July 15, wrestling with its EMA50 at $395.64. The MACD histogram has turned positive at 2.99, signaling bearish momentum is decelerating, though the trend has not yet flipped.
What is the key resistance level for MSFT?
The critical resistance cluster sits at $400–$401, formed by the convergence of the daily upper Bollinger Band at $401.34 and the daily R1 pivot at $400.93. A sustained close above this zone would shift the structural bias meaningfully.
What are the earnings expectations for Microsoft Stock?
Analysts are cautiously optimistic. Both Citi and Mizuho cut price targets but maintained bullish ratings ahead of the July 29 fiscal Q4 report. The key question is whether AI-driven capital expenditure will generate sufficient returns.
What happens if Microsoft Stock earnings disappoint?
If earnings disappoint, MSFT could quickly retest the daily S1 support at $388.37. A break below that would expose the $380 Bollinger midline and potentially the lower band near $358.76. The EMA20 at $387.35 would be the first dynamic support to monitor.
Disclaimer: This article is for informational purposes only and does not constitute financial advice, an investment recommendation, or a solicitation to buy or sell any financial instrument or cryptocurrency. The analysis provided is not indicative of future results. Investing in crypto assets and financial markets carries a high risk of capital loss. Always do your own research (DYOR) and consult a qualified financial advisor before making any decision.
Article produced with the assistance of artificial intelligence and reviewed by the editorial team.
