



Microsoft stock is navigating a difficult stretch near $385 as of July 10. MSFT has shed roughly 18% year-to-date. The daily chart points bearish, yet early intraday stabilization signals are beginning to complicate the picture. The dominant bias remains to the downside.
Summary
Key takeaways
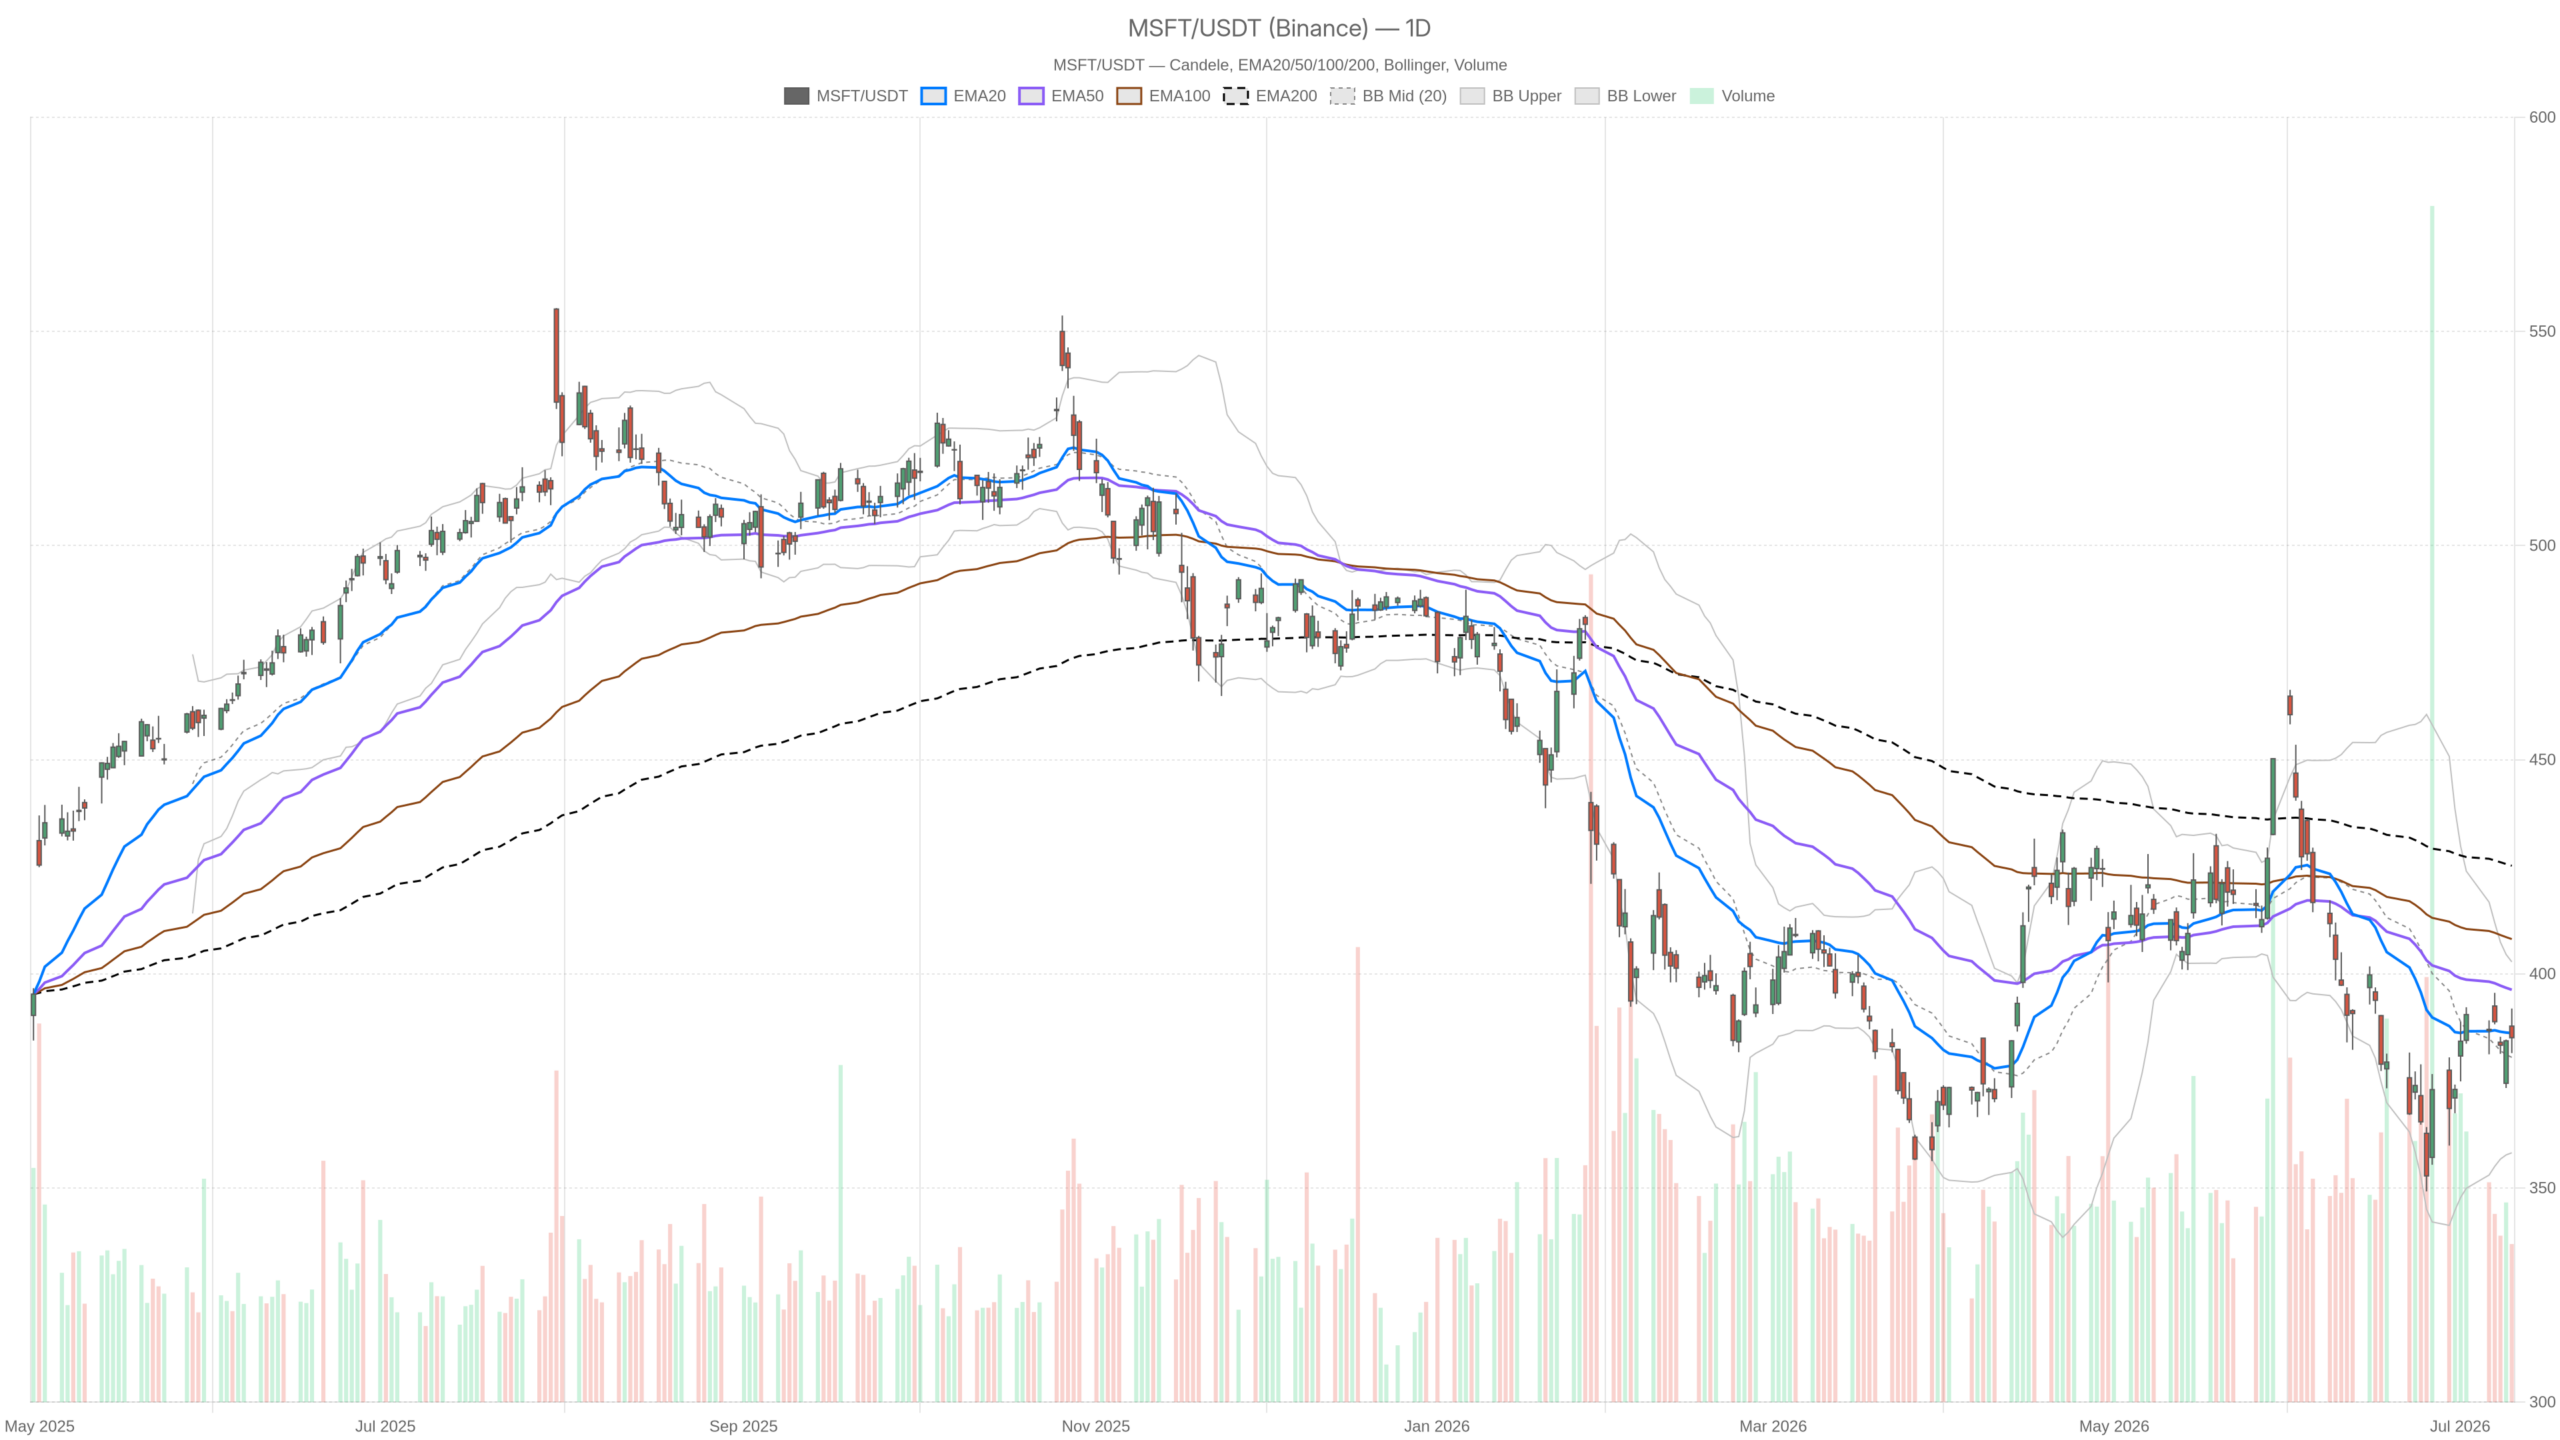
- Microsoft stock closed at $385.10 on July 10, below its daily EMA20 ($386.18) and EMA50 ($396.29).
- The daily RSI14 at 47.52 sits below the neutral 50 midpoint, offering no momentum recovery signal.
- The daily MACD histogram turned positive at +2.48, suggesting bearish momentum is decelerating.
- The hourly chart shows short-term EMAs flipping below price, hinting at early stabilization for Microsoft stock.
- Daily ATR14 at $12.68 reflects elevated volatility, meaning wide swings remain likely on any given session.
Daily Timeframe: Microsoft Stock’s Bearish Regime in Full View
The daily chart leaves little room for ambiguity — Microsoft stock remains in a bearish structural regime.
EMA Stack Confirms the Downtrend
MSFT closed at $385.10 on July 10, well below both its EMA20 at $386.18 and EMA50 at $396.29. The EMA200 sits at $425.25 — far above current price. That stack of declining averages confirms a bearish structural regime with no short-term overlap to challenge it.
The daily RSI14 at 47.52 reinforces this picture. It sits just below the neutral midpoint of 50, offering no momentum recovery signal. Notably, the stock is neither oversold nor showing any meaningful upside impulse at this stage.
MACD Histogram Offers a Subtle Shift
Meanwhile, the daily MACD tells a more nuanced story. The MACD line at -5.55 remains firmly in negative territory, and the signal line at -8.03 confirms the broader downtrend. However, the histogram has turned positive at +2.48 — a small but notable development. This expansion suggests bearish momentum is decelerating, even if the direction has not reversed.
Volatility and Pivot Levels Set the Battlefield
Bollinger Bands on the daily frame place price inside a wide range. The midline sits at $380.51, with the upper band at $402.80 and lower band at $358.22. Therefore, price swings reflecting the ATR14 reading of $12.68 should be expected on any given session.
Daily pivot levels set the immediate reference points: the pivot point at $386.17, resistance R1 at $390.84, and support S1 at $380.43. Overall, the July 10 close at $385.10 places MSFT just below the daily pivot — a position that typically reflects soft near-term sentiment.
Hourly Timeframe: Stabilization Emerges in Microsoft Stock
Zooming into the 1H chart, the regime shifts to neutral — a signal worth examining for early signs of a Microsoft stock recovery attempt.
Short-Term EMAs Flip Constructive
The hourly EMA20 at $383.97 and EMA50 at $383.14 are now both below price. This suggests the short-term trend has quietly flipped constructive. However, the hourly EMA200 at $390.38 remains overhead, capping any meaningful recovery attempt.
The hourly RSI14 at 53.33 sits modestly above the midpoint. Still, it confirms that short-term selling pressure has eased. In contrast to the daily RSI, this mild positive divergence across timeframes is significant. It is one of the clearest signs that MSFT may be attempting a base-building phase.
Fresh MACD Crossover Signals Direction Change
On the hourly MACD, the line at +0.02 has just crossed above the signal line at -0.37. This generates a positive histogram of +0.39. Notably, this is a fresh crossover signal. It is small, but the direction change matters — particularly given how recently the hourly regime was under pressure.
At the same time, the 1H Bollinger midline at $382.71 has been reclaimed, with price trading closer to the upper band at $387.02. The hourly ATR14 at $2.98 reflects a tight intraday environment, consistent with consolidation rather than directional momentum. Overall, pivot levels — PP at $385.19, R1 at $385.60, S1 at $384.67 — show MSFT oscillating in a narrow band without committing to either direction.
15-Minute Frame: A Bullish Lean for Execution Context
The 15-minute chart registers a bullish regime, useful primarily for timing entries rather than setting directional thesis for Microsoft stock.
The 15-minute picture shows all three short-term EMAs aligned bullishly. EMA20 at $384.43, EMA50 at $383.73, and EMA200 at $382.35 all sit below price. Meanwhile, the 15m RSI at 56.81 adds further weight, sitting comfortably above 50 without being overbought.
However, the 15m MACD histogram at -0.03 is essentially flat. The line at +0.60 is barely above the signal at +0.63. This subtle deterioration in the very short-term momentum histogram is worth monitoring. It does not negate the bullish 15m regime. Still, it suggests the micro-move may be running low on fuel near current levels.
Overall, the 15m picture points toward near-term price resilience in the $384–$386 zone. This is consistent with both the hourly base-building and the proximity to the daily pivot.
The Bullish Scenario for Microsoft Stock: Bridging Price and Fundamentals
The bullish case for Microsoft stock hinges on price reconnecting with what several analysts view as disconnected fundamentals.
Notably, several analysts have noted a widening gap between MSFT’s market price and its underlying business performance. Azure acceleration and contracted future revenue are cited as factors that make the current price look disconnected from fundamentals. In addition, a DCF-based analysis referenced in July flagged the shares as potentially undervalued. Meanwhile, billionaire investor D.E. Shaw reportedly counts MSFT among its top stock picks for 2026.
Technically, the bullish case would require MSFT to reclaim the daily pivot at $386.17 on a sustained basis. It must then challenge R1 at $390.84. A decisive close above the EMA20 on the daily chart — currently $386.18 — would be the first meaningful structural signal. Beyond that, clearing the EMA50 at $396.29 would confirm a genuine trend reversal attempt rather than a dead-cat bounce.
The positive MACD histogram on the daily and the fresh hourly MACD crossover would gain credibility under one condition. Price must hold above $383–$384 on any pullback. Overall, that zone now aligns with multiple short-term EMA supports and reinforces the base-building thesis.
The Bearish Scenario: Structural Headwinds Remain for Microsoft Stock
The bearish case remains the path of least resistance for Microsoft stock, with multiple structural headwinds still firmly in place.
MSFT is below its daily EMA20, EMA50, and EMA200 simultaneously — a textbook bearish configuration that does not reverse overnight. At the same time, the daily RSI near 47.5 has yet to confirm any bullish momentum shift. A failure to hold the daily S1 at $380.43 would shift focus lower. The lower Bollinger band at $358.22 becomes the next major downside reference.
Meanwhile, AI bubble concerns surfacing in the news flow add a macro-level overhang. The stock has delivered 42.5% over five years, but the past 12 months have seen a 22% decline. If risk sentiment deteriorates further or earnings disappoint, the structural headwinds could intensify before any recovery thesis materializes.
In this scenario, the hourly stabilization would likely unravel. The 15m bullish regime would quickly reverse. The daily downtrend would reassert control, with the EMA stack providing layered resistance on the way down.
Positioning, Volatility, and the Uncertainty Ahead for Microsoft Stock
Microsoft stock sits at a genuine inflection point where conviction in either direction should wait for clearer structural evidence.
The daily bias is bearish and the structural damage is real. Yet the early stabilization signals at the 1H level introduce enough ambiguity to keep the picture from being one-sided. The decelerating daily MACD histogram reinforces this uncertainty. Meanwhile, the daily ATR of $12.68 serves as a constant reminder that volatility remains elevated, making any position sizing decision consequential.
A business narrative increasingly diverges from the price chart, while the technical structure has yet to confirm a floor. In this environment, MSFT demands patience. A daily close that resolves the current stalemate around the $385–$390 zone would be decisive. It would provide the clearest signal for the next directional move.
FAQ
Is Microsoft stock in a bearish trend?
Yes. Microsoft stock closed at $385.10 on July 10, well below its daily EMA20 ($386.18), EMA50 ($396.29), and EMA200 ($425.25). This stacked declining-average configuration confirms a bearish structural regime with no short-term overlap to challenge it.
Are there any signs of a Microsoft stock recovery?
Early stabilization signals are emerging on the hourly chart. The hourly EMA20 and EMA50 have flipped below price, and the hourly MACD has produced a fresh positive crossover. However, the daily EMA200 at $390.38 remains overhead, capping any meaningful recovery until price can reclaim that level.
What are the key support and resistance levels for MSFT?
On the daily frame, the pivot point sits at $386.17, resistance R1 at $390.84, and support S1 at $380.43. The lower Bollinger band at $358.22 represents the next major downside reference if S1 fails. The EMA50 at $396.29 is the key level for confirming any genuine trend reversal.
Has Microsoft stock underperformed recently?
Yes. MSFT has shed roughly 18% year-to-date and approximately 22% over the past 12 months, despite the business continuing to grow its cloud and AI revenue base. Over five years, the stock has delivered 42.5%, highlighting the contrast between long-term performance and recent pressure.
Disclaimer: This article is for informational purposes only and does not constitute financial advice, an investment recommendation, or a solicitation to buy or sell any financial instrument or cryptocurrency. The analysis provided is not indicative of future results. Investing in crypto assets and financial markets carries a high risk of capital loss. Always do your own research (DYOR) and consult a qualified financial advisor before making any decision.
Article produced with the assistance of artificial intelligence and reviewed by the editorial team.
