



Netflix stock closed at $73.37 on July 10, trading well below all key moving averages. Momentum indicators remain pointed south. While fundamental narratives describe an accelerating business, the technical picture is structurally bearish. It leaves little room for near-term optimism.
Summary
Key takeaways
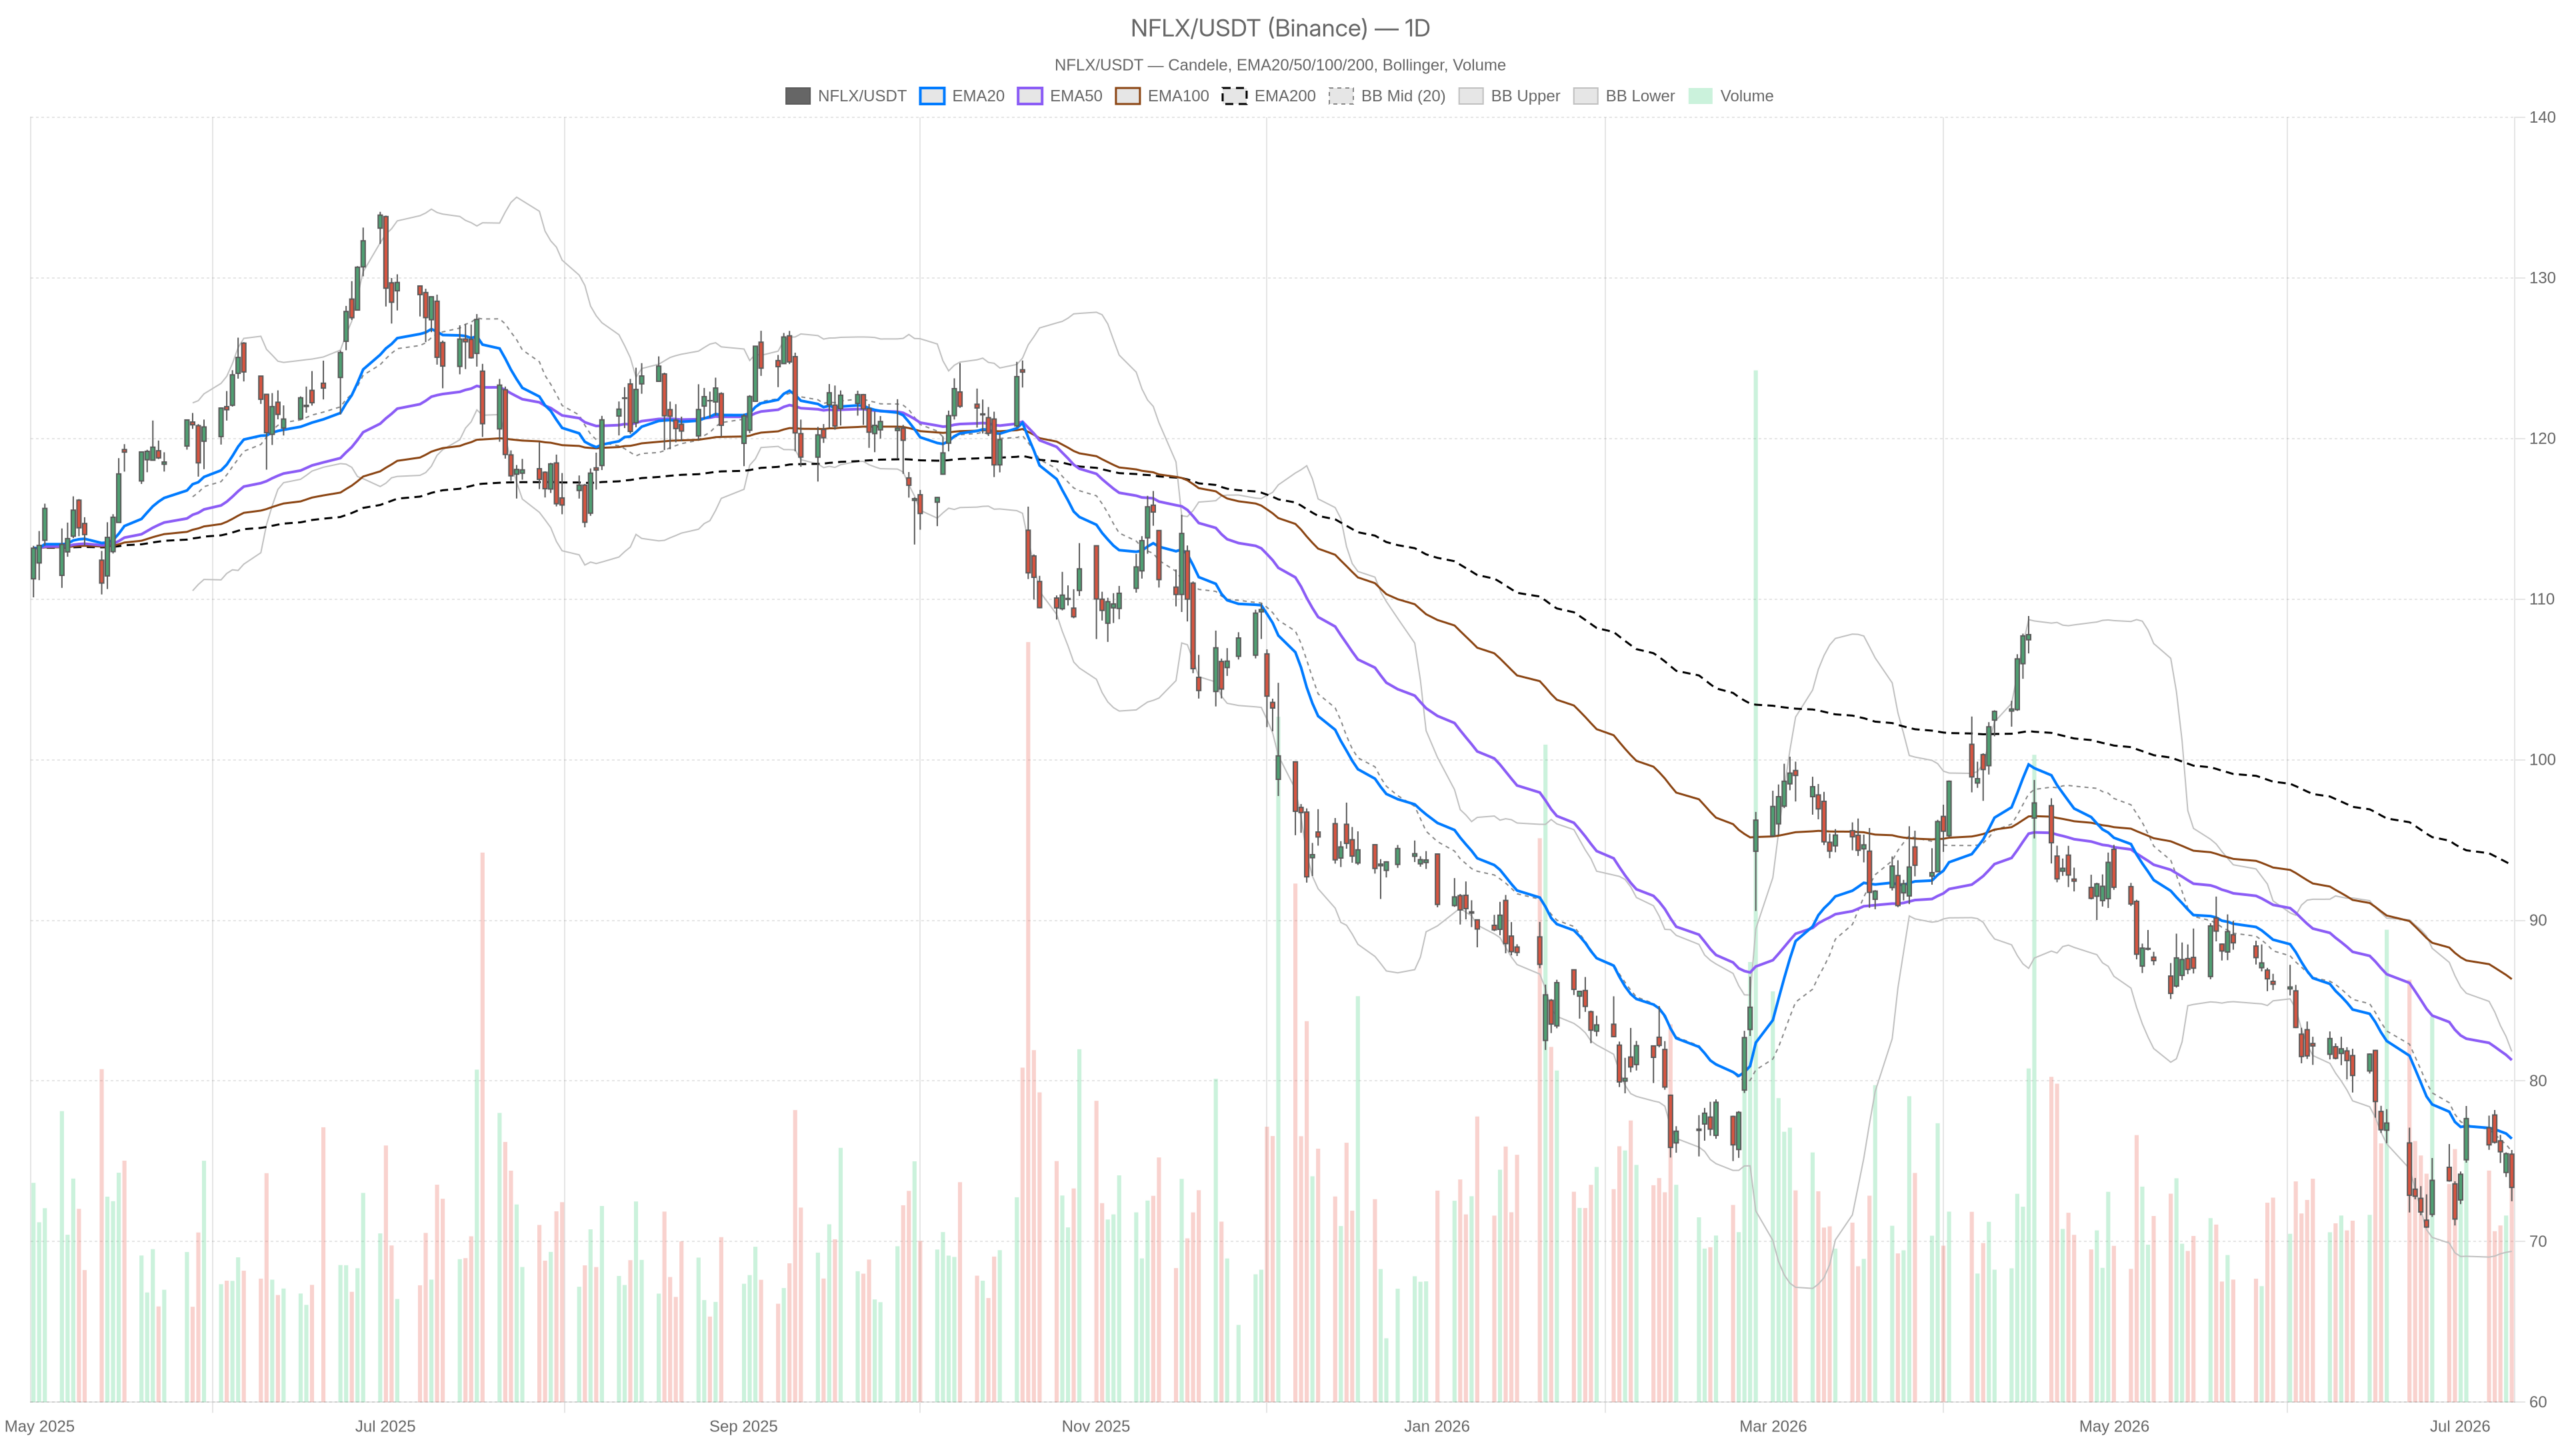
- NFLX closed at $73.37, below the EMA20 ($76.40), EMA50 ($81.30), and EMA200 ($93.43)
- Daily RSI at 38.02 signals selling fatigue but no confirmed reversal
- Daily MACD histogram turned positive at +0.53, hinting at slowing bearish momentum
- Bearish regimes align across daily, hourly, and 15-minute timeframes
- Key support sits at $72.02 (S1), with the next major zone at $69.39 (daily lower Bollinger Band)
Daily Timeframe: Netflix Stock Bias Is Firmly Bearish
Netflix stock is firmly bearish on the daily timeframe. Price sits below all three key moving averages, with no technical floor visible in the current structure. The daily regime is unambiguously bearish. NFLX at $73.37 trades beneath the EMA20 at $76.40. It also sits below the EMA50 at $81.30 and the EMA200 at $93.43. That stack of declining averages with price pinned underneath is a classic sign of sustained distribution. Each level above current price is a potential resistance zone, not a support.
Momentum Offers Stabilization, Not a Reversal Signal
On the momentum front, the RSI(14) on the daily stands at 38.02. That is oversold-adjacent but not yet at a level that historically triggers aggressive mean-reversion buying. It signals fatigue in selling pressure but not its reversal.
Meanwhile, the MACD tells a more nuanced story. The line sits at -2.29 against a signal of -2.82. This produces a histogram reading of +0.53. The histogram has turned positive, hinting that bearish momentum is slowing. That is a modest, tentative sign — not a green light.
Bands and Pivots Frame the Downside Path
In terms of volatility structure, Bollinger Bands on the daily chart frame the price action cleanly. The midband sits at $75.61. The lower band is at $69.39 and the upper at $81.83. Price is pressing toward the lower half of the range. A continued drift lower would open a path toward $69.39. ATR at $2.73 reflects meaningful daily volatility. Moves of that magnitude in either direction should be expected.
At the same time, daily pivot levels place the pivot point at $73.86, with R1 at $75.21 and S1 at $72.02. Price sits just below the pivot — a tactically weak position. Failure to reclaim $73.86 on a closing basis keeps the path of least resistance pointed toward $72.02.
Hourly Chart Confirms Netflix Stock Pressure Persists
The hourly timeframe reinforces the bearish structure. It offers no relief from the selling pressure seen on the daily chart. The 1H close at $73.38 sits below the EMA20 at $74.31. It also remains beneath the EMA50 at $74.86 and the EMA200 at $77.80. All three act as overhead resistance at progressively higher levels. The hourly regime is also classified as bearish.
Meanwhile, hourly RSI at 38.83 mirrors the daily reading almost exactly. It is weak but not yet in a zone that forces a technical reaction. The MACD on this frame shows a line of -0.68 against a signal of -0.54. The histogram sits at -0.15. Unlike the daily, where the histogram has turned positive, the hourly histogram remains negative. This means momentum is still deteriorating intraday. That divergence between daily and hourly MACD histograms is worth monitoring closely.
On this timeframe, hourly Bollinger Bands place the midband at $74.57, well above current price. The lower band sits at $72.26. This suggests the next natural technical attractor to the downside on this timeframe. ATR at $0.74 per hour reflects steady, controlled selling rather than a volatility spike. It is the kind of grind that wears out bulls over time.
15-Minute: A Small Flicker, Not a Flame
The 15-minute chart shows micro-level stabilization, but it does not alter the dominant bearish structure. On this frame, the MACD histogram at +0.12 has turned positive. The RSI at 47.25 is notably less depressed than on the higher timeframes. Price is also oscillating just above its 15m EMA20 at $73.39. These are micro-level stabilization signs.
However, the 15m EMA50 at $73.93 and EMA200 at $74.67 still loom above as resistance. The 15m regime also remains bearish. This is execution-level noise, not a trend reversal. Intraday traders might find marginal long setups near the 15m pivot support at $73.27. Yet these carry significant risk given the higher-timeframe context.
Netflix Stock Fundamental Backdrop: Noise or Signal?
The fundamental picture around Netflix stock is genuinely mixed, with bulls and bears each finding evidence to support their case. On one hand, reporting from Yahoo Finance describes a “$300 billion comeback” narrative. Netflix is posting accelerating numbers after shares slid nearly 40% over the prior year. A Seeking Alpha upgrade to Buy cites a “valuation reset” and diminished competitive risks. These are potentially significant fundamental catalysts.
However, a Wall Street Journal report highlighted weakening subscriber engagement. Top shows are reportedly losing 30–70% of their viewers. Netflix is weighing live television channels and expanded streaming bundles in response. That kind of strategic pivot under audience pressure is not typically a sign of a business firing on all cylinders. At the same time, separate reporting suggests the company may be preparing another acquisition move. The direction remains unclear.
In short, the fundamental narrative is genuinely mixed. Bulls have a valuation story. Bears have an engagement story. The chart, for now, is siding with the bears.
Bullish Scenario: What Would Change for Netflix Stock
A credible bullish case for Netflix stock exists, but it requires clear technical confirmation across multiple levels. The first requirement is a sustained close back above the daily pivot at $73.86. This must be followed by a reclaim of the EMA20 at $76.40. If NFLX can push through $75.21 — the daily R1 — that would signal a genuine short-term shift in character.
In addition, the daily MACD histogram turning persistently positive over the next several sessions would provide additional momentum confirmation. Fundamentally, positive Netflix earnings surprises or a concrete acquisition announcement could serve as the catalyst needed to break the technical inertia.
Bearish Scenario: The Path of Least Resistance for NFLX
The bearish case remains more structurally supported at this stage, with multiple downside targets within reach. A failure to reclaim the daily pivot at $73.86 keeps the door open to a test of S1 at $72.02. Below that, the daily lower Bollinger Band at $69.39 represents the next significant technical zone.
Additionally, the engagement concerns flagged in the WSJ report could weigh on investor sentiment ahead of earnings. So too could the strategy uncertainty around live TV and content bundles. Any deterioration in the hourly MACD histogram would reinforce that intraday selling pressure is far from exhausted. Notably, the hourly MACD histogram has not yet turned positive.
Positioning, Volatility, and the Road Ahead for Netflix Stock
Netflix stock enters this period in a technically vulnerable state, with bearish regimes aligned across all observed timeframes. The alignment across daily, hourly, and 15-minute frames is difficult to ignore. The daily MACD histogram offers a faint stabilization signal. However, it is not yet enough to call a bottom.
Notably, volatility — with a daily ATR of $2.73 — means price swings will remain wide and can trap both directions. Traders navigating NFLX here should respect the dominant bearish structure. Any near-term bounces should be treated as potential resistance tests rather than trend reversals. Watch closely for whether the stock can decisively reclaim $76.40 before declaring a real change of character. Until then, the burden of proof sits squarely with the bulls.
FAQ
Is Netflix stock bearish or bullish right now?
Netflix stock is firmly bearish across all major timeframes. The daily chart shows NFLX trading below its EMA20 ($76.40), EMA50 ($81.30), and EMA200 ($93.43). The daily RSI at 38.02 confirms weakness. All three observed timeframes — daily, hourly, and 15-minute — align in a bearish regime.
What are the key support levels for NFLX?
The nearest support is the daily S1 pivot at $72.02. Below that, the daily lower Bollinger Band at $69.39 is the next significant technical zone. On the hourly chart, the lower Bollinger Band at $72.26 provides an interim reference point.
What would turn Netflix stock bullish again?
A sustained close above the daily pivot at $73.86 and a reclaim of the EMA20 at $76.40 would mark the first steps. Pushing through the daily R1 at $75.21 would signal a genuine shift. A persistently positive daily MACD histogram would add momentum confirmation. Positive earnings surprises or a concrete acquisition announcement could serve as catalysts.
Disclaimer: This article is for informational purposes only and does not constitute financial advice, an investment recommendation, or a solicitation to buy or sell any financial instrument or cryptocurrency. The analysis provided is not indicative of future results. Investing in crypto assets and financial markets carries a high risk of capital loss. Always do your own research (DYOR) and consult a qualified financial advisor before making any decision.
Article produced with the assistance of artificial intelligence and reviewed by the editorial team.
