




CSCO stock is caught in a classic post-earnings tug-of-war. Cisco beat Wall Street estimates on both revenue and guidance, with fiscal fourth-quarter revenue reaching $17.25 billion against a $16.82 billion analyst estimate. Yet shares fell more than 5% despite the beat and bullish analyst reactions on AI networking strength. That disconnect between fundamentals and price action is the core tension shaping the current technical picture.
Summary
Key takeaways
- Cisco posted Q4 revenue of $17.25 billion, surpassing the $16.82 billion analyst consensus.
- CSCO stock dropped over 5% in a textbook sell-the-news reaction despite the beat-and-raise quarter.
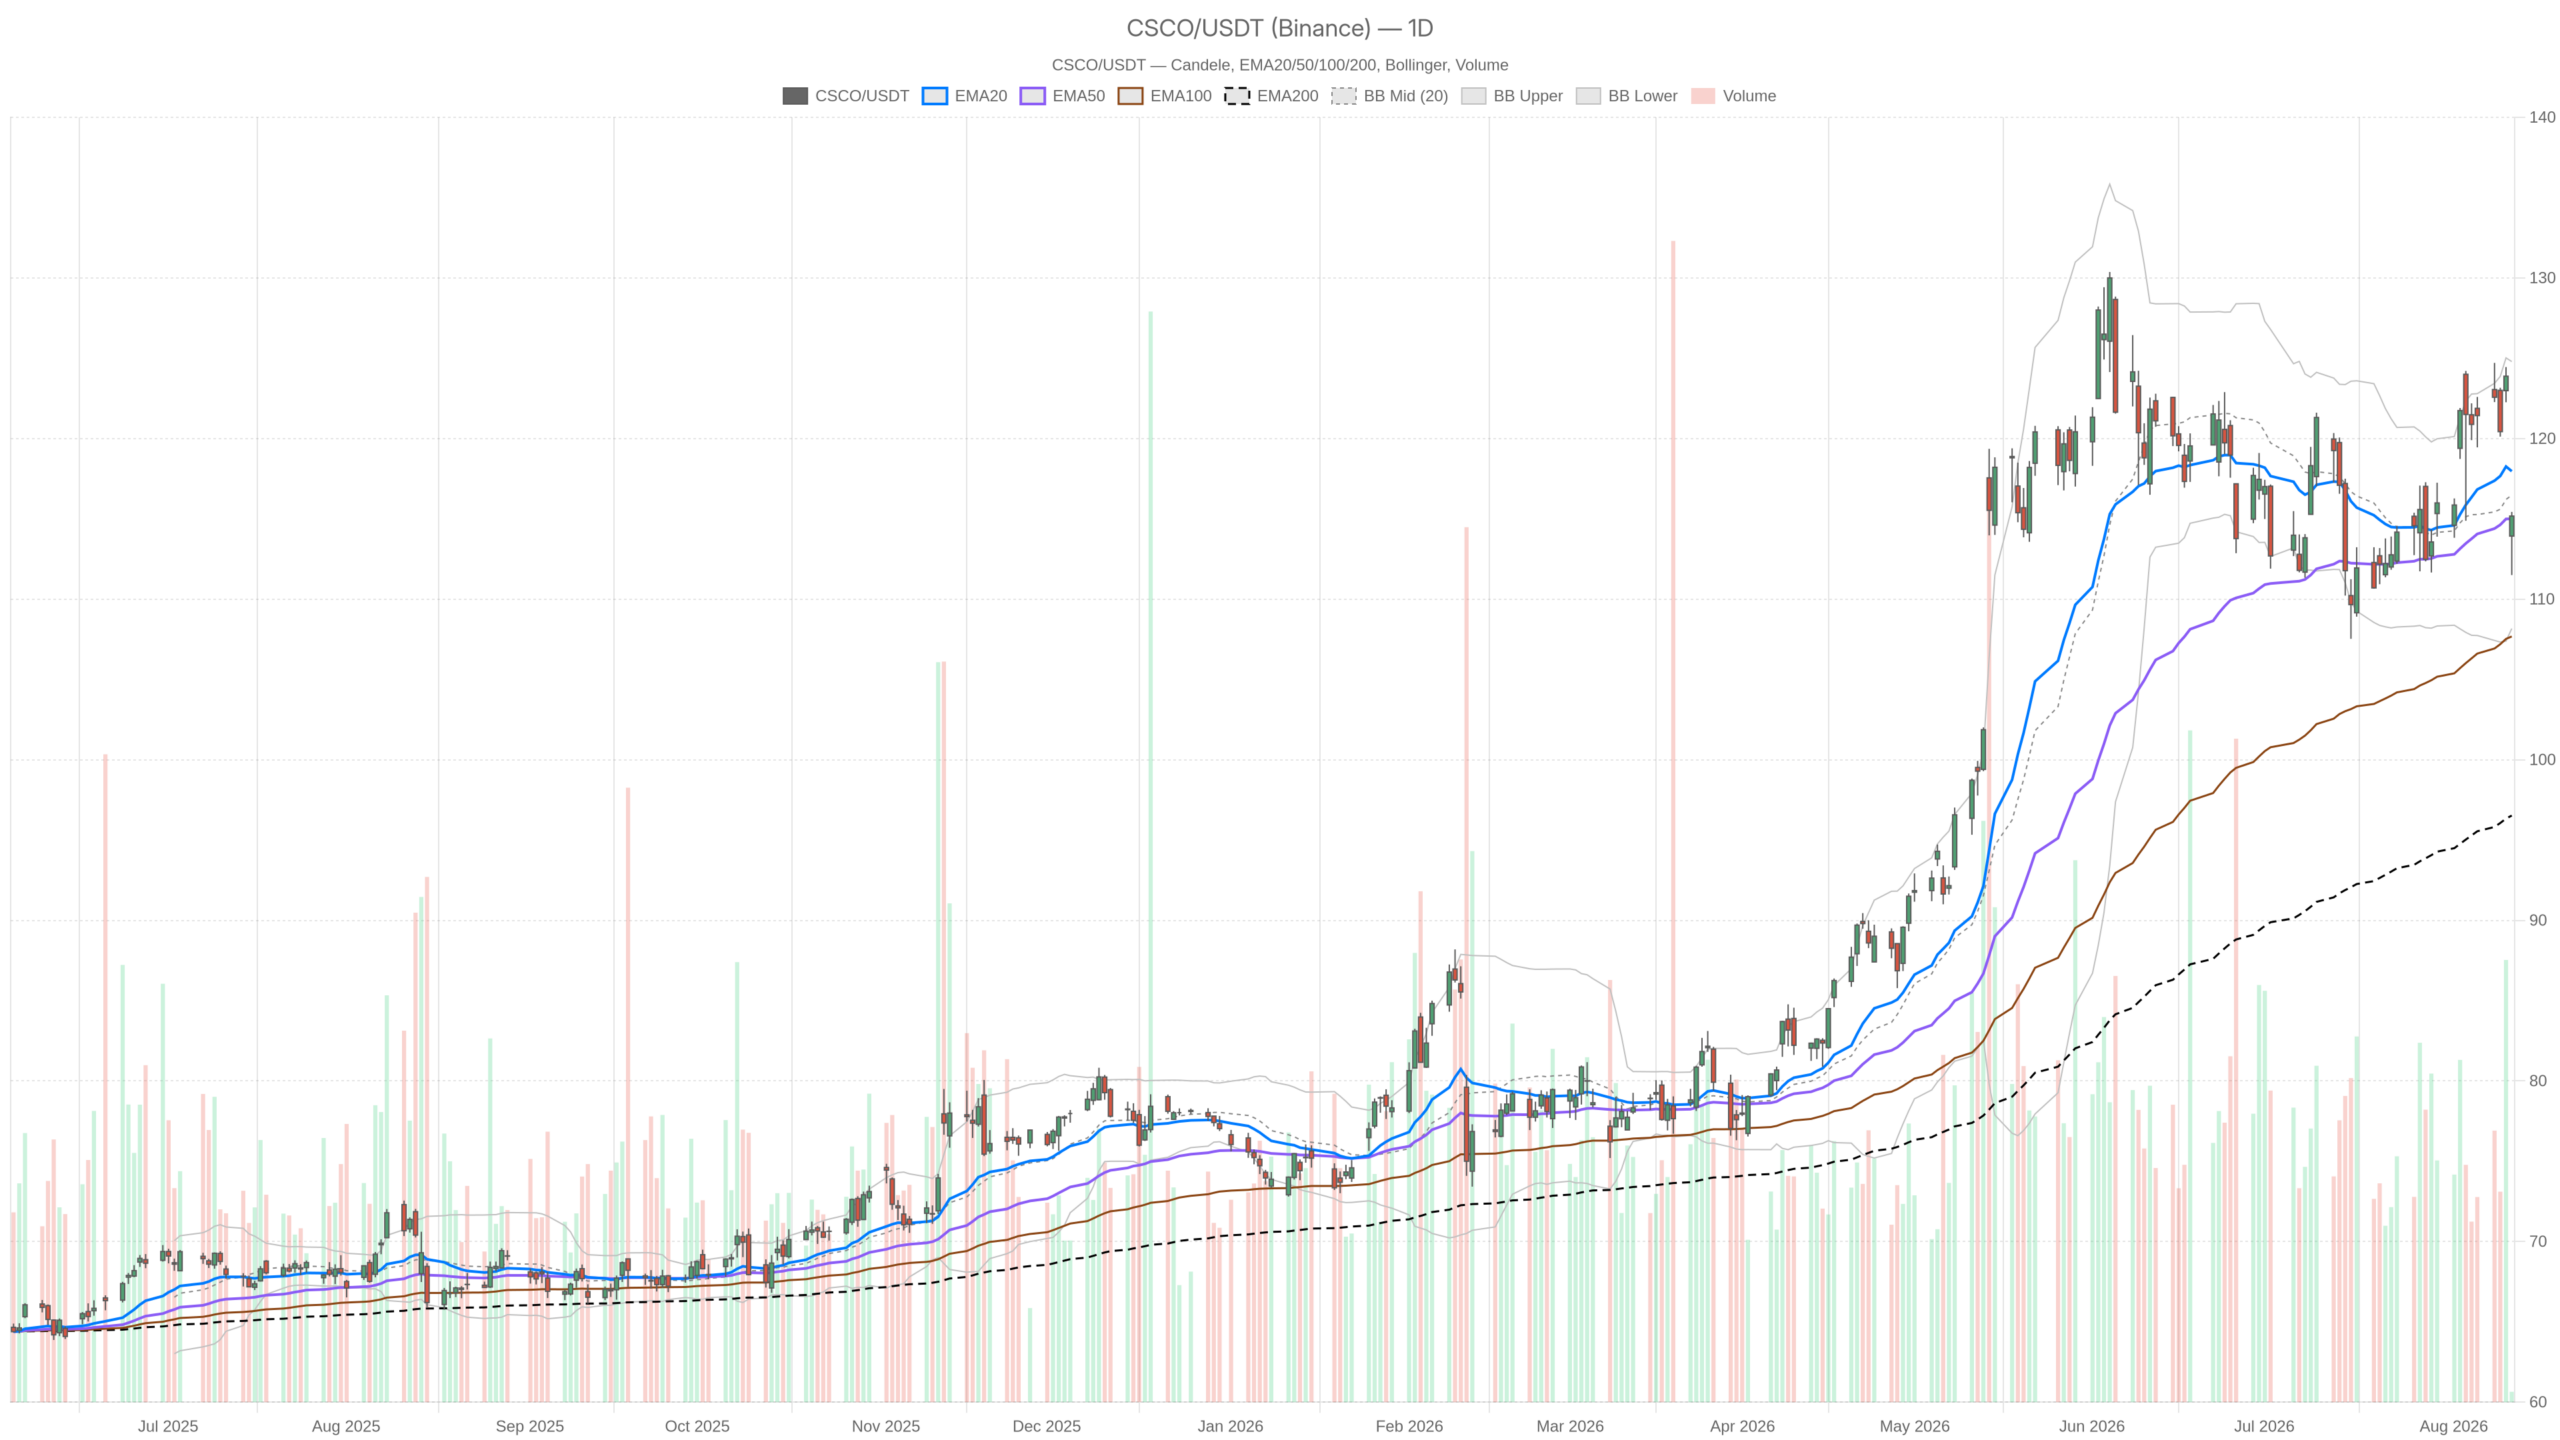
- The daily chart remains constructive with price well above the EMA200 at 96.52, but short-term moving averages have been breached.
- Hourly RSI14 sits at 28.42 and 15-minute RSI14 at 24.09, both deep in oversold territory.
- Key support rests at the daily EMA50 near 115 and S1 pivot at 112.64; a break below opens the path toward 108.17.
The daily close of 115.17 came off an intraday low of 111.5 and a high of 115.43, following an open at 113.92. That range shows real two-way volatility around the earnings reaction, not a clean directional move. On the higher timeframe, the broader trend context still favors the bulls. However, the short-term tape tells a different, more nervous story.
CSCO Stock Daily Structure: Long-Term Uptrend Still Intact, Short-Term Pause
On the daily chart, CSCO stock sits just above the EMA50 at 115 but below the EMA20 at 117.96. That positioning signals a short-term stall within a larger structure. Meanwhile, the EMA200 sits at 96.52, meaning price remains well above its long-term trend average. That gap confirms the primary uptrend is still very much alive, even if the last session introduced some friction.
Daily RSI14 reads 46.36, essentially neutral. It is neither overbought nor oversold, which fits a market digesting news rather than trending hard in either direction. The daily MACD line at 1.43 remains above its signal line at 1.1, with a positive histogram of 0.33. That keeps the daily momentum signal constructive, though the shrinking histogram suggests bullish momentum is losing some steam rather than accelerating.
Bollinger Bands on the daily frame show a mid-line at 116.48, with the upper band at 124.79 and the lower band at 108.17. Price sits comfortably inside this range, near the midpoint. Notably, that is not a volatility extreme on the daily timeframe, despite how sharp the intraday reaction has been. Daily ATR14 stands at 4.66, a reminder that Cisco is capable of wide daily swings, and traders should size positions accordingly.
Pivot Points and Daily Regime Classification
The daily pivot sits at 114.03, with resistance at R1 116.57 and support at S1 112.64. Price closing at 115.17 puts it between the pivot and R1, technically on the firmer side of the level. Overall, the daily regime is classified as neutral. That label fits: constructive long-term trend, but no clear short-term directional conviction yet.
1H and 15m Timeframes Show a Sharper Bearish Undertone for CSCO Stock
The hourly chart complicates the daily narrative considerably. EMA20 at 121.79, EMA50 at 120.89, and EMA200 at 117.85 all sit above the current price of 115.17. In other words, CSCO stock has broken below every major hourly moving average, a clear short-term bearish signal. In contrast to the daily’s neutral RSI, the hourly RSI14 sits at 28.42, deep into oversold territory.
Hourly Momentum and Volatility Breakdown
The hourly MACD confirms the weakness: the line at -0.07 sits below the signal at 0.32, producing a negative histogram of -0.4. Momentum on this timeframe is clearly negative. Hourly Bollinger Bands show a mid-line of 122.18, an upper band of 126.42, and a lower band of 117.94. With price at 115.17, it is trading below the lower band entirely. That is a genuine volatility extreme, consistent with a sharp, news-driven repricing rather than an orderly pullback. Hourly ATR14 at 1.94 also reflects an expansion in short-term volatility around the earnings release.
15-Minute Chart Reinforces the Oversold Signal
The 15-minute chart reinforces this bearish short-term read. EMA20, EMA50, and EMA200 sit at 121.03, 121.8, and 120.87 respectively, all above the current price. RSI14 on the 15m timeframe reads 24.09, even more oversold than the hourly reading. MACD shows a line of -1.33 against a signal of -0.25, with a histogram of -1.08 — deeply negative momentum. The 15m Bollinger lower band sits at 115.68, with price essentially testing that level. Meanwhile, the 15m pivot at 114.78, with resistance at R1 115.64 and support at S1 114.31, frames the immediate execution range for short-term participants.
The Core Conflict in CSCO Stock: Long-Term Trend vs Short-Term Selloff
Therefore, the setup here is a genuine conflict rather than a clean signal. The daily timeframe still reflects a stock well above its EMA200, with neutral RSI and a positive, if fading, MACD histogram. At the same time, the 1H and 15m timeframes both show oversold RSI readings, negative MACD histograms, and price trading below every short-term moving average. In short, this is a long-term uptrend absorbing a sharp, earnings-driven short-term shock.
News flow explains the disconnect. Cisco’s results were framed as solid, and the AI-led outlook struggled to clear unusually high expectations. The company itself has said AI-driven network upgrades are “just not optional” for enterprises, underscoring genuine demand strength. Despite that, CSCO stock slipped after-hours and extended losses premarket. It was a textbook sell-the-news pattern where a beat-and-raise quarter still disappoints a market pricing in even more.
Bullish Scenario for CSCO Stock
A bullish case would need price to stabilize above the daily EMA50 near 115 and hold the S1 pivot support at 112.64. A reclaim of the daily EMA20 at 117.96, followed by a push through the R1 resistance at 116.57, would suggest the intraday selloff is exhausting itself. In that scenario, the oversold hourly and 15m RSI readings would function as a coiled spring rather than a warning sign. Strong revenue growth and AI-driven guidance would provide the fundamental backdrop for a recovery toward the daily Bollinger mid-line at 116.48 and beyond.
Bearish Scenario for CSCO Stock
On the other hand, a bearish continuation would involve a daily close below the EMA50 at 115 and a break of S1 support at 112.64. That would invalidate the near-term stabilization thesis and open the door toward the daily Bollinger lower band at 108.17. Notably, that area is consistent with the elevated ATR14 reading of 4.66. In this case, the currently oversold hourly and 15m conditions would simply reflect the early stage of a deeper repricing, rather than a base for a bounce. Momentum on both shorter timeframes would continue to point lower.
Overall, CSCO stock sits at a genuine crossroads between a resilient long-term uptrend and an aggressive short-term repricing. The daily chart argues for patience, given the EMA200 distance and neutral momentum readings. In contrast, the 1H and 15m charts argue for caution, given oversold conditions that have not yet produced a clear reversal signal. Volatility, as reflected in the daily ATR14 of 4.66 and the extreme hourly Bollinger breach, is likely to remain elevated in the immediate sessions ahead. Given this mix of strong fundamentals and fragile short-term technicals, positioning decisions around CSCO stock should weigh both the daily support levels near 115 and 112.64 and the possibility that intraday weakness persists before any meaningful stabilization takes hold.
FAQ
Why did CSCO stock fall despite beating earnings estimates?
Cisco posted a beat-and-raise quarter with Q4 revenue of $17.25 billion versus the $16.82 billion estimate, but the AI-led outlook failed to clear unusually high market expectations. This triggered a classic sell-the-news reaction, with shares dropping more than 5% as the market had already priced in even stronger results.
What are the key support levels for CSCO stock right now?
The immediate support to watch is the daily EMA50 near 115, followed by the S1 pivot at 112.64. A break below that level would open the path toward the daily Bollinger lower band at 108.17, which aligns with the elevated daily ATR14 reading of 4.66.
Are the oversold RSI readings on the 1H and 15m charts a buy signal?
Not necessarily. The hourly RSI14 at 28.42 and 15-minute RSI14 at 24.09 are deep in oversold territory, but they have not yet produced a clear reversal signal. In a bullish scenario, these could act as a coiled spring for a bounce. However, in a bearish continuation, they would simply reflect the early stage of a deeper repricing.
Is the long-term uptrend in CSCO stock still intact?
Yes. Despite the sharp intraday selloff, CSCO stock remains well above its EMA200 at 96.52, and the daily MACD histogram is still positive at 0.33. The primary uptrend is alive, though short-term momentum has clearly stalled.
Disclaimer: This article is for informational purposes only and does not constitute financial advice, an investment recommendation, or a solicitation to buy or sell any financial instrument or cryptocurrency. The analysis provided is not indicative of future results. Investing in crypto assets and financial markets carries a high risk of capital loss. Always do your own research (DYOR) and consult a qualified financial advisor before making any decision.
Article produced with the assistance of artificial intelligence and reviewed by the editorial team.
