



Netflix, Inc. stock is showing a genuine shift in short-term character. Price has reclaimed its 20- and 50-day averages and momentum is turning higher. However, the daily structure still carries scars from a deeper downtrend — and that tension is precisely what makes this setup worth dissecting.
Summary
Key takeaways
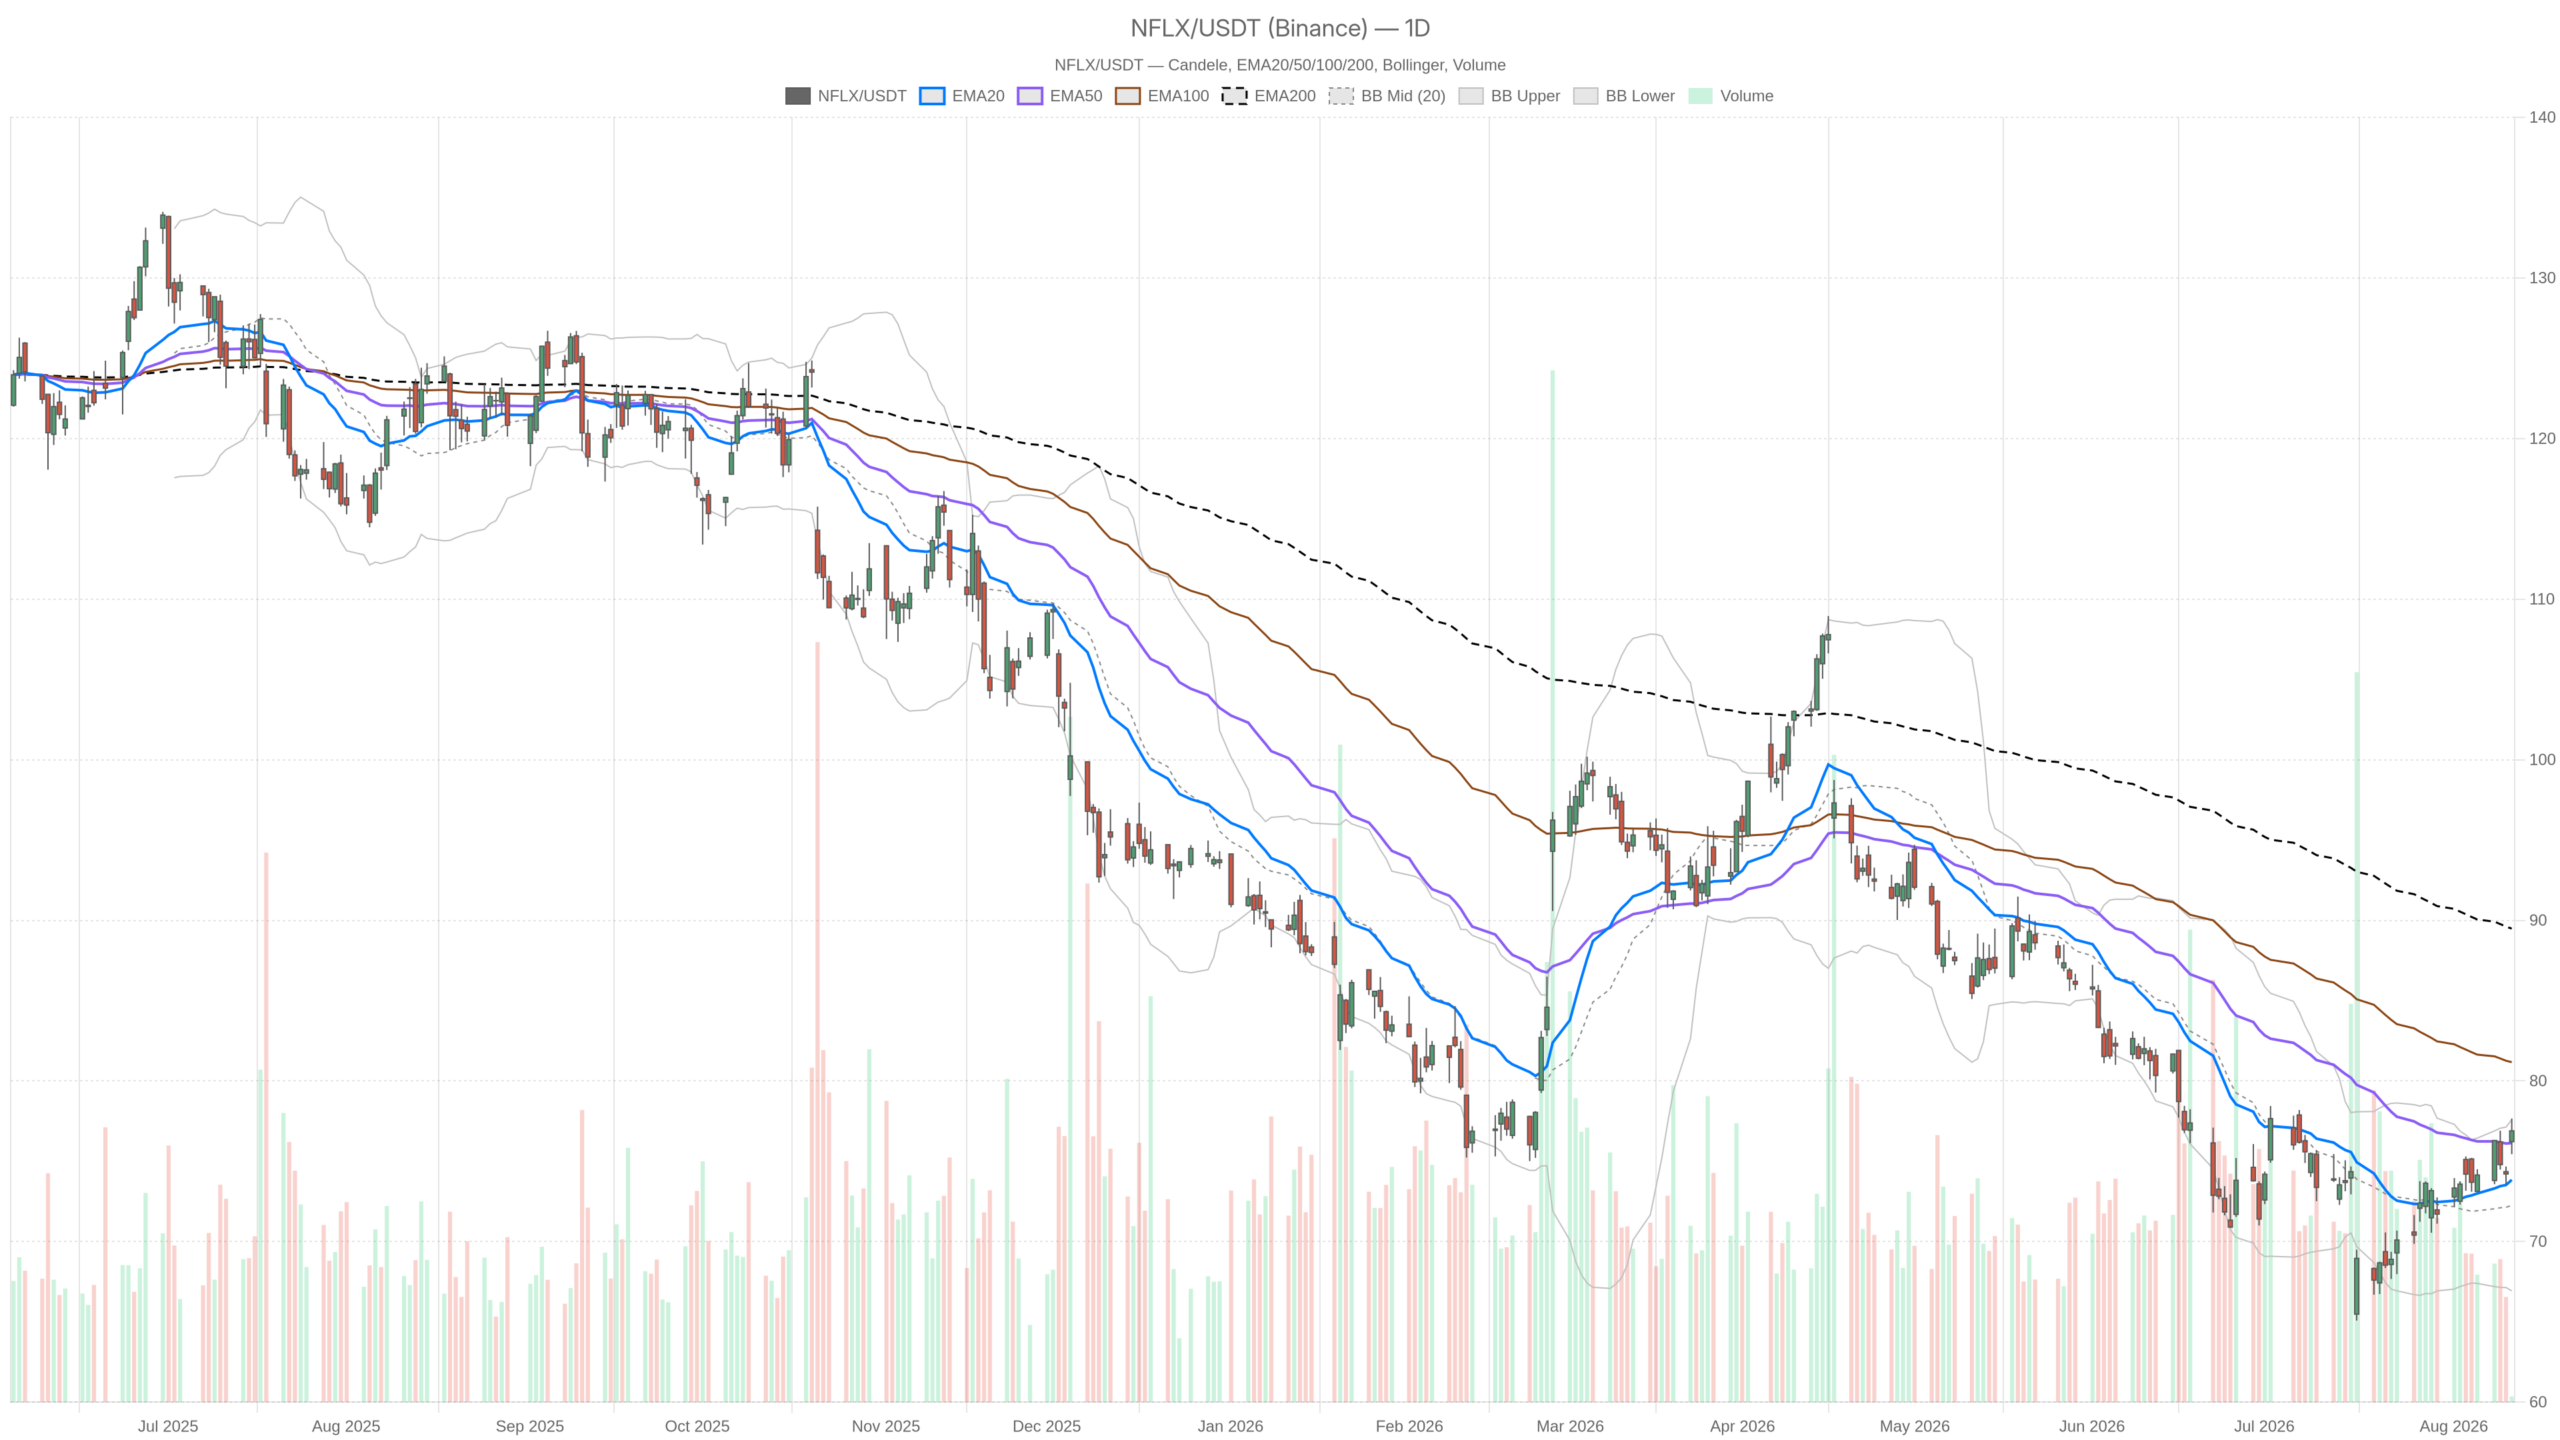
- NFLX closed at 76.89, above both the 20-day EMA (73.84) and 50-day EMA (76.13).
- Daily RSI14 at 59.02 and a bullish MACD crossover confirm building momentum, with the histogram at 0.71.
- The 200-day EMA remains far overhead at 89.48, keeping the daily regime neutral despite short-term strength.
- Bill Ackman’s Pershing Square disclosed a new stake, stating Netflix “has effectively won the streaming wars.”
- Near-term resistance sits at 77.89 (daily R1), with support at 76.66 (daily pivot) and 75.67 (daily S1).
NFLX Daily Structure: Improving, But Not Yet a Clean Uptrend
Netflix, Inc. stock has improved on the daily chart but has not yet established a clean uptrend. The recovery is constructive, though the longer-term moving average tells a more cautious story.
NFLX closed at 76.89, comfortably above both the 20-day EMA (73.84) and the 50-day EMA (76.13). That alignment is constructive. Yet the 200-day EMA sits far above at 89.48 — a gap that explains why the system still labels the daily regime as neutral rather than bullish. In practical terms, the stock is recovering, not yet trending.
Momentum backs up the improvement. RSI14 stands at 59.02, firmly above the midpoint but nowhere near overbought. This leaves room for further upside without immediate exhaustion risk. The MACD line at 0.24 has crossed above its signal line at -0.47. The histogram reading of 0.71 confirms building bullish pressure.
Meanwhile, price is pressing against the upper Bollinger Band (77.59). The mid-band at 72.26 acts as a broader pivot for the recovery. Daily ATR14 of 2.25 points to meaningful, but not extreme, volatility. On the pivot grid, the daily pivot at 76.66 has already been reclaimed. Resistance at R1 (77.89) is now the immediate upside target. S1 (75.67) marks the first line of defense below.
1H Timeframe: Confirmation With a Hint of Overheating
The hourly chart confirms that a short-term uptrend is already in place. However, momentum readings suggest the move is becoming stretched.
All three EMAs are stacked bullishly. The 20-EMA (75.08) sits above the 50-EMA (74.38), which sits above the 200-EMA (73.67). That is a clean short-term uptrend structure. The 1H regime is explicitly tagged bullish — in contrast to the daily’s neutral read. This is the core conflict: the intraday trend has turned decisively higher, while the daily structure is still repairing a much larger technical gap.
RSI14 on the 1H chart has climbed to 67.51, approaching overbought territory. MACD remains constructive, with the line (0.42) above the signal (0.20) and a positive histogram of 0.22. Still, that histogram is narrower than ideal for a fresh breakout. Price is trading near the upper Bollinger Band (77.16). The 1H pivot at 76.80 is where price sits right now. R1 at 77.05 is just overhead, and S1 at 76.64 is close beneath.
15m Execution Context: Momentum Cooling Near Resistance
On the 15-minute chart, short-term momentum is now flashing caution for fresh entries. Netflix, Inc. stock is stalling near the same resistance levels visible on higher timeframes.
RSI14 has pushed to 70.44 — a level that typically warrants caution. The MACD histogram has narrowed to 0.17, down from the 1H reading of 0.22. This is a subtle sign that upside momentum is decelerating into resistance rather than accelerating through it. Price remains capped between the same pivot levels seen on the hourly chart. R1 sits at 77.05 and S1 at 76.64. The immediate battle is playing out in a tight range just above the daily pivot.
Fundamental Backdrop Adds Support for Netflix, Inc. Stock
The technical recovery in Netflix, Inc. stock is coinciding with notable news flow that helps explain the renewed buying interest. Institutional and analytical voices have turned notably more constructive.
Bill Ackman’s Pershing Square disclosed a new stake as part of what was described as the fund’s biggest portfolio overhaul in years. Ackman stated that Netflix “has effectively won the streaming wars.” Separately, a Seeking Alpha analysis framed the stock as trading around 20x forward earnings. The piece pointed to the company’s Ads Suite, pricing power, and margin trajectory as drivers of monetization ahead of a potential re-rating window.
On the content side, Netflix continues to lean into live sports. It streamed the MLB Field of Dreams game as part of a broader 2026 package that also includes NFL and WWE Raw programming. None of this changes the chart mechanically. But it does help explain why buyers have shown up at this particular juncture.
Bullish Scenario
A bullish outcome for Netflix, Inc. stock hinges on a clean break above immediate resistance. Specifically, a sustained move above the daily high of 77.66, followed by a close beyond daily R1 at 77.89, would be the clearest signal that the recovery is turning into a trend.
For that to hold, RSI on the shorter timeframes would need to cool off from current overbought readings without triggering a sharp pullback. Essentially, momentum would need to reset through time rather than through price. Continued institutional interest, echoing the Ackman disclosure, would add credibility to a re-rating narrative that markets appear to be starting to price in.
Bearish Scenario
Conversely, a rejection near current resistance would carry more weight given how stretched the 15m and 1H RSI readings already are. A failure to hold above the daily 50-EMA (76.13) or the daily pivot (76.66) would invalidate the near-term bullish case.
In that scenario, price would likely revisit the daily S1 at 75.67. The 20-day EMA at 73.84 would serve as a deeper support zone. Notably, the 200-day EMA remains far overhead at 89.48. Any loss of short-term momentum would occur against a backdrop where the longer-term trend has not yet confirmed a genuine reversal.
Closing Take
Overall, Netflix, Inc. stock is caught between a strengthening short-term trend and a daily structure that is still labeled neutral for good reason. The 1H and 15m timeframes are aligned bullish. But overbought readings on the shorter horizons suggest the next move could be choppy before it is directional.
Therefore, positioning around current levels calls for discipline. Proximity to resistance and elevated volatility implied by the daily ATR both argue for caution. Given the mix of technical recovery and fresh fundamental interest, the setup remains fluid. Near-term price action around the 76.66–77.89 zone will likely determine which scenario takes control next.
FAQ
What is the current price of Netflix stock and its key moving averages?
Netflix, Inc. stock closed at 76.89, trading above its 20-day EMA (73.84) and 50-day EMA (76.13). However, the 200-day EMA remains significantly higher at 89.48, keeping the broader daily structure neutral.
Is Netflix stock in a bull market or still recovering?
The 1H timeframe shows a confirmed bullish trend, while the daily chart is still repairing damage from a deeper downtrend. The daily regime is labeled neutral because the 200-day EMA at 89.48 remains far above current price.
What is the key resistance level for NFLX right now?
Immediate resistance sits at the daily R1 pivot of 77.89. A sustained close above this level, following a break of the daily high at 77.66, would signal that the recovery is turning into a genuine uptrend.
What did Bill Ackman say about Netflix?
Bill Ackman’s Pershing Square disclosed a new stake in Netflix and stated that the company “has effectively won the streaming wars.” The disclosure came as part of what was described as the fund’s biggest portfolio overhaul in years.
Disclaimer: This article is for informational purposes only and does not constitute financial advice, an investment recommendation, or a solicitation to buy or sell any financial instrument or cryptocurrency. The analysis provided is not indicative of future results. Investing in crypto assets and financial markets carries a high risk of capital loss. Always do your own research (DYOR) and consult a qualified financial advisor before making any decision.
Article produced with the assistance of artificial intelligence and reviewed by the editorial team.
