




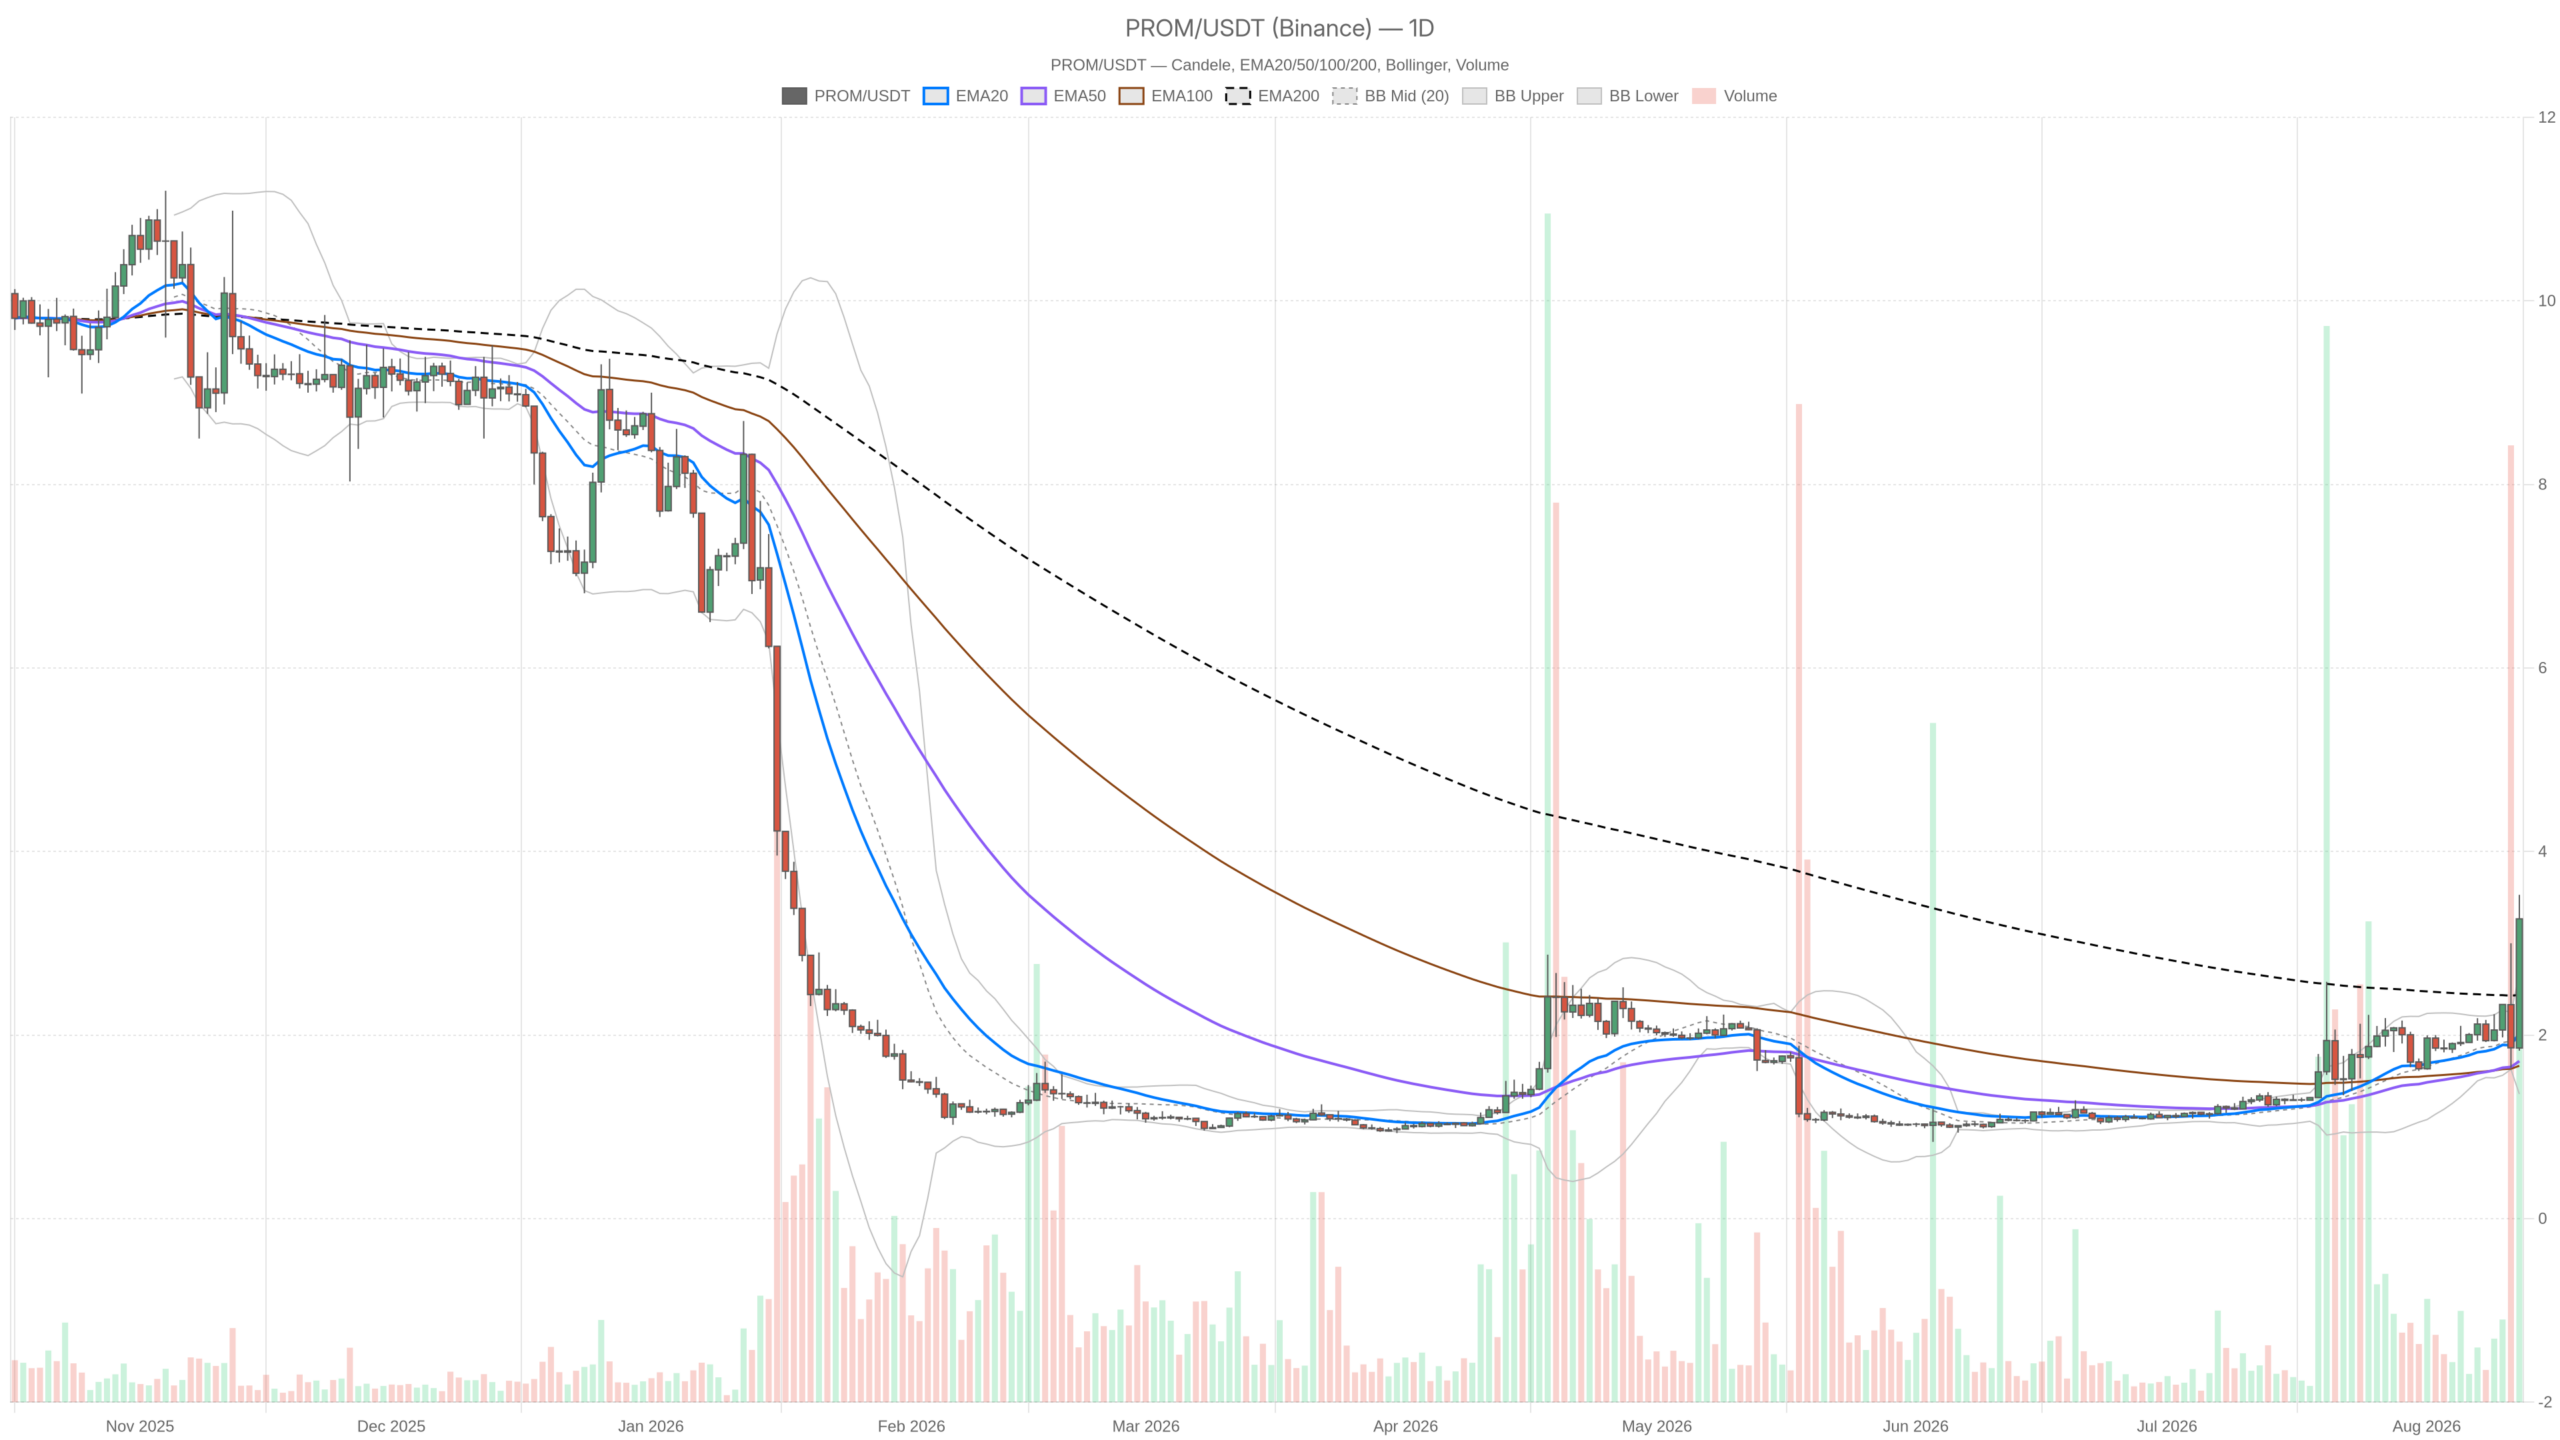
As of August 12, 2026, the broader crypto market sits defensive with Fear at 27 and total market cap barely moving, while Prom crypto stages an isolated vertical breakout. PROMUSDT has surged roughly 62% above its 20-day EMA, printing 3.27 on the daily — a move born of momentum, not structure.
Summary
Key takeaways
- PROMUSDT trades at 3.27, roughly 62% above its 20-day EMA at 2.02, while the Fear & Greed Index sits at 27.
- The daily chart registers as neutral despite the price surge, because the 200-day EMA at 2.44 remains above the shorter averages.
- Hourly RSI at 81.15 and price above the upper Bollinger band signal an overbought momentum condition, not a structural trend reversal.
- A daily close below 2.66 would mark the breakout as a spike; losing 2.87 would confirm failure.
- Broader market conditions offer no confirmation for this isolated rally, with flat aggregate cap and concentrated liquidity.
What the daily chart reveals about the setup
The daily chart shows a price that has jumped over its moving averages rather than one supported by a healed structural trend. Price at 3.27 sits above the 20-day EMA at 2.02, the 50-day at 1.72, and the 200-day at 2.44. However, the EMAs themselves remain ordered like a downtrend: the 200 above the 20, and the 20 above the 50. The trend has not turned — the price has simply leapt over it. Until the faster averages climb through 2.44 and hold, this remains a breakout in search of confirmation.
The Bollinger bands make the stretch impossible to ignore. The daily mid-band sits at 2.01, the upper band at 2.66, and the lower band at 1.36 — with price trading a full 0.61 above the upper band. Moreover, with daily ATR at 0.42, that is roughly 1.5 average daily ranges outside the statistical envelope. Moves like this do not resolve gently; they either drag the bands violently higher in a genuine expansion, or they snap back toward the mean once the marginal buyer disappears.
RSI at 72.07 on the daily is elevated but less extreme than the price extension suggests. This hints that the move is young and the oscillator has not yet had time to bleed. Meanwhile, the MACD supports that interpretation: line at 0.24 over signal at 0.17, with a positive histogram of 0.07. The histogram remains modest relative to the size of the price move — the kind of small divergence that tends to matter after the fact rather than during.
Pivot structure frames the battlefield cleanly. The daily pivot sits at 2.87, with R1 at 3.92 and S1 at 2.22. Price is comfortably above the pivot with plenty of air below and a distant upside reference. Practically speaking, 2.87 separates a healthy pullback from a failed breakout, while 3.92 acts as the magnet if the rally keeps running.
The 1H chart: confirmation with a warning attached
The hourly chart is unambiguously bullish and cleanly ordered. The EMA20 at 2.26 sits above the EMA50 at 2.16, which sits above the EMA200 at 2.03, with price at 3.23 well clear of all three. This is the timeframe where the trend actually exists in textbook form. The MACD reading — line at 0.15, signal at 0.01, histogram at 0.14 — shows acceleration rather than fatigue. That indicates real intraday demand, not drift.
The warning comes from RSI at 81.15. Deeply overbought hourly readings in a market with hourly ATR at just 0.20 mean the move has travelled far relative to its normal breathing room. Crucially, price sits above the hourly upper Bollinger band at 2.90, with the mid-band all the way down at 2.13 — a gap of over a dollar between spot and its own hourly equilibrium. The hourly pivot sits at 3.23, with R1 at 3.53 and S1 at 2.93.
That makes 3.23 the intraday fulcrum: hold it and the 3.53 area becomes the next test; lose it and 2.93 is the first real bid to defend.
15m: execution context, not direction
The 15-minute chart is bullish and tightly stacked, with the EMA20 at 2.59, EMA50 at 2.28, and EMA200 at 2.13. RSI reads 77.94, while the MACD histogram stands at 0.11 with the line at 0.34 above signal at 0.23. Crucially, price at 3.23 is now inside the 15m upper band at 3.48 — the first sign of local cooling after the impulse. Micro pivots are tight: 3.21 as balance, 3.39 above, 3.05 below.
With 15m ATR at 0.29, the noise band is wide enough that anyone treating 3.20 as a precise line will get shaken out repeatedly. So where is the tension? The daily chart says neutral structure with extreme extension. The hourly and 15m charts say strong trend, overbought. Those readings do not cancel out — they define the trade type. This is a momentum condition, not a value condition.
Bullish scenario and what kills it
The constructive path is straightforward. PROMUSDT holds above the 3.23 hourly pivot, uses the 3.05 to 2.93 zone as a shelf on any flush, and grinds toward 3.39 and then 3.53. A decisive push through 3.53 opens the daily R1 at 3.92 as the logical destination. At that point, the daily EMAs would be curling up fast enough to eventually resolve the 2.44 problem — turning a breakout into a genuine trend reversal.
What invalidates the bullish case: a daily close back inside the Bollinger envelope, below 2.66, would mark the extension as a spike rather than a regime shift. Losing 2.87 after that would confirm it. The other, quieter killer is time — if price stalls sideways up here while the hourly MACD histogram rolls over from 0.14 toward zero, the move loses its fuel without needing a dramatic breakdown.
Bearish scenario and what kills it
The reversion case is arithmetic. Price sits 1.5 daily ATRs above the upper band and roughly 62% above the 20-day EMA, with hourly RSI at 81 in a market where the Fear & Greed reading is 27. Broader participation is not confirming this rally. A break of 2.93 on the hourly would be the first genuine crack. Below that, the vacuum runs toward the daily pivot at 2.87, then the 200-day EMA at 2.44.
In the uglier case, the daily upper band at 2.66 flips from support into resistance. Daily S1 at 2.22 is the deeper reference, and with the 20-day EMA at 2.02 and the mid-band at 2.01, that zone is where the chart would fully reset. However, any pullback that holds the 2.93 to 3.05 zone and produces a higher low would invalidate the bearish case, especially if the hourly MACD stays positive through the dip. Overbought readings in a real expansion are a feature, not a sell signal.
Why the macro backdrop argues for caution
The macro backdrop is not supportive of broad speculative appetite. Fear at 27, Bitcoin dominance at 56.31%, and aggregate market cap down marginally on the day while volumes rose only 2.54% — that signals rotation and defensiveness, not a bull impulse. On-chain activity tells a similarly two-speed story. According to DefiLlama, Uniswap V3 fees fell 26.41% over 24 hours and 18.42% on the week, Curve DEX dropped 32.27% on the day, and Ekubo declined 42.71%.
Meanwhile, Fluid DEX bucked the trend with fees up 26.53% in a day and 115.52% over the week. Liquidity is not disappearing; it is concentrating into fewer venues and fewer names. A single asset — Prom crypto — ripping 60% above its own mean fits that pattern uncomfortably well. Moreover, Fortune reported on August 11, 2026 that Trump’s media and crypto firm posted a $238 million quarterly loss — the kind of story that reinforces defensive positioning rather than inviting fresh capital into high-beta alt exposure.
Positioning the risk
The honest read: momentum owns this chart in the short term, and structure has not yet agreed. Anyone participating on the long side is trading a young, fast, thin move where the reference levels are 3.23 intraday, 3.53 and 3.92 above, and 2.93 and 2.87 below. With daily ATR at 0.42, a perfectly normal day can travel 13% of current price without meaning anything at all. That volatility number is the real risk parameter here, not the RSI.
Two things deserve respect. First, the gap between price and every mean on the chart is historically wide, and gaps like that close eventually — the only question is whether they close by the mean rising or the price falling. Second, this rally is happening without the broader market’s help, which means it can lose its bid faster than a broad-based move would. Waiting for a first pullback that holds is a slower way to participate.
However, it is the only way to know whether the daily structure is actually repairing or whether the asset just had one very loud week. Until 2.44 flips from overhead reference to confirmed support beneath the shorter averages, treat this as a momentum episode with a wide error bar — not a settled trend.
FAQ
Why is PROMUSDT rallying while the broader market sits in fear?
The move appears to be a liquidity-driven, idiosyncratic expansion rather than a broad trend. With the Fear & Greed Index at 27 and total market cap flat, the rally reflects thin order books and forced chasing off a compressed base — not a structural shift in sentiment.
What are the key levels to watch for PROMUSDT?
The intraday fulcrum is 3.23, with resistance at 3.53 and 3.92 above, and support at 2.93 and 2.87 below. A daily close below 2.66 would mark the breakout as a spike, while holding above 2.87 keeps the constructive case alive.
Is the PROMUSDT trend structurally confirmed?
No. Despite price trading above all major moving averages, the daily chart regime remains neutral because the 200-day EMA at 2.44 still sits above the 20- and 50-day EMAs. Until the faster averages climb through 2.44 and hold, this is a breakout seeking confirmation.
Disclaimer: This article is for informational purposes only and does not constitute financial advice, an investment recommendation, or a solicitation to buy or sell any financial instrument or cryptocurrency. The analysis provided is not indicative of future results. Investing in crypto assets and financial markets carries a high risk of capital loss. Always do your own research (DYOR) and consult a qualified financial advisor before making any decision.
Article produced with the assistance of artificial intelligence and reviewed by the editorial team.
